

Nonviral mcDNA-mediated bispecific CAR T cells kill tumor cells in an experimental mouse model of hepatocellular carcinoma
- PMID: 35879685
- PMCID: PMC9310485
- DOI: 10.1186/s12885-022-09861-1
Nonviral mcDNA-mediated bispecific CAR T cells kill tumor cells in an experimental mouse model of hepatocellular carcinoma
Abstract
Background: Hepatocellular carcinoma (HCC) is one of the most common cancers worldwide and the adoptive immunotherapy of which is worth studying. CD133, a kind of cancer stem cell (CSC) antigen, together with glypican-3 (GPC3) has been proved to be highly expressed in HCC cells and both of them are used as targets to generate chimeric antigen receptor (CAR) T cells. But there are limitations like "off-target" toxicity, low transfection efficacy and weak antitumor ability in CAR T cells treatment.
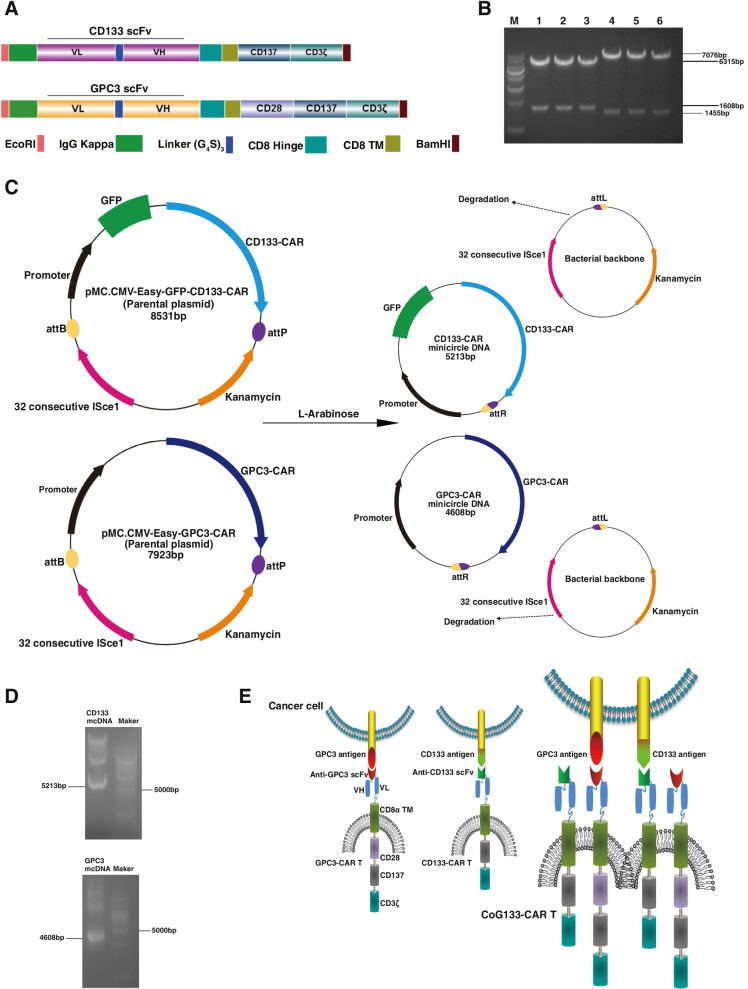
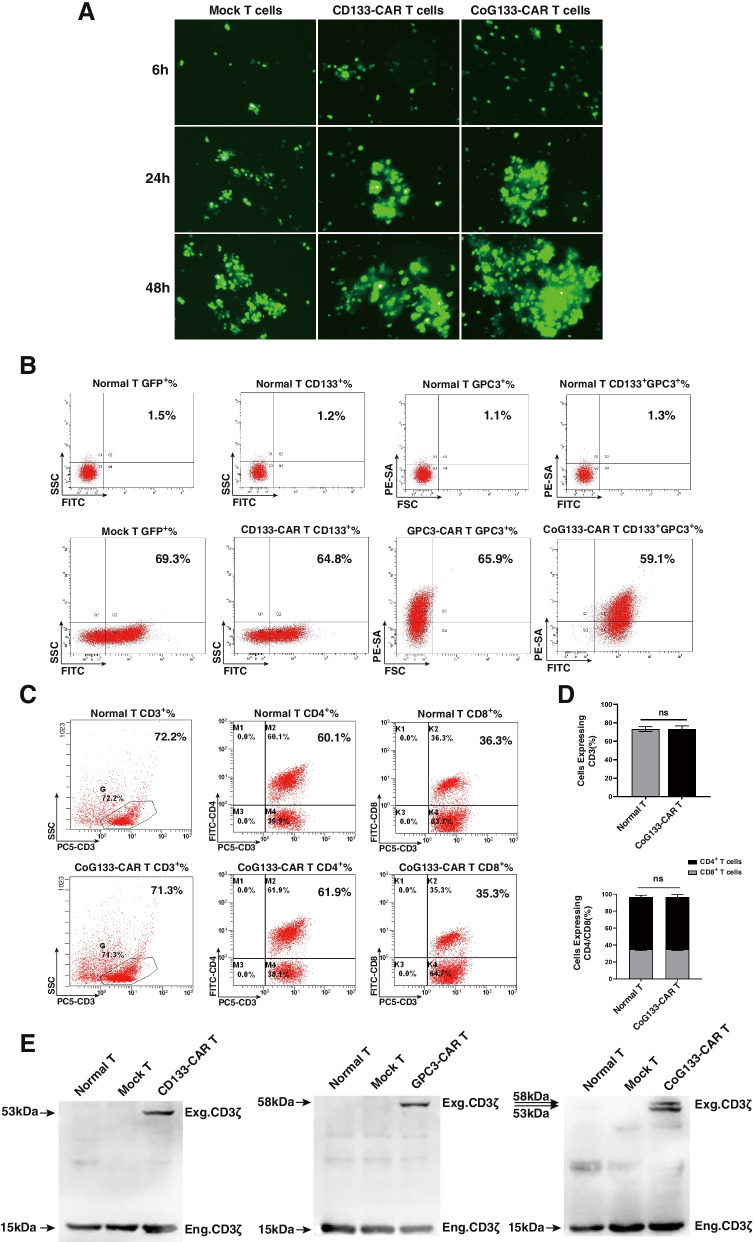
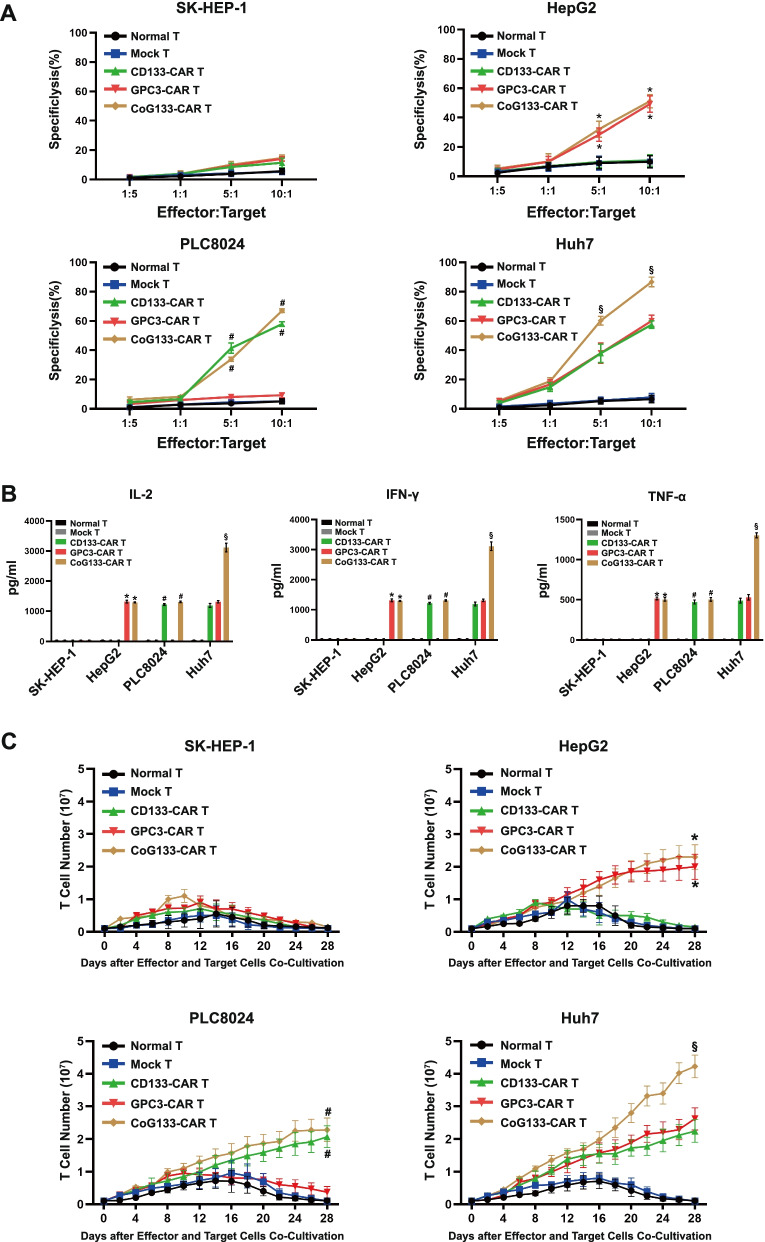
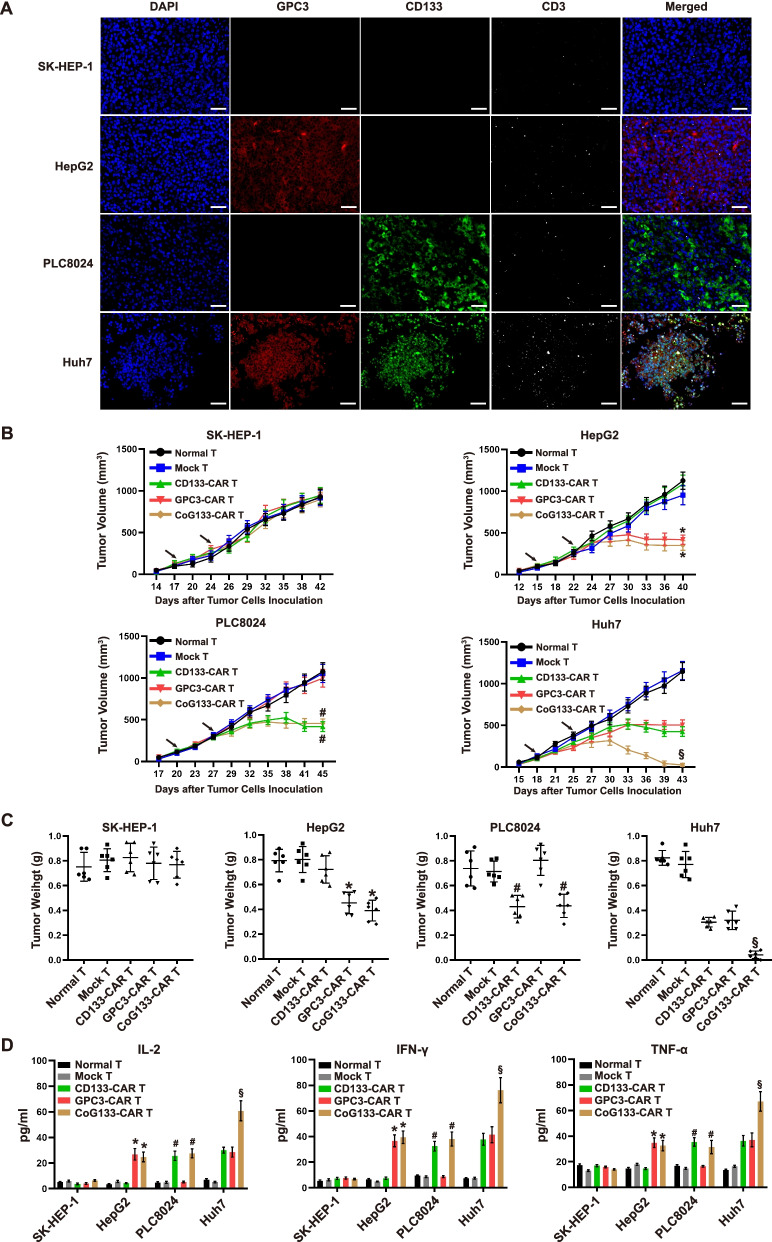
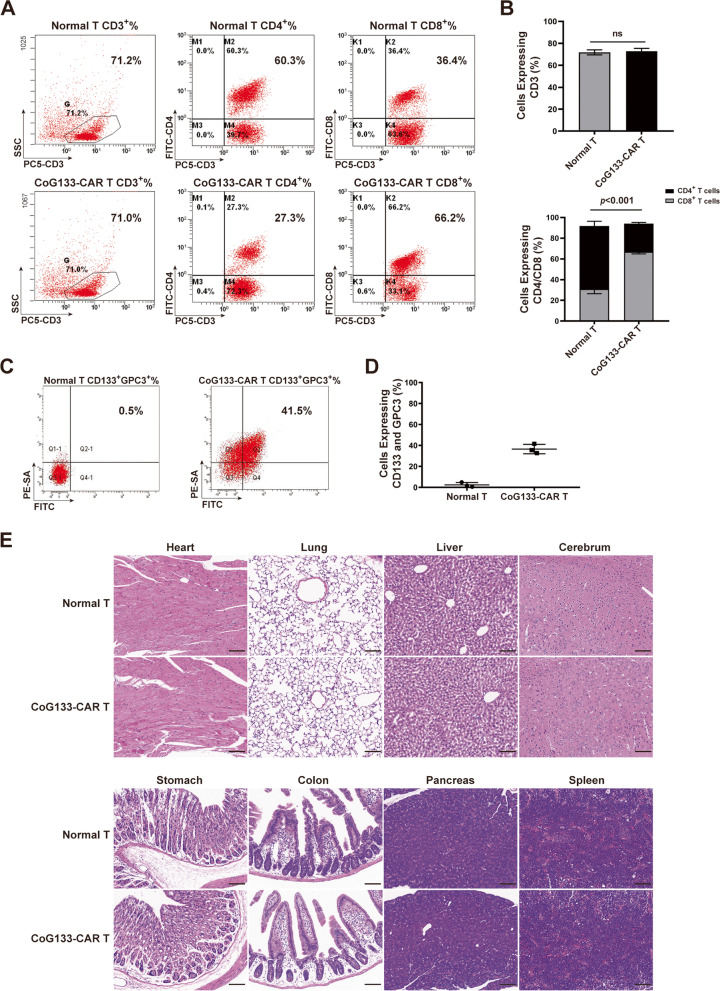
Methods: The peripheral blood was acquired from healthy donors and T cells were separated by density-gradient centrifugation. We used an electroporation system to deliver anti-CD133 and anti-GPC3 single chain Fragment variable (scFv) structures as target genes into the T cells. The cell membrane was opened by the momentary electric current effect, and the target gene was delivered into the cell by non-viral minicircle DNA (mcDNA) vector. The flow cytometry and western blot assays were used to detect whether the two scFv were simultaneously transfected and the transfection efficacy of this bispecific CAR T cell generation method. We respectively detected the in vitro and in vivo tumor-suppression efficacy of CAR T cells through the CCK-8 assays and the HCC xenograft mice models. The CoG133-CAR T cells containing both CD133 and GPC3 antigen recognition sites were the effector cells. CD133-CAR T cells and GPC3-CAR T cells were defined as single-targeted control groups, normal T and mock T cells were defined as blank control groups.
Results: The mcDNA vector accommodated two target gene structures successfully transfected to generate bispecific CAR T cells. The detection methods on gene level and protein level confirmed that CoG133-CAR T cells had considerable transfection efficiency and exhibited both antigen-binding capacity of CD133 and GPC3. Compared to single-targeted CAR T cells or control T cells, CoG133-CAR T cells performed enhanced eliminated efficacy against CD133 and GPC3 double-positive HCC cell line in vitro and HCC xenograft mice in vivo. Hematoxylin and eosin (H&E) staining indicated no fatal "off-target" combination existed on CoG133-CAR T cells and major organs.
Conclusion: Our study suggests that it is with higher efficiency and more safety to prepare bispecific CAR T cells through non-viral mcDNA vectors. CoG133-CAR T cells have enhanced tumor-suppression capacity through dual antigen recognition and internal activation. It provides an innovative strategy for CAR T therapy of HCC, even solid tumors.
Keywords: Bispecific CAR T cells; Cancer immunotherapy; Cancer stem cells; Hepatocellular carcinoma; Non-viral mcDNA vector.
© 2022. The Author(s).
Conflict of interest statement
The authors report no conflicts of interest in this work.
Figures


Similar articles
-
CAR-T cell therapy for hepatocellular carcinoma: current trends and challenges.Front Immunol. 2024 Nov 6;15:1489649. doi: 10.3389/fimmu.2024.1489649. eCollection 2024. Front Immunol. 2024. PMID: 39569202 Free PMC article. Review.
-
Development of T cells carrying two complementary chimeric antigen receptors against glypican-3 and asialoglycoprotein receptor 1 for the treatment of hepatocellular carcinoma.Cancer Immunol Immunother. 2017 Apr;66(4):475-489. doi: 10.1007/s00262-016-1949-8. Epub 2016 Dec 29. Cancer Immunol Immunother. 2017. PMID: 28035433 Free PMC article.
-
Chimeric antigen receptor-T cells targeting AFP-GPC3 mediate increased antitumor efficacy in hepatocellular carcinoma.Arab J Gastroenterol. 2025 Feb;26(1):84-93. doi: 10.1016/j.ajg.2024.12.002. Epub 2025 Jan 4. Arab J Gastroenterol. 2025. PMID: 39757079
-
Shed antigen-induced blocking effect on CAR-T cells targeting Glypican-3 in Hepatocellular Carcinoma.J Immunother Cancer. 2021 Apr;9(4):e001875. doi: 10.1136/jitc-2020-001875. J Immunother Cancer. 2021. PMID: 33833049 Free PMC article.
-
Chimeric antigen receptor-engineered T-cell therapy for liver cancer.Hepatobiliary Pancreat Dis Int. 2018 Aug;17(4):301-309. doi: 10.1016/j.hbpd.2018.05.005. Epub 2018 May 24. Hepatobiliary Pancreat Dis Int. 2018. PMID: 29861325 Review.
Cited by
-
CAR-T cell therapy for hepatocellular carcinoma: current trends and challenges.Front Immunol. 2024 Nov 6;15:1489649. doi: 10.3389/fimmu.2024.1489649. eCollection 2024. Front Immunol. 2024. PMID: 39569202 Free PMC article. Review.
-
Immunosuppression in tumor immune microenvironment and its optimization from CAR-T cell therapy.Theranostics. 2022 Aug 29;12(14):6273-6290. doi: 10.7150/thno.76854. eCollection 2022. Theranostics. 2022. PMID: 36168626 Free PMC article. Review.
-
Recent advancements in improving the efficacy and safety of chimeric antigen receptor (CAR)-T cell therapy for hepatocellular carcinoma.Naunyn Schmiedebergs Arch Pharmacol. 2025 Feb;398(2):1433-1446. doi: 10.1007/s00210-024-03443-7. Epub 2024 Sep 24. Naunyn Schmiedebergs Arch Pharmacol. 2025. PMID: 39316087 Review.
-
Targeting cancer stem cells with CAR-based immunotherapy: biology, evidence, and future directions.Cancer Cell Int. 2025 Jul 28;25(1):289. doi: 10.1186/s12935-025-03846-3. Cancer Cell Int. 2025. PMID: 40722155 Free PMC article. Review.
-
Chimeric Antigen Receptor T Cell Therapy for Hepatocellular Carcinoma: Where Do We Stand?Int J Mol Sci. 2024 Feb 23;25(5):2631. doi: 10.3390/ijms25052631. Int J Mol Sci. 2024. PMID: 38473878 Free PMC article. Review.
References
MeSH terms
Substances
LinkOut - more resources
Full Text Sources
Medical
Research Materials
