. 2022 Jul 25;22(1):817.
doi: 10.1186/s12885-022-09884-8.

Glycoprotein α-Subunit of Glucosidase II (GIIα) is a novel prognostic biomarker correlated with unfavorable outcome of urothelial carcinoma

Affiliations

Glycoprotein α-Subunit of Glucosidase II (GIIα) is a novel prognostic biomarker correlated with unfavorable outcome of urothelial carcinoma

Qiongqiong Lin et al. BMC Cancer. .

Abstract

Background: Urothelial carcinoma (UC) is among the most prevalent malignancies. The muscle-invasive bladder cancer (MIBC) shows an invasive feature and has poor prognosis, while the non-muscle invasive bladder cancer (NMIBC) shows a better prognosis as compared with the MIBC. However, a significant proportion (10%-30%) of NMIBC cases progress to MIBC. Identification of efficient biomarkers for the prediction of the course of UC remains challenging nowadays. Recently, there is an emerging study showed that post-translational modifications (PTMs) by glycosylation is an important process correlated with tumor angiogenesis, invasion and metastasis. Herein, we reported a data-driven discovery and experimental validation of GANAB, a key regulator of glycosylation, as a novel prognostic marker in UC.

Methods: In the present study, we conducted immunohistochemistry (IHC) assay to evaluate the correlation between the expression levels of GANAB protein and the prognosis of UC in our cohort of 107 samples using whole slide image (WSI) analysis. In vitro experiments using RNAi were also conducted to investigate the biological functions of GANAB in UC cell lines.

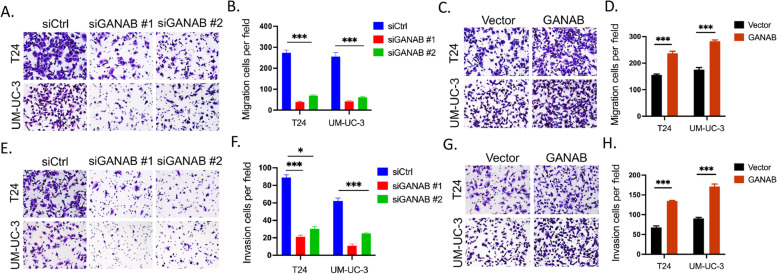
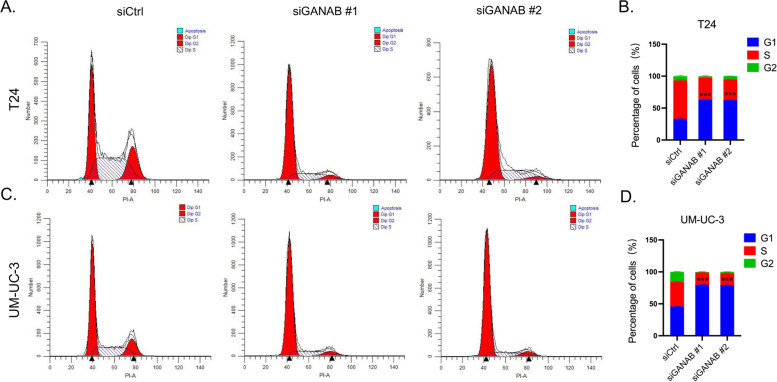
Results: We observed that positive GANAB protein expression was significantly correlated with poor prognosis of UC in our cohort, with p-value of 0.0017 in Log-rank test. Notably, tumor cells at the invasive front of the tumor margin showed stronger GANAB expression than the tumor cells inside the tumor body in UCs. We further validated that the elevated expression levels of GANAB were significantly correlated with high grade tumors (p-values of 1.72 × 10⁻¹⁰), advanced stages (6.47 × 10⁻⁶), and elevated in luminal molecular subtypes. Moreover, knocking-down GANAB using RNAi in UM-UC-3 and T24 cells inhibited cell proliferation and migration in vitro. Knockdown of GANAB resulted in cell cycle arrest at G1 phase. We demonstrated that GANAB mediated HIF1A and ATF6 transcriptional activation in the ER stress signaling, and regulated the gene expression of cell cycle-related transcriptional factors E2F7 and FOXM1.

Conclusions: The elevated expression of GANAB is a novel indicator of poorer prognosis of UC. Our data suggests that GANAB is not only a new and promising prognostic biomarker for UC, but also may provide important cues for the development of PTM-based therapeutics for UC treatment.

Keywords: GANAB; Glucosidase; Glycosylation; Post-translational modifications (PTMs); Stress granules (SGs); Urothelial Carcinoma (UC).


Conflict of interest statement

The authors declare no competing financial interests.

Figures

Fig. 1
Fig. 1
Elevated GANAB expression was significantly correlated with poor prognosis of UCs. A, Representative images to indicate the categorical IHC staining intensities. Score 0: Negative; Score 1: Weak staining; Score 2: Medium staining; Score 3: Strong staining. Scale bar: 100um; magnification at 200 × (top). Scale bar: 25μm; magnification at 800 × (bottom). B, The higher expression levels of GANAB was significantly correlated with poorer outcome of UCs in our cohort. Note, the patients with score 0 were grouped into the negative expression group; the patients with score 1–3 were grouped into the positive expression group. C-D, The high H-score group was significantly associated with the poorer survival of UCs in our cohort. The median cut-off value (C) and the optimal cut-off value (D) were used, respectively. E, Multivariate analysis of the Glycoprotein geneset using the Cox regression model based on filtered variables. F, Survival curves between high risk and low risk groups of the UC patients based on the risk scores in the Glycoprotein-based mRNA model. Log-rank test was used for the significant test. G, Survival curves between the high-expression and low-expression groups, stratified by the gene expression levels of GANAB in the TCGA-BLCA cohort. The optimal cut-off value of GANAB mRNA expression was used
Fig. 2
Fig. 2
High histological grade and MIBC were correlated with elevated GANAB expression levels in UCs. A-B, The UCs of low-grade showed lower expression levels of GANAB, as compared with the UCs of high-grade. C-D, MIBC showed higher expression levels of GANAB as compared with NMIBC. IHC Scale bar: 25μm; IHC magnification at 800 × . HE Scale bar: 500μm; HE magnification at 50 × . IHC assay IDs were indicated in yellow. NMIBC = Non-muscle invasive bladder cancer; MIBC = Muscle-invasive bladder cancer. *p < 0.05; ****p < 0.0001
Fig. 3
Fig. 3
Tumor cells in UCs showed strong expression levels of GANAB in the invasive fronts. Left panel, the overview of invasive fronts at 100 × ; The expression of GANAB in the center of the tumor at 800 × (Middle); The elevated expression of GANAB in the invasive fronts at 800 × (Right panel). Scale bar: 250μm (Left panel). Scale bar: 25μm (Middle and Right panel). Arrows indicate the invasive fronts
Fig. 4
Fig. 4
GANAB promoted the proliferation in UC cells. A-B, GANAB was markedly down-regulated or up-regulated after siGANABs or pcDNA3.1( +)-GANAB transfection. C-D, SiRNA knockdown of GANAB in T24 and UM-UC-3 cells significantly inhibited cell proliferation in CCK8 assay. E–F, Overexpression of GANAB in T24 and UM-UC-3 cells markedly increased cell proliferation in CCK8 assay. G-H, Colony-formation assays demonstrated that knockdown of GANAB dramatically inhibited the size and the number of colonies of T24 and UM-UC-3 cells. I- J, The overexpression of GANAB increased the size and the number of colonies of T24 and UM-UC-3 cells. *p < 0.05; ***p < 0.001
Fig. 5
Fig. 5
GANAB promoted the migration and invasion in UC cells. A-B, Silencing of GANAB reduced T24 and UM-UC-3 cells migration in Transwell assay. C-D, The overexpression of GANAB increased T24 and UM-UC-3 cells migration in Transwell assay. E–F, Silencing of GANAB reduced T24 and UM-UC-3 cells invasion in Transwell assay. G-H, The  overexpression of GANAB increased T24 and UM-UC-3 cells invasion in Transwell assay. *p < 0.05; ***p < 0.001
Fig. 6
Fig. 6
Knockdown of GANAB induced cell cycle arrest at the G1 phase in T24 and UM-UC-3 cells. A-B, T24 Cells of G1 phase were increased in the siGANABs group compared to the siCtrl group. C-D, UM-UC-3 Cells of G1 phase were increased in the siGANABs group compared to the siCtrl group. ***< 0.001
Fig. 7
Fig. 7
Bioinformatics analysis of the expression regulatory factors of GANAB. A-B, GANAB expression was up-regulated by the copy number amplifications of the gene loci of the UC genomes. C-D, The expression of the GANAB was positively correlated with the gene signature-derived Hypoxia scores in TCGA-BLCA data (CBioportal). E–F, The expression levels of the GANAB was positively correlated with Stress Granule (SG) factors (G3BP1 and GEMIN5). The color scheme used in C-F was the same as B. ‘-’, not profiled, or no mutation detected in the genomic data
Fig. 8
Fig. 8
Knockdown of GANAB induced ER stress and dys-regulation of cell cycle genes in vitro. A, The expression of GANAB was up-regulated in T24 and UM-UC-3 cells with tunicamycin (Tm) stimulation. B, The expression of HIF1A in both siGANAB and Tm treatment was higher than that in cells with Tm treatment alone. C, The expression of ATF6 in both siGANAB and Tm treatment was higher than that in cells with Tm treatment alone. D, The expression of E2F7 was up-regulated in cells with siGANAB or Tm treatment. E, The expression of FOXM1 was down-regulated in siGANAB or Tm treatment. *p < 0.05, **p < 0.01, ***p < 0.001
Fig. 9
Fig. 9
Enrichment analysis of GANAB correlated genes in bladder cancer microarray datasets. A, Co-expression heatmap of GANAB correlated genes in SEEK analysis. B, SEEK data analysis of tumor microarray data showed significant enrichment of ER stress and glycoprotein metabolic process correlated with GANAB gene expression. C, The enrichment plots for the specific pathway/networks. D, Network visualization of GANAB-related genes (STRING network) in Cytoscape. The Protein folding (GO:0006457) genes were bordered in red in the circle chart, and the N-glycan processing (GO: 0006491) genes were bordered in blue. E, The enrichment analysis of the GANAB network showed significant enrichments in the protein folding, glycoprotein metabolic process and ER stress signaling pathways

Similar articles

Cited by

References

    1. Babjuk M, Böhle A, Burger M, Capoun O, Cohen D, Compérat EM, et al. EAU Guidelines on Non-Muscle-invasive Urothelial Carcinoma of the Bladder: Update 2016. Eur Urol. 2017;71(3):447–461. doi: 10.1016/j.eururo.2016.05.041. - DOI - PubMed
    1. Sanli O, Dobruch J, Knowles MA, Burger M, Alemozaffar M, Nielsen ME, et al. Bladder cancer. Nat Rev Dis Primers. 2017;3:17022. doi: 10.1038/nrdp.2017.22. - DOI - PubMed
    1. Kamat AM, Hahn NM, Efstathiou JA, Lerner SP, Malmström P-U, Choi W, et al. Bladder cancer. Lancet. 2016;388(10061):2796–2810. doi: 10.1016/S0140-6736(16)30512-8. - DOI - PubMed
    1. Mereiter S, Balmana M, Campos D, Gomes J, Reis CA. Glycosylation in the Era of Cancer-Targeted Therapy: Where Are We Heading? Cancer Cell. 2019;36(1):6–16. doi: 10.1016/j.ccell.2019.06.006. - DOI - PubMed
    1. Chandler KB, Costello CE, Rahimi N. Glycosylation in the Tumor Microenvironment: Implications for Tumor Angiogenesis and Metastasis. Cells. 2019;8(6):544. doi: 10.3390/cells8060544. - DOI - PMC - PubMed