. 2022 Jul 26;14(1):78.
doi: 10.1186/s13073-022-01081-3.

Single-cell multimodal analysis identifies common regulatory programs in synovial fibroblasts of rheumatoid arthritis patients and modeled TNF-driven arthritis

Affiliations

Single-cell multimodal analysis identifies common regulatory programs in synovial fibroblasts of rheumatoid arthritis patients and modeled TNF-driven arthritis

Marietta Armaka et al. Genome Med. .

Abstract

Background: Synovial fibroblasts (SFs) are specialized cells of the synovium that provide nutrients and lubricants for the proper function of diarthrodial joints. Recent evidence appreciates the contribution of SF heterogeneity in arthritic pathologies. However, the normal SF profiles and the molecular networks that govern the transition from homeostatic to arthritic SF heterogeneity remain poorly defined.

Methods: We applied a combined analysis of single-cell (sc) transcriptomes and epigenomes (scRNA-seq and scATAC-seq) to SFs derived from naïve and hTNFtg mice (mice that overexpress human TNF, a murine model for rheumatoid arthritis), by employing the Seurat and ArchR packages. To identify the cellular differentiation lineages, we conducted velocity and trajectory analysis by combining state-of-the-art algorithms including scVelo, Slingshot, and PAGA. We integrated the transcriptomic and epigenomic data to infer gene regulatory networks using ArchR and custom-implemented algorithms. We performed a canonical correlation analysis-based integration of murine data with publicly available datasets from SFs of rheumatoid arthritis patients and sought to identify conserved gene regulatory networks by utilizing the SCENIC algorithm in the human arthritic scRNA-seq atlas.

Results: By comparing SFs from healthy and hTNFtg mice, we revealed seven homeostatic and two disease-specific subsets of SFs. In healthy synovium, SFs function towards chondro- and osteogenesis, tissue repair, and immune surveillance. The development of arthritis leads to shrinkage of homeostatic SFs and favors the emergence of SF profiles marked by Dkk3 and Lrrc15 expression, functioning towards enhanced inflammatory responses and matrix catabolic processes. Lineage inference analysis indicated that specific Thy1+ SFs at the root of trajectories lead to the intermediate Thy1+/Dkk3+/Lrrc15+ SF states and culminate in a destructive and inflammatory Thy1- SF identity. We further uncovered epigenetically primed gene programs driving the expansion of these arthritic SFs, regulated by NFkB and new candidates, such as Runx1. Cross-species analysis of human/mouse arthritic SF data determined conserved regulatory and transcriptional networks.

Conclusions: We revealed a dynamic SF landscape from health to arthritis providing a functional genomic blueprint to understand the joint pathophysiology and highlight the fibroblast-oriented therapeutic targets for combating chronic inflammatory and destructive arthritic disease.


Conflict of interest statement

The authors declare that they have no competing interests.

Figures

Fig. 1
Fig. 1
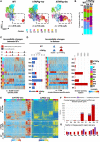
Multiomic transcriptional and epigenetic single-cell analysis of SFs. A Schematic representation of the experimental workflow. We collected ankle synovial tissue from wt and hTNFtg mice, enzymatically disaggregated the tissue, and sorted the cells into one gate representing fibroblasts (CD45−, Ter119−, CD31−, Pdpn+). We profiled the cells with both sc 3′ RNA-seq and ATAC-seq using 10X technology and performed scRNA-seq, scATAC-seq, and cross-species integrative analyses with publicly available human RA datasets. B High-quality filtered synovial fibroblasts (n = 5903 for the scRNA-seq and n = 6046 for the sc-ATAC-seq) projected in UMAP space and colored by cluster assignment. C Feature plots on the UMAP embeddings of the SFs shown in B, displaying normalized expression values (for scRNA-seq) and gene activity scores (for scATAC-seq) for Prg4 and Thy1 genes. D Similar to B, but cells are colored by the sample of origin. E scRNA-seq heatmap showing the average scaled expression values for the upregulated genes of each subpopulation (upper panel) and scATAC-seq heatmap of differentially upregulated accessible peaks (lower panel). F Pearson correlation of scaled expression values (RNA) and activity scores (ATAC), followed by hierarchical clustering, for the most variable genes identified in the scRNA-seq analysis
Fig. 2
Fig. 2
Structural remodeling of the synovial mesenchyme in the hTNFtg arthritic joint. A UMAP representation of SFs across the three different samples (WT, hTNFtg/4 weeks, and hTNFtg/8 weeks as indicated). The cells are colored by cluster identities, and the marked areas highlight the structural dynamic changes of the intermediate and lining subpopulations in RA evolution/during disease progression. B Stacked bar charts showing the relative abundances (%) of clusters across samples (WT, hTNFtg 4 and 8 weeks). C Table summarizing the cluster numbers, simplified names, and marker genes. D Dot plot of the cluster marker genes. The color of the dot shows the intensity of expression while the size denotes the percentage of cells expressing the gene in each cluster and condition (WT: wt-4w; hTNFtg/4: tg-4w; hTNFtg/8: tg-8w). E Functional enrichment analysis indicating the enriched biological processes for each cluster across samples. Significance is noted by color, and the percentage of cluster marker genes included in each term is noted by size
Fig. 3
Fig. 3
Sub-clustering analysis of S4a SFs revealed a homeostatic and an inflammatory state of LSFs. A UMAP representation of the identified lining sub-clusters. Cells belonging to the homeostatic group (hS4a) are colored in blue, while cells belonging to the inflammatory group (iS4a) are colored in red. C Barplot showing the relative abundances of cells in each sub-cluster in healthy conditions and during disease progression. C Feature plots of selected genes showing differential patterns of expression in the two sub-clusters. D Dot plot of shared and specific enriched GO biological processes in the two sub-clusters.
Fig. 4
Fig. 4
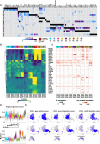
scATAC-seq recapitulates the structural remodeling of the synovial mesenchyme in the hTNFtg arthritic joint. A UMAP representation of SFs across the three different samples (WT, hTNFtg/4 weeks, and hTNFtg/ 8 weeks as indicated). Cells are colored by cluster identities, and the marked areas highlight the structural dynamic changes of the intermediate and lining subpopulations during disease progression. B Stacked bar charts showing relative abundances (%) of clusters across samples (WT, hTNFtg 4 and 8 weeks). C Upper panel: schematic representation of the marker peak detection procedure. Lower panel: heatmap showing the column Z-score of normalized accessibility of 50,636 marker peaks, across SF subpopulations and disease states (WT, hTNFtg). D Upper panel: schematic representation of the disease-specific marker peak definition. Left panel: stacked bar chart depicts the proportions of stable and hTNFtg-specific marker peaks. Center panel: heatmap showing the column Z-score of normalized accessibility of 7,799 disease-specific marker peaks (WT, hTNFtg), across SF subpopulations. Right panel: bar chart depicts the distribution of regions with an increased opening in disease vs WT across clusters. E Heatmap showing the column Z-score of normalized accessibility and integrated gene expression of 52,133 peak-to-gene links across WT and hTNFtg SF subpopulations. Upper panel: peak-to-gene links that are shared between conditions. Middle panel: peak-to-gene links that are unique to hTNFtg cells. Lower panel: peak-to-gene links that are unique to WT cells. F Stacked bar chart depicting the number of disease-specific marker genes (described in E, middle part) exclusively found in scATAC-seq data (red), shared between modalities (purple), and exclusively found in scRNA-seq data (gray). G Bar chart depicting the number of regions per gene with gains in accessibility detected in disease.
Fig. 5
Fig. 5
Integrative analysis of scATAC-seq and scRNA-seq infers putative arthritic regulatory programs. A Heatmap showing the motif enrichment p-adjusted values of each SF subpopulation, for each disease state (WT, hTNFtg as indicated). Motif enrichment analysis was performed within the disease-specific marker peaks depicted in Fig. 4D (right panel). The color signifies the magnitude of the enrichment (−log10 (p-adjusted value), hypergeometric test). B Heatmap showing the motif deviation Z-scores of positive TF regulators across the SF subpopulations and samples (WT: wt-4w; hTNFtg/4weeks: tg-4w; and hTNFtg/8 weeks: tg-8w). TF gene expression is positively correlated with motif TF accessibility (Pearson correlation > 0.5, p-adjusted value < 0.05). C Expression dot plot of positive TF regulators shown in B. The color of the dots shows the intensity of expression, and the size denotes the percentage of cells expressing the gene in each cluster and condition. D Violin plots of regulon gene signature scores across SF subpopulations and samples (wt, hTNFtg/4 & 8 as indicated). Top panel: gene signature of 23 Ar-regulated genes with significantly increased expression and chromatin accessibility in sublining clusters. Peaks are enriched with the Ar motif. Bottom panel: gene signature of 181 Runx1-regulated genes with significantly increased expression and chromatin accessibility in intermediate and lining clusters. Peaks are enriched with the Runx1 motif. E Multimodal feature plots of Ar and Runx1 including scATAC gene activity (ATAC—gene activity scores), scRNA expression embedded to scATAC cells (ATAC—gene integration scores), and scATAC TF motif activity (ATAC—motif deviation scores). *NP1 full name: NP_0322962_LINE6262_NP_0322962_I_N2. *NP2 full name: NP_0322962_LINE1459_NP_0322962_I_N31
Fig. 6
Fig. 6
Inference of SF trajectories in the arthritic joint by RNA velocity analysis. A RNA velocity analysis recapitulating cell transitions and dynamic relations between SF clusters in the hTNFtg samples. Large panel: the UMAP highlights the existence of a pathogenic branch comprising S2d - S4b - S4a. Small panel: RNA velocity analysis in WT and hTNFtg samples. B Overlap of differentially expressed genes with scVelo driver genes, indicates genes potentially related to disease progression. In the first heatmap (left), avgLogFC values for DE genes, as calculated from inter-cluster and intra-cluster comparisons in each sample, are shown. In the second heatmap, binary values signify upregulation (orange) or downregulation (purple) of those genes in the hTNFtg vs WT comparison. In the third heatmap (right), genes are ranked according to the likelihood to drive the underlying cellular process. In the fourth heatmap (center), the scaled expression of the 107 overlapping genes is plotted. Cells are ordered by latent time values, after an S2b cell was set as the root of the trajectory. The gene expression patterns reveal a transcriptional gradient along the latent time axis in the hTNFtg SFs. C scATAC-seq semi-supervised trajectory analysis supports the existence of the aforementioned pathogenic branch. The color indicates the cellular fate across the inferred trajectory. D Heatmap showing the integrated gene expression activity (left panel) and the TF motif deviation (right panel) of positive TF regulators along the pseudotemporal ordered cells in the S2b- S2a - S2d - S4b - S4a branch. TFs gene expression is significantly correlated with TF motif deviation across the cell trajectory. E Binary heatmap of disease-related TFs and genes epigenetically primed for disease activation. Purple denotes that the TF regulates the gene, while white denotes a lack of regulation. The barplot summarizes the percentage of genes regulated by each TF
Fig. 7
Fig. 7
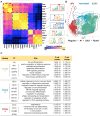
Integrative analysis of SFs from hTNFtg murine model and human RA pathology. A Integration of 24,042 RA patients’ SFs (3 different studies: Zhang et al. (2019), Wei et al. (2020), and Stephenson et al. (2018)) and our 3,051 hTNFtg SFs identified 7 SF clusters. UMAPs for the pooled human (downsampled to 3,051 cells) and mouse datasets, cells are colored by cluster identity. B Correlation heatmap (average expression of most variable genes) between human and mouse SF clusters. C Heatmap illustrating the significance of the selected enriched functional terms and pathways in human and mouse datasets. D Feature plots of selected marker genes commonly expressed between homologous human and mouse clusters of SF subpopulations
Fig. 8
Fig. 8
Shared Gene Regulatory Networks in SFs of hTNFtg mice and human RA. A Regulatory network analysis in mouse and human datasets reveals 17 shared regulons. Correlation and clustering analysis in the hTNFtg propose organization of those shared regulons in 3 main modules. B The activity of regulons AR, RUNX1, and DLX3 is depicted in a UMAP of the human data. C Summary table for the GO enrichment analysis in the target genes of the modules shown in A. For each module, the TFs can be found in the second column. In the third column, commonly enriched GOs for mouse and human regulons in each module are presented followed by their respective p-values

References

    1. Smolen JS, Aletaha D, Barton A, Burmester GR, Emery P, Firestein GS, Kavanaugh A, McInnes IB, Solomon DH, Strand V, Yamamoto K. Rheumatoid arthritis. Nat Rev Dis Primers. 2018;4:18001. doi: 10.1038/nrdp.2018.1. - DOI - PubMed
    1. Firestein GS, McInnes IB. Immunopathogenesis of rheumatoid arthritis. Immunity. 2017;46:183–196. doi: 10.1016/j.immuni.2017.02.006. - DOI - PMC - PubMed
    1. Keffer J, Probert L, Cazlaris H, Georgopoulos S, Kaslaris E, Kioussis D, Kollias G. Transgenic mice expressing human tumour necrosis factor: a predictive genetic model of arthritis. EMBO J. 1991;10:4025–4031. doi: 10.1002/j.1460-2075.1991.tb04978.x. - DOI - PMC - PubMed
    1. Kontoyiannis D, Pasparakis M, Pizarro TT, Cominelli F, Kollias G. Impaired on/off regulation of TNF biosynthesis in mice lacking TNF AU-rich elements: implications for joint and gut-associated immunopathologies. Immunity. 1999;10:387–398. doi: 10.1016/S1074-7613(00)80038-2. - DOI - PubMed
    1. Elliott M, Maini R, Feldmann M, Long-Fox A, Charles P, Katsikis P, et al. Treatment of rheumatoid arthritis with chimeric monoclonal antibodies to tumor necrosis factor alpha. Arthritis Rheum. 1993;36:1681–90. - PubMed

Publication types