. 2022 Jul 25;24(1):175.
doi: 10.1186/s13075-022-02852-4.

Xanthine oxidase inhibitor urate-lowering therapy titration to target decreases serum free fatty acids in gout and suppresses lipolysis by adipocytes

Affiliations

Xanthine oxidase inhibitor urate-lowering therapy titration to target decreases serum free fatty acids in gout and suppresses lipolysis by adipocytes

Monica Guma et al. Arthritis Res Ther. .

Abstract

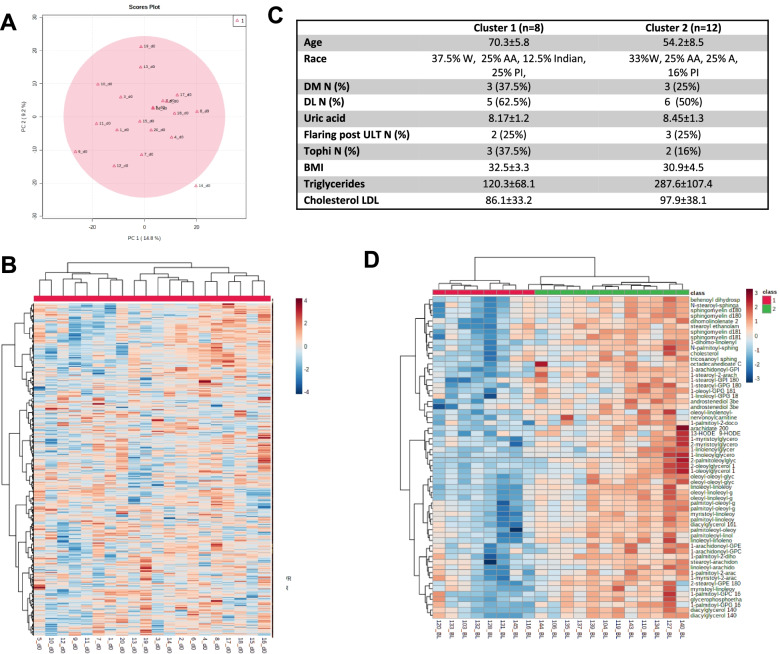
Objective: Linked metabolic and cardiovascular comorbidities are prevalent in hyperuricemia and gout. For mechanistic insight into impact on inflammatory processes and cardiometabolic risk factors of xanthine oxidase inhibitor urate-lowering therapy (ULT) titration to target, we performed a prospective study of gout serum metabolomes from a ULT trial.

Methods: Sera of gout patients meeting the 2015 ACR/EULAR gout classification criteria (n = 20) and with hyperuricemia were studied at time zero and weeks 12 and 24 of febuxostat or allopurinol dose titration ULT. Ultrahigh performance liquid chromatography-tandem mass spectroscopy acquired the serum spectra. Data were assessed using the Metabolon and Metaboloanalyst software. Lipolysis validation assays were done in febuxostat and/or colchicine-treated 3T3-L1 differentiated adipocytes.

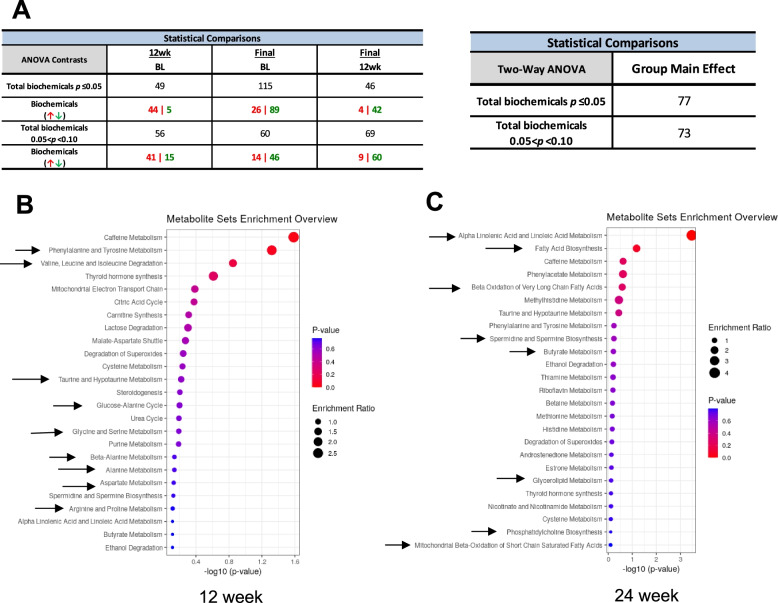
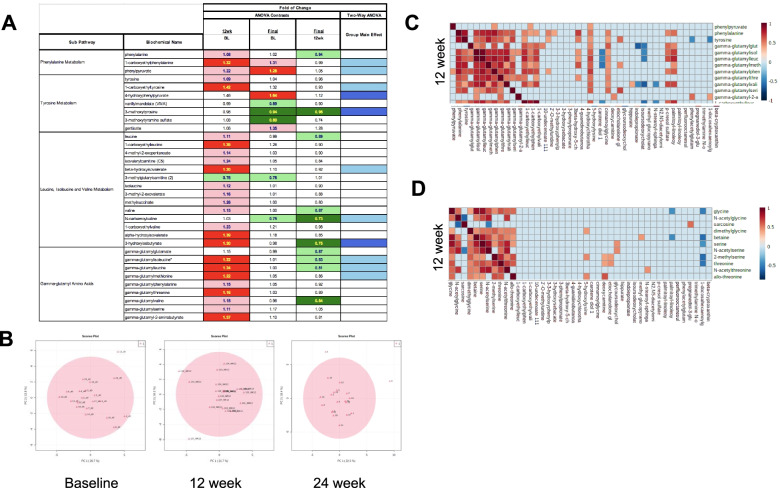
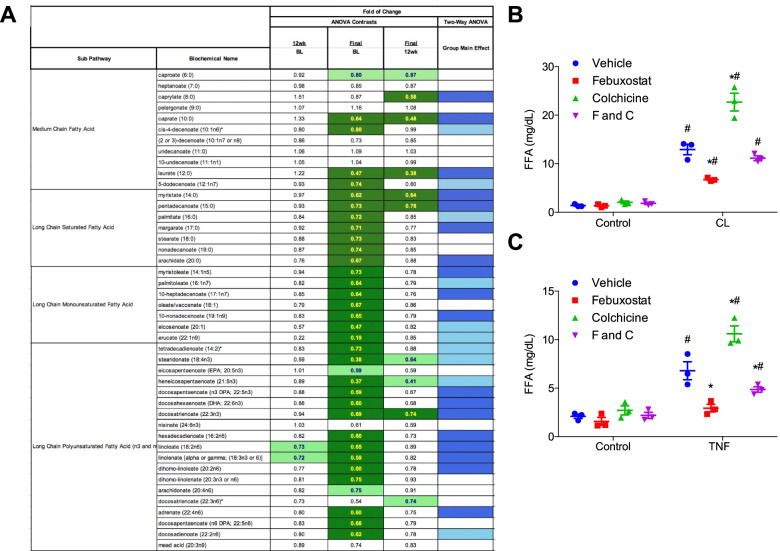
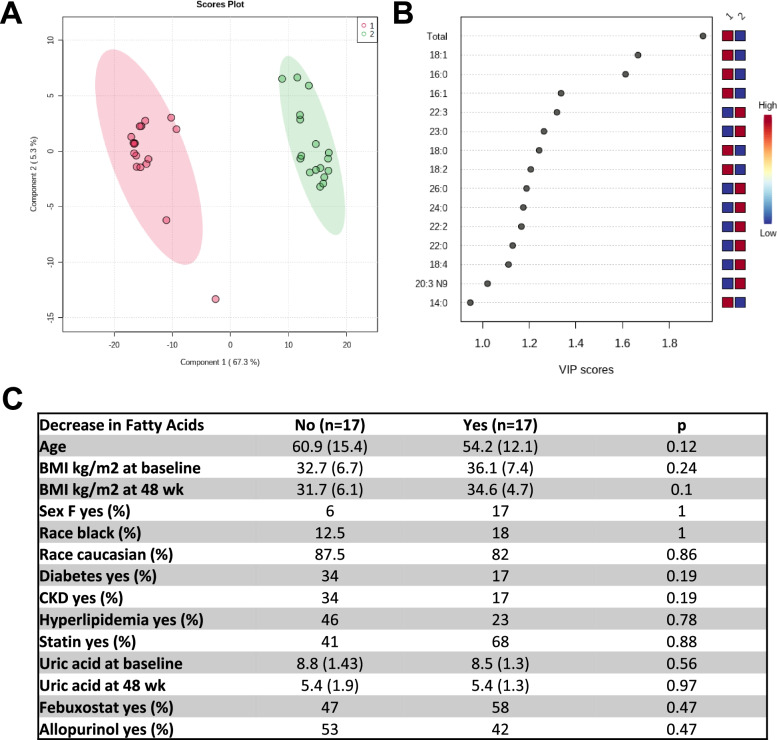
Results: Serum urate decreased from time zero (8.21 ±1.139 SD) at weeks 12 (5.965 ± 1.734 SD) and 24 (5.655 ±1.763 SD). Top metabolites generated by changes in nucleotide and certain amino acid metabolism and polyamine pathways were enriched at 12 and 24 weeks ULT, respectively. Decreases in multiple fatty acid metabolites were observed at 24 weeks, linked with obesity. In cultured adipocytes, febuxostat significantly decreased while colchicine increased the lipolytic response to β-adrenergic-agonism or TNF.

Conclusion: Metabolomic profiles linked xanthine oxidase inhibitor-based ULT titration to target with reduced serum free fatty acids. In vitro validation studies revealed that febuxostat, but not colchicine, reduced lipolysis in cultured adipocytes. Since soluble urate, xanthine oxidase inhibitor treatment, and free fatty acids modulate inflammation, our findings suggest that by suppressing lipolysis, ULT could regulate inflammation in gout and comorbid metabolic and cardiovascular disease.

Keywords: Adipocytes; Gout; Lipolysis; Metabolomics; Microbiome; Xanthine oxidase.


Conflict of interest statement

RT: research grant: Astra-Zeneca; consulting: SOBI, Selecta, Horizon, Allena, Astra-Zeneca

MG: research grant: Pfizer, Novartis

RLB, RC, SMR, BD, HT, DB, KL: none

Figures

Fig. 1
Fig. 1
Metabolomic profiling at time zero. A PCA examining samples at time zero. B Heat map based on Pearson and Ward for determining distance and clustering identified 2 clusters at time zero. C Characteristics of patients in both clusters. Continuous variables were expressed as mean ± standard deviation (SD) and categorical variables as number (N) and percentage. D Top 50 metabolites different between clusters
Fig. 2
Fig. 2
XOI-based ULT effects on serum metabolomic pathway analysis. A Two-way repeated measures ANOVA identified 115 metabolites (89 decreased and 26 increased) significantly differing between baseline and 24 weeks ULT titration to target. A summary of the numbers of metabolites that achieved statistical significance (p ≤ 0.05), as well as those approaching significance (0.05 < p < 0.10), is shown. B, C Pathway analysis was conducted with the 105 metabolites (p < 0.1) significant at 12 weeks ULT (B) and with the 165 metabolites (p < 0.1) at 24 weeks (C). At 12 weeks ULT, pathways were significantly enriched with changes in the AA metabolism (arrows, B). However, at 24 weeks ULT, significant altered pathways were mostly related to FA and polyamine metabolism (arrows, C)
Fig. 3
Fig. 3
XOI-based ULT effects on AA metabolism. A Samples collected specially at 12 and 24 weeks of treatment showed significant alterations in aromatic AA, branched-chain AA, G-glutamyl AA. Green: indicates significant difference (p ≤ 0.05) between the groups shown, metabolite ratio of < 1.00. Light green: narrowly missed statistical cutoff for significance 0.05 < p < 0.10, metabolite ratio of < 1.00. Red: indicates significant difference (p ≤ 0.05) between the groups shown, metabolite ratio of ≥ 1.00. Light red: narrowly missed statistical cutoff for significance 0.05 < p < 0.10, metabolite ratio of ≥ 1.00. Blue: indicates significant (p ≤ 0.05) ANOVA. Light blue: indicates 0.05 < p < 0.10 ANOVA effect. B PCA at different time points using only microbiome-related metabolites. C Correlation between metabolites derived from AA that were significant at 12 weeks of ULT titration to target (Y-axis) and metabolites shown to predict microbiome diversity (X-axis). D Correlation between metabolites derived from AA that were not significant at 12 weeks of ULT titration to target (Y-axis) and metabolites shown to predict microbiome diversity (X-axis). Pearson correlation (r) in C and D with a cutoff value of 0.5. The orange color indicates a positive correlation > 0.5, and the dark blue indicates negative correlation ≤0.5
Fig. 4
Fig. 4
XOI-based ULT effects in lipolysis. A Samples collected at 24 weeks of treatment showed significant alterations in medium chain FAs and long chain FAs. Green: indicates significant difference (p ≤ 0.05) between the groups shown, metabolite ratio of < 1.00. Light green: narrowly missed statistical cutoff for significance 0.05 < p < 0.10, metabolite ratio of < 1.00. Red: indicates significant difference (p ≤ 0.05) between the groups shown, metabolite ratio of ≥1.00. Light red: narrowly missed statistical cutoff for significance 0.05 < p < 0.10, metabolite ratio of ≥ 1.00. Blue: indicates significant (p ≤ 0.05) ANOVA. Light blue: indicates 0.05 < p < 0.10 ANOVA effect. B Free FA release into the media over 30 min following administration of 10 μM CL-316,243 [32] or vehicle control to 3T3-L1 adipocytes pretreated with febuxostat (F, 50 μM) and/or colchicine (C, 10 nM) for 72 h. C TNF treatment at 17 ng/mL was administered for 36 h before the addition of febuxostat (50 μM) and/or colchicine 10 nM. Lipolysis was assessed 72 h later by measuring free FA secreted into the cell culture media over 60 min. Data in B and C presented as mean ± SEM. #p < 0.05, by Holm-Sidak post hoc test after significant 2-way ANOVA for the control versus CL (B) or TNF (C) treated groups, within vehicle, F, C, or F and C treated group. *p < 0.05, by Holm-Sidak post hoc test after significant 2-way ANOVA for the vehicle versus F, C, or F and C treated groups, within CL (B) or TNF (C) treated group
Fig. 5
Fig. 5
XOI-based ULT effects on FA metabolism. A PLS-DA separation between patients with different pattern of FA levels after ULT therapy: 17 patients did not decrease FA [1], and 17 patients significantly decreased FA [2]. B The variables important in projection (VIP) in discriminate both groups, where a VIP score ≥ 1 was considered as important. C Characteristics of patients in both clusters. Continuous variables were expressed as mean ± standard deviation (SD) and categorical variables as number (N) and percentage

Similar articles

Cited by

References

    1. Chen-Xu M, Yokose C, Rai SK, Pillinger MH, Choi HK. Contemporary prevalence of gout and hyperuricemia in the United States and decadal trends: the National Health and Nutrition Examination Survey, 2007-2016. Arthritis Rheumatol. 2019;71(6):991–999. doi: 10.1002/art.40807. - DOI - PMC - PubMed
    1. Zhu Y, Pandya BJ, Choi HK. Comorbidities of gout and hyperuricemia in the US general population: NHANES 2007-2008. Am J Med. 2012;125(7):679–687. doi: 10.1016/j.amjmed.2011.09.033. - DOI - PubMed
    1. Sato Y, Feig DI, Stack AG, Kang DH, Lanaspa MA, Ejaz AA, et al. The case for uric acid-lowering treatment in patients with hyperuricaemia and CKD. Nat Rev Nephrol. 2019;15(12):767–775. doi: 10.1038/s41581-019-0174-z. - DOI - PubMed
    1. Johnson RJ, Bakris GL, Borghi C, Chonchol MB, Feldman D, Lanaspa MA, et al. Hyperuricemia, acute and chronic kidney disease, hypertension, and cardiovascular disease: report of a scientific workshop organized by the National Kidney Foundation. Am J Kidney Dis. 2018;71(6):851–865. doi: 10.1053/j.ajkd.2017.12.009. - DOI - PMC - PubMed
    1. Joosten LAB, Crisan TO, Bjornstad P, Johnson RJ. Asymptomatic hyperuricaemia: a silent activator of the innate immune system. Nat Rev Rheumatol. 2020;16(2):75–86. doi: 10.1038/s41584-019-0334-3. - DOI - PMC - PubMed

Publication types