. 2022 Nov;119(11):3096-3116.
doi: 10.1002/bit.28193. Epub 2022 Aug 5.

Expansion and differentiation of ex vivo cultured erythroblasts in scalable stirred bioreactors

Affiliations

Expansion and differentiation of ex vivo cultured erythroblasts in scalable stirred bioreactors

Joan Sebastián Gallego-Murillo et al. Biotechnol Bioeng. 2022 Nov.

Abstract

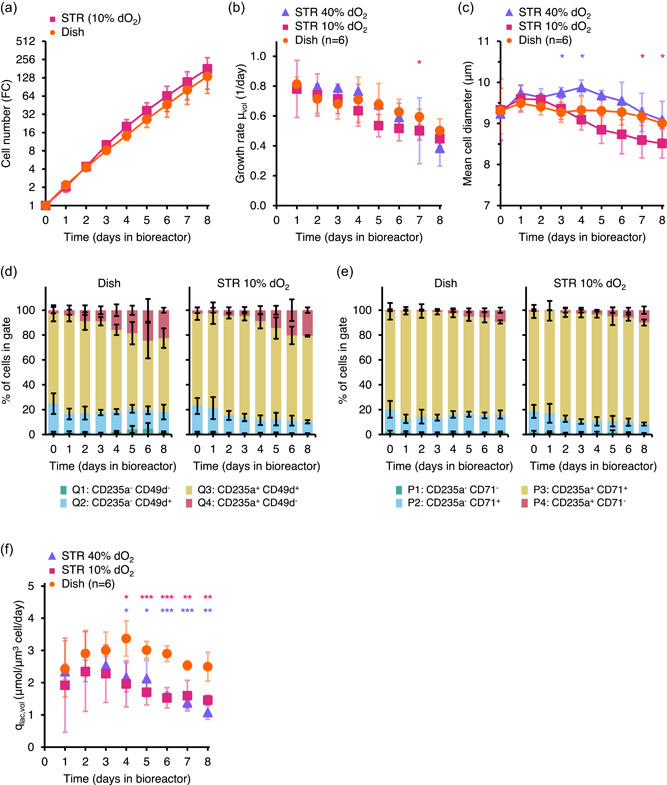
Transfusion of donor-derived red blood cells (RBCs) is the most common form of cell therapy. Production of transfusion-ready cultured RBCs (cRBCs) is a promising replacement for the current, fully donor-dependent therapy. A single transfusion unit, however, contains 2 × 10¹² RBC, which requires large scale production. Here, we report on the scale-up of cRBC production from static cultures of erythroblasts to 3 L stirred tank bioreactors, and identify the effect of operating conditions on the efficiency of the process. Oxygen requirement of proliferating erythroblasts (0.55-2.01 pg/cell/h) required sparging of air to maintain the dissolved oxygen concentration at the tested setpoint (2.88 mg O2 /L). Erythroblasts could be cultured at dissolved oxygen concentrations as low as 0.7 O2 mg/ml without negative impact on proliferation, viability or differentiation dynamics. Stirring speeds of up to 600 rpm supported erythroblast proliferation, while 1800 rpm led to a transient halt in growth and accelerated differentiation followed by a recovery after 5 days of culture. Erythroblasts differentiated in bioreactors, with final enucleation levels and hemoglobin content similar to parallel cultures under static conditions.

Keywords: cell culture; cultured blood; erythropoiesis; red blood cell; scale-up; stirred tank bioreactor.


Conflict of interest statement

The authors declare no conflict of interest.

Figures

Figure 1
Figure 1
Oxygen can be limiting for erythroblast proliferation in stirred tank bioreactors when headspace aeration is used as sole O2 source. (a)–(c) Erythroblasts were expanded from PBMCs for 9 days, and subsequently seeded in culture dishes (orange line) or in a 1.5 L STR (working volume: 1 L; stirring speed: 50 rpm; marine down‐pumping impeller, diameter: 4.5 cm; 37°C), in which oxygen was provided by gas flow (air + 5% CO2) in the headspace (0.3 L/min; purple line, no sparging), or by intermittent sparging triggered at <40% dissolved oxygen (dO2: % of the oxygen saturation concentration at the culture conditions; blue line), while pH (~7.20) was maintained by bicarbonate‐buffered medium in equilibrium with the headspace gas. (a) dO2 concentration in the culture was measured continuously. (b) Erythroblast cell concentration was monitored daily. Cells were diluted with fresh medium if the measured cell concentration was >1.2 × 106 cells/ml. Fold change (FC) in cell number was calculated relative to the number of erythroblasts at the start of culture. (c) Culture viability was determined using a trypan blue dye exclusion method. (a)–(e) show data for a representative reactor run. (d)–(f) To determine the oxygen requirements of proliferating erythroblasts, Day 9 cells were inoculated in 0.5 L STRs (working volume: 300 ml; stirring speed: 200 rpm; marine down‐pumping impeller, diameter: 2.8 cm), with a headspace flow of 100 ml/min (air + 5% CO2) as only source of oxygen for the culture. (d) A constant growth rate was fitted for each time interval between consecutive medium refreshment events. (e) The drop of dO2 after each medium refreshment was used to estimate the cell‐specific oxygen consumption rate (qO2) for each time interval, using the experimentally determined mass transfer coefficient (kLa) of 0.82 1/h (see Supporting Information: Methods). (f) The average cell‐specific oxygen consumption rate, qO2, during erythroblast expansion was calculated as the mean of at five independent bioreactor runs (time intervals for which the qO2 was calculated for each run available in Supporting Information: Figure S1). PBMC, peripheral blood mononuclear cell; STR, stirred tank reactor.
Figure 2
Figure 2
Efficient expansion of erythroblasts can be achieved in stirred tank bioreactors. Erythroblasts were expanded from PBMCs for 9 days, and subsequently seeded in culture dishes (orange lines) or STRs (blue lines) at a starting cell concentration of 0.7 × 106 cells/ml. STRs were run with a constant N2 headspace flow to fully control dO2 and pH. (a) Cells were cultured using a sequential batch feeding strategy: medium was refreshed when the cell concentration (measured daily) was >1.2 × 106 cells/ml. (b) Cell concentration during 10 days of expansion (fold change [FC] compared to start of the culture). (c)–(e) Cells were stained with propidium iodide (PI; the percentage of PI cells indicate the % of viable cells) (c), and with CD235a plus CD71 (d), or CD235a plus CD49d (e) (gating strategy available in Supporting Information: Figure S3). (f) Mean cell diameter (of cells >5 µm) was measured daily. (g) Cytospin cell morphology by May–Grünwald–Giemsa (Pappenheim) staining of cultures after 10 days of expansion. All data are displayed as mean ± SD (error bars; n = 3 reactor runs/donors). Significance is shown for the comparison with dish cultures (unpaired two‐tailed two‐sample equal‐variance Student's t‐test; *p < 0.05, not displayed if difference is not significant). dO2, dissolved oxygen; PBMC, peripheral blood mononuclear cell; STR, stirred tank reactor.
Figure 3
Figure 3
Low dissolved oxygen (dO2) concentration support erythroblast expansion. Erythroblasts were expanded from PBMCs for 9 days, and subsequently seeded in culture dishes (orange line) or STRs (100 ml/min N2 headspace flow) at a starting cell concentration of 0.7 × 106 cells/ml. dO2 was controlled by air sparging when below the targeted setpoint (10% [purple line] or 40% [blue line], equivalent to 0.72 and 2.88 mg O2/L, respectively), and by stripping of excess oxygen using 100 ml/min N2 headspace flow. (a) Cell concentration monitored for 8 days of culture, with medium refreshment when the measured cell concentration (daily) was >1.2 × 106 cells/ml. Fold change (FC) in cell number was calculated using the number of erythroblasts at the start of culture. (b) Growth rate was calculated for each day using the total biomass concentration (μm3 of total cell volume per ml of culture) assuming exponential growth between consecutive media refreshment events. (c) Mean cell diameter was measured daily. (d) and (e) Cells were stained with CD235a plus CD71 (d), or CD235a plus CD49d (e). (f) Cell‐specific lactate production rate (qlac,vol) calculated using growth rate data and measured extracellular lactate concentrations (see Supporting Information: Methods). All data are displayed as mean ± SD (error bars; n = 3 reactor runs/donors, unless indicated otherwise). Significance is shown for the comparison with dish cultures (unpaired two‐tailed two‐sample equal‐variance Student's t‐test; *p < 0.05, **p < 0.01, ***p < 0.001, not displayed if difference is not significant). Growth rates and qlac calculated using cell counts available in Supporting Information: Figure S4. PBMC, peripheral blood mononuclear cell; STR, stirred tank reactor.
Figure 4
Figure 4
High stirring speeds can sustain erythroblast expansion. Erythroblasts were expanded from PBMCs for 9 days, and subsequently seeded in culture dishes (orange line) or STRs (dO2: 40% controlled by sparging of air; 100 ml/min N2 headspace flow) at a starting cell concentration of 0.7 × 106 cells/ml, under agitation at 200 (blue line), 600 (purple line), or 1800 rpm (yellow line). (a) Cells were maintained between 0.7 and 1.5 × 106 cells/ml by dilution with fresh medium. Cumulative cell numbers were calculated and represented as fold change (FC) compared to the start of the experiment. (b) Growth rate for each day was calculated assuming exponential growth between consecutive media refreshment events. (c) Cells were stained with CD235a plus CD49d to evaluate the progression of spontaneous differentiation during culture. All data are displayed as mean ± SD (error bars; n = 3 reactor runs/donors, unless indicated otherwise). Significance is shown for the comparison with dish cultures (unpaired two‐tailed two‐sample equal‐variance Student's t‐test; **p < 0.01, ***p < 0.001, not displayed if difference is not significant). PBMC, peripheral blood mononuclear cell. dO2, dissolved oxygen; PBMC, peripheral blood mononuclear cell; STR, stirred tank reactor.
Figure 5
Figure 5
Erythroblast differentiation can be achieved in stirred tank bioreactors. Erythroblasts were expanded from PBMCs for 10 days, and subsequently seeded in differentiation medium at a starting cell concentration of 1 × 106 cells/ml. (a) Cells were transferred to culture dishes or STRs and kept in culture for 11 subsequent days without medium refreshment. (b) Cell concentration during 11 days of differentiation in STRs (blue symbols) and dishes (orange symbols). (c) Mean cell diameter was measured daily. (d) and (e) Cells were stained with CD235a plus CD49d (d), or CD235a plus CD71 (e), and percentages in each quadrant are shown. (f) Enucleation percentage of erythroid cells was calculated from the forward scatter and DRAQ5 staining. DRAQ5 cell numbers (reticulocytes, R) were divided by the sum of small DRAQ5+ events (nuclei, N + reticulocytes, R). (g) Hemoglobin was measured in arbitrary units (a.u.) and the intracellular hemoglobin concentration was calculated using the total cell volume. (h) Representative cytospin cell morphology by May–Grünwald–Giemsa (Pappenheim) staining of bioreactor cultures during differentiation. All data are displayed as mean ± SD (error bars; n = 3 reactor runs/donors). Significance is shown for the comparison with dish cultures (unpaired two‐tailed two‐sample equal‐variance Student's t‐test; *p < 0.05, ***p < 0.001, not displayed if difference is not significant). PBMC, peripheral blood mononuclear cell; STR, stirred tank reactor.
Figure 6
Figure 6
Scale‐up of erythroblast expansion to 3 L stirred tank bioreactors. Erythroblasts were expanded from PBMCs for 8 days, and subsequently seeded in culture dishes or 0.5 L stirred tank bioreactors (starting volume: 100–200 ml) at a starting cell concentration of 0.7 × 106 cells/ml. (a) Cells were kept in culture following a fed batch feeding strategy in which medium was refreshed if the measured cell concentration (daily) was >1.2 × 106 cells/ml. Upon reaching a total number of >400 million cells, the culture was transferred to a 3.0 L bioreactor (starting volume: 800 ml; 115 rpm with marine down‐pumping impeller, diameter: 5.0 cm), which was progressively filled by daily medium additions. (b) Culture volume in the bioreactor for an exemplary run. Transition from the 0.5 L to the 3 L reactor was performed at Day 3 of culture (red arrow). Upon filling of the 3 L reactor (blue arrow), excess cells were harvested daily to keep a working volume of 2.5–2.7 L. (c) Erythroblast cell concentration was monitored for 9 days of culture. Fold change (FC) in cell number was calculated relative to erythroblast numbers at the start of culture. The same preculture was seeded in parallel in the STR and in a dish. (d) and (e) Cells were stained with AnnexinV (apoptosis staining) and DRAQ7 (cell impermeable DNA stain) (d), or CD235a plus CD49d (erythroid differentiation markers). Percentage of cells in each quadrant is included. (e) All data are displayed as mean ± SD (error bars; n = 3 reactor runs/donors). PBMC, peripheral blood mononuclear cell; STR, stirred tank reactor.

Similar articles

Cited by

References

    1. Aglialoro, F. , Abay, A. , Yagci, N. , Rab, M. A. E. , Kaestner, L. , van Wijk, R. , von Lindern, M. , & van den Akker, E. (2021). Mechanical stress induces Ca2+‐dependent signal transduction in erythroblasts and modulates erythropoiesis. International Journal of Molecular Sciences, 22(2), 935. 10.3390/ijms22020955 - DOI - PMC - PubMed
    1. Aglialoro, F. , Hofsink, N. , Hofman, M. , Brandhorst, N. , & van den Akker, E. (2020). Inside out integrin activation mediated by PIEZO1 signaling in erythroblasts. Frontiers in Physiology, 11, 958. 10.3389/fphys.2020.00958 - DOI - PMC - PubMed
    1. Al‐Ani, A. , Toms, D. , Kondro, D. , Thundathil, J. , Yu, Y. , & Ungrin, M. (2018). Oxygenation in cell culture: Critical parameters for reproducibility are routinely not reported. PLoS ONE, 13(10), e0204269. 10.1371/journal.pone.0204269 - DOI - PMC - PubMed
    1. Allenby, M. C. , Panoskaltsis, N. , Tahlawi, A. , Dos Santos, S. B. , & Mantalaris, A. (2019). Dynamic human erythropoiesis in a three‐dimensional perfusion bone marrow biomimicry. Biomaterials, 188, 24–37. 10.1016/j.biomaterials.2018.08.020 - DOI - PubMed
    1. Al‐Masry, W. A. (1999). Effects of antifoam and scale‐up on operation of bioreactors. Chemical Engineering and Processing: Process Intensification, 38(3), 197–201. 10.1016/S0255-2701(99)00014-8 - DOI

Publication types

LinkOut - more resources