. 2022 Jul;50(7):3000605221099458.
doi: 10.1177/03000605221099458.

Features of antibody responses after SARS-COV-2 infection in healthcare workers in the first wave of COVID-19 pandemic in Mexico City

Affiliations

Features of antibody responses after SARS-COV-2 infection in healthcare workers in the first wave of COVID-19 pandemic in Mexico City

Maria Del Rocío Thompson-Bonilla et al. J Int Med Res. 2022 Jul.

Abstract

Objective: To investigate the antibody response to SARS-CoV-2 and identify associated factors in frontline and second-line healthcare workers (HCWs) at a large hospital in Mexico City during the first wave of COVID-19 pandemic.

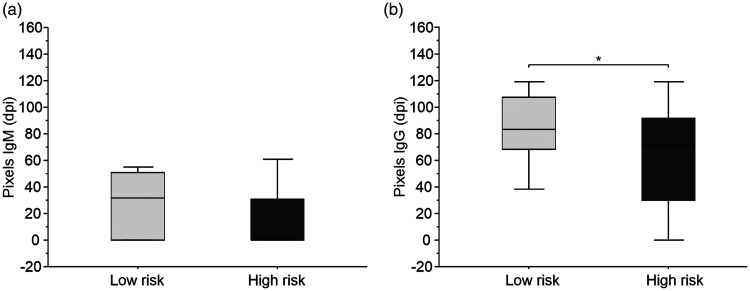
Methods: This was a cross-sectional study of HCWs returning to work following mandatory isolation after recovering from COVID-19. Immunoglobulin (Ig) M and IgG antibodies elicited by SARS-CoV-2 were semiquantitatively measured using densitometric analysis of band intensities in lateral flow assay (LFA) devices. The mean pixel intensity (dots-per-inch [dpi]) of each band on the LFA was considered a measure of antibody titre.

Results: Of the 111 HCWs involved in the study, antibody responses were detected in 73/111 (66%) participants. Severe COVID symptoms was associated with old age. No differences in IgM intensity were observed between men and women, but IgG intensity was significantly higher in men than in women. Second-line HCWs produced a higher IgG intensity than firstline HCWs. The IgG intensity was high in severe cases.

Conclusions: For HCWs who may acquire SARS-CoV-2 infection, it is necessary to establish a routine program for detection of the virus to avoid risk of infection and spread of COVID-19.

Keywords: COVID-19; SARS-CoV-2; healthcare workers; seroprevalence.


Figures

Figure 1.
Figure 1.
Severity of COVID infection versus patient age. Participants with more severe disease tended to be in the older age groups. The mean (standard deviation [SD]) age of the severe group (56.4 [12.4] years) was statistically significantly higher than that for the mild group (41.5 [8.9] years; **P = 0.005) and the asymptomatic group (34.8 [8.6] years; ***P = 0.0005). In addition, the mean age of the moderate group (47.9 [11.4] years) was statistically significantly higher than that for the asymptomatic group (*P = 0.05). Overall, 48 (43%), 37 (33%), 15, (14%) and 11 (10%) health care workers (HCWs), had none, mild, moderate or severe symptoms, respectively.
Figure 2.
Figure 2.
Densitometric measurements of IgM and IgG. Densitometric analysis of the immunochromatography paper for the quantification of band intensity in dots per inch (dpi) of IgM showed no difference between male (n = 67) and female (n = 44) health care workers (HCWs). Mean (SD) pixel intensity of IgM bands for men was 24.7 (29.3) and for women was 20.0 (22.9). However, for IgG, there was a statistically significant difference between men and women. Mean (SD) pixel intensity of IgG bands for men was 88.1 (26.2) and for women was 57.6 (41.39) (***P = 0.0005).
Figure 3.
Figure 3.
Densitometric measurements of IgM and IgG band intensities according to severity of COVID symptoms. (a) Although pixel intensity (dots per inch [dpi]) of IgM bands (i.e., titres) tended to be higher in the severe COVID symptom group compared with all other groups, only the comparison with the mild symptom group was statistically significant (P = 0.005). Mean (SD) band intensities for IgM were, 18.3 (20.0), 16.6 (25.9), 23.7 (23.8) and 41.8 (26.2) for health care workers (HCWs) with none, mild, moderate and severe symptoms, respectively and (b) By comparison, IgG band intensities (i.e., titres) in severe cases were statistically significantly higher than that for asymptomatic (P = 0.0005) and mild (P = 0.05) cases but did not differ from moderate cases. In addition, IgG band intensities for moderate cases were statistically significantly higher than that for asymptomatic cases (P = 0.05). IgG band intensities for mild cases were also statistically significantly higher than asymptomatic cases (P = 0.05). Mean (SD) band intensities for IgG were, 37.1 (26.6), 68.6 (35.0), 79.9 (45.0) and 104.9 (20.0) for HCWs with none, mild, moderate and severe symptoms, respectively.
Figure 4.
Figure 4.
Densitometric measurements of IgM and IgG band intensities according to risk of exposure. (a) Densitometric analysis of band intensities showed that IgM production was similar in high risk (frontline, n = 74) and low risk (second-line, n = 37) healthcare workers (HCWs) and (b) However, band intensities for IgG were statistically significantly higher (P = 0.05) in the low risk group compared with the high risk group.

References

    1. Wu F, Zhao S, Yu B, et al.. A new coronavirus associated with human respiratory disease in China. Nature 2020; 579: 265–269. - PMC - PubMed
    1. European Centre for Disease Prevention and Control. [Internet]. 2019. [cited 2021 Apr 25]. Available from: https://www.ecdc.europa.eu/en/geographical-distribution-2019-ncov-cases
    1. Agren D. Understanding Mexican health worker COVID-19 deaths. Lancet 2020; 396: 807. - PMC - PubMed
    1. Varona JF, Madurga R, Peñalver F, et al.. Seroprevalence of SARS-CoV-2 antibodies in over 6000 healthcare workers in Spain. Int J Epidemiol 2021; 50: 400–409. - PMC - PubMed
    1. Tadj A, Lahbib SSM. Our Overall Current Knowledge of Covid 19: An Overview. Microbes, Infection and Chemotherapy 2021; 1: e1262.