. 2022 Jul 6;2(7):100245.
doi: 10.1016/j.crmeth.2022.100245. eCollection 2022 Jul 18.

Computational framework for single-cell spatiotemporal dynamics of optogenetic membrane recruitment

Affiliations

Computational framework for single-cell spatiotemporal dynamics of optogenetic membrane recruitment

Ivan A Kuznetsov et al. Cell Rep Methods. .

Abstract

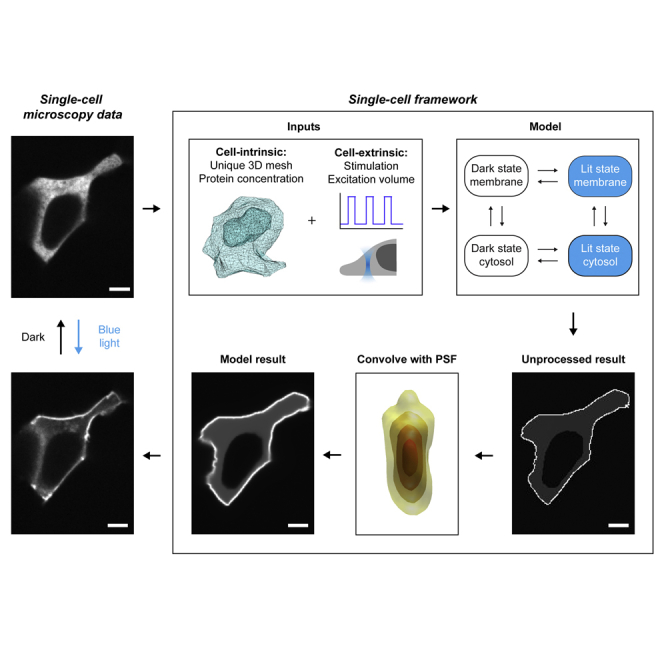
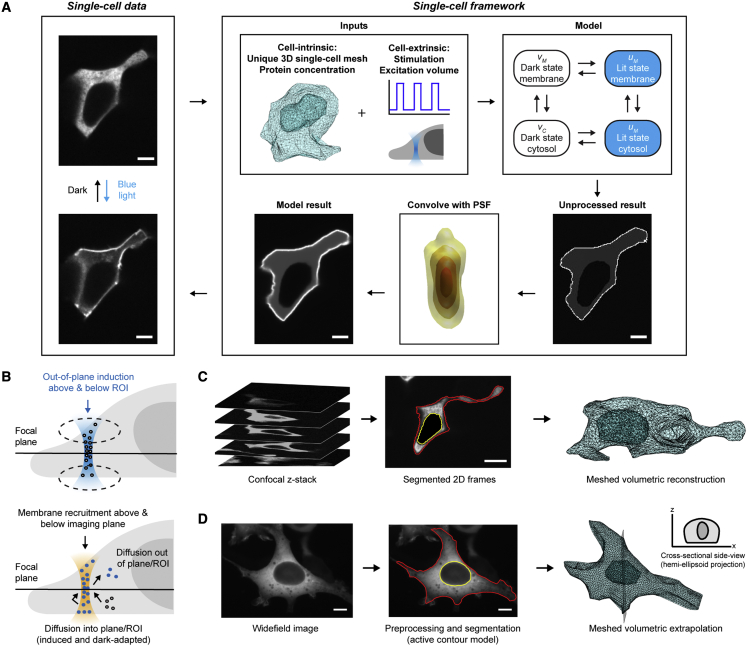
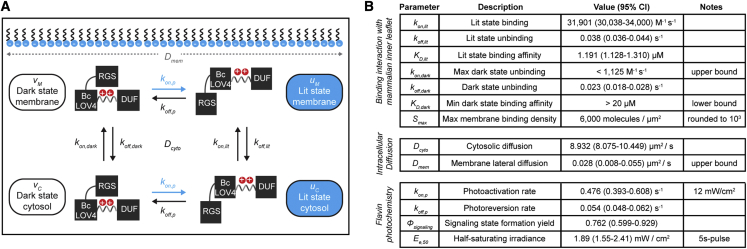
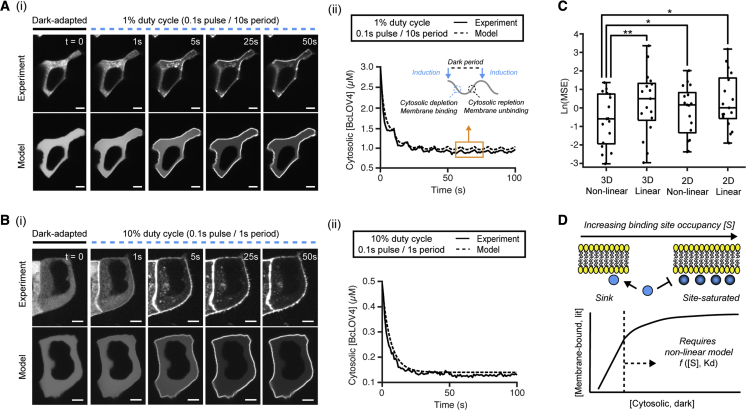
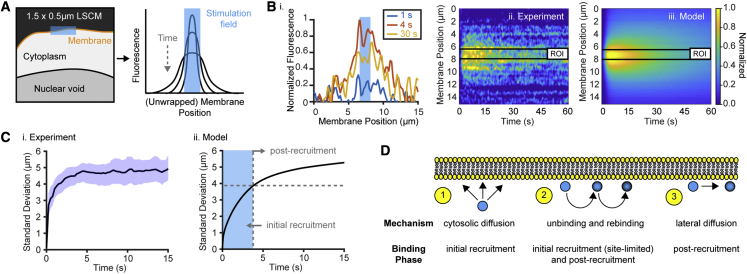
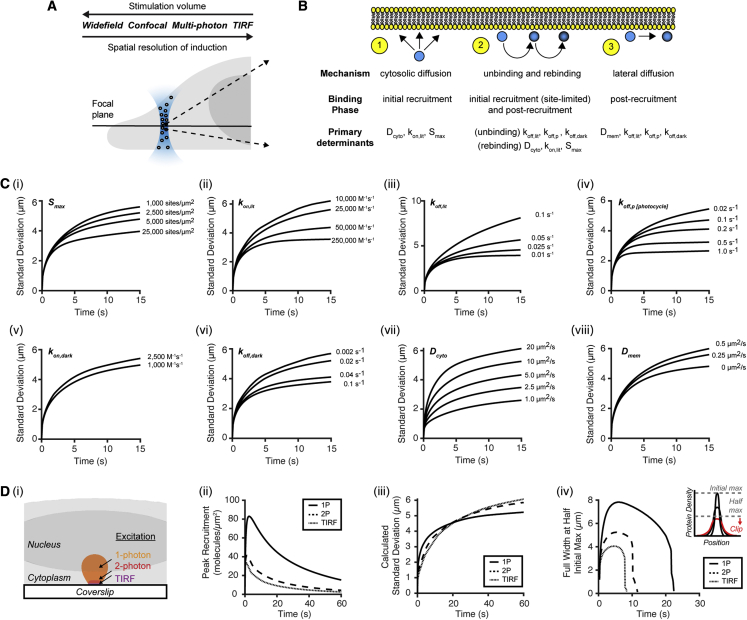
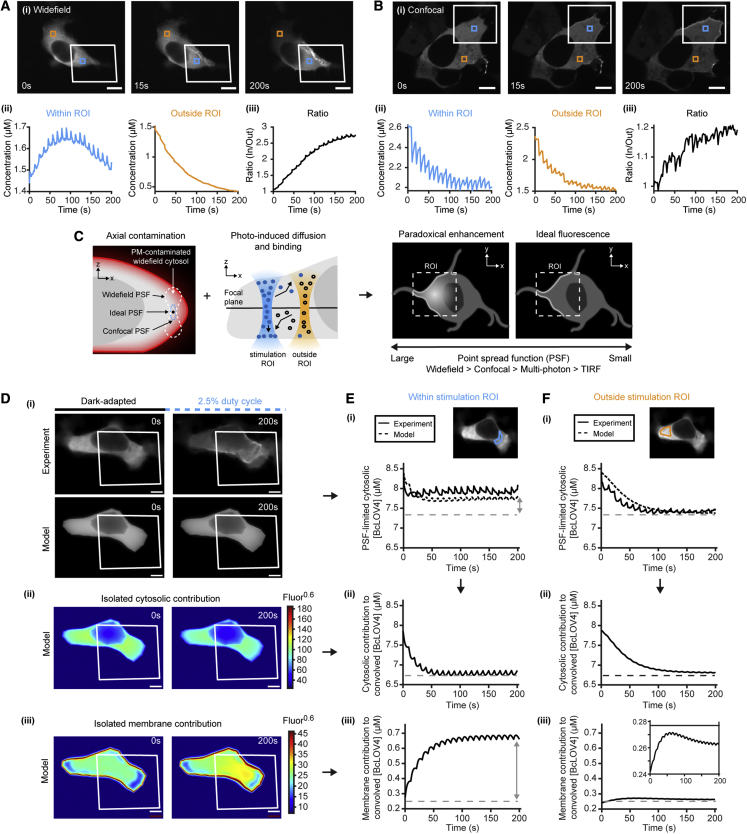
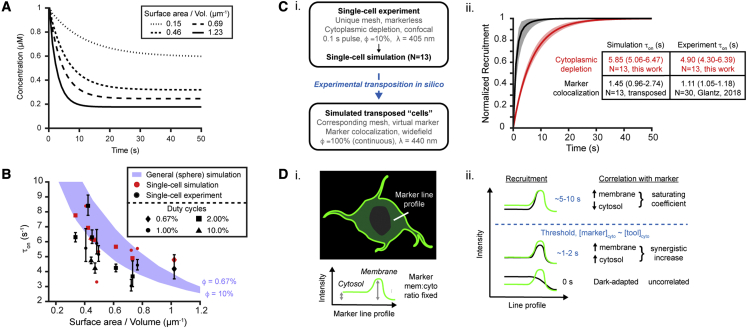
We describe a modular computational framework for analyzing cell-wide spatiotemporal signaling dynamics in single-cell microscopy experiments that accounts for the experiment-specific geometric and diffractive complexities that arise from heterogeneous cell morphologies and optical instrumentation. Inputs are unique cell geometries and protein concentrations derived from confocal stacks and spatiotemporally varying environmental stimuli. After simulating the system with a model of choice, the output is convolved with the microscope point-spread function for direct comparison with the observable image. We experimentally validate this approach in single cells with BcLOV4, an optogenetic membrane recruitment system for versatile control over cell signaling, using a three-dimensional non-linear finite element model with all parameters experimentally derived. The simulations recapitulate observed subcellular and cell-to-cell variability in BcLOV4 signaling, allowing for inter-experimental differences of cellular and instrumentation origins to be elucidated and resolved for improved interpretive robustness. This single-cell approach will enhance optogenetics and spatiotemporally resolved signaling studies.

Keywords: finite element analysis; finite element model; optogenetics; peripheral membrane protein; single cell.


Conflict of interest statement

The authors declare no competing interests.

Figures

None
Graphical abstract
Figure 1
Figure 1
Single-cell data-unique simulation framework BcLOV4 refers to BcLOV4-mCherry. (A) Workflow. BcLOV4-expressing HEK cells were imaged with a confocal (shown) or widefield microscope. Framework data-unique inputs were in two categories: cell-intrinsic (unique to the single cells) and cell-extrinsic (attributable to experimental parameters and hardware). Cells were reconstructed in 3D, meshed using the initial membrane and nucleus contours, and initialized with the cytoplasmic protein concentration. Cell-extrinsic inputs were determined by the experimental stimulation paradigm (i.e., light intensity, spatial patterning, duration, and duty cycle), and microscope excitation volume. The 4-state bulk-surface model predicted the spatiotemporal behavior of that cell. The unprocessed results were convolved with the microscope point-spread function (PSF) so the model result could be directly compared with experimentally observed data. (B) Motivation for volumetric approach to capture geometric and diffractive effects unique to individual cells (e.g., surface area/volume ratio) and experiment conditions (e.g., hardware PSF). Diffraction-limited excitation of a region of interest (ROI) and post-induction imaging are schematized for a laser-scanning confocal microscope. Imaging effects include membrane recruitment above/below the excitation plane, diffusion of activated protein in/out of the imaging plane, and diffusion of dark-adapted protein into the ROI. (C) 3D mesh generation from interpolated confocal z stacks to reconstruct single-cell-unique morphology. (D) 3D mesh generation from widefield images. Hemi-ellipsoid projection was used to extrapolate a volume (i.e., flat bottom to account for cell∷dish contact). Scale bars, 5 μm (A) and 10 μm (B and C).
Figure 2
Figure 2
Experimentally determined biophysical constants BcLOV4 refers to BcLOV4-mCherry, unless stated otherwise. (A) Four-state bulk-surface reaction-diffusion model of BcLOV4 membrane recruitment. (B) Binding constants and rates directly measured in live HEK single cells by cytoplasmic depletion fluorescence microscopy. Diffusion rates were determined by FRAP microscopy (Figures S3 and S4). When needed for feasibility, upper/lower bounds were chosen as conservative values, as noted. Flavin photochemistry was measured by absorbance spectroscopy using FPLC-purified bacterial-expressed recombinant protein without fused mCherry (STAR Methods; λ = 455 nm). The parameter set, along with fluorescence-derived absolute protein concentration (Figure S1) and measured hardware PSF (STAR Methods), is sufficient to fit the global minimum of the proposed single-cell models.
Figure 3
Figure 3
Single-cell finite element models for pulsatile whole-field (unpatterned) stimulation with confocal imaging BcLOV4 refers to BcLOV4-mCherry. Predicted model outputs closely mirror experimental data across duty cycles (φ; 0.1 s blue light pulses, 12.24 W/cm2). Cytosolic depletion and recovery are quantified in lieu of membrane fluorescence that is more susceptible to confounds from diffraction and cell motility (Figure S5). (A) φ = 1%. (i) Experiment and corresponding model prediction. (ii) Cytosolic depletion time course of same cell; inset schematizes the phases of a stimulatory period. Scale bar, 5 μm. (B) φ = 10%. (i) Experiment and model. (ii) Cytosolic depletion time course of same cell, which lacks perceivable membrane unbinding or cytosolic repletion during each 1 s period. Model recapitulates nuclear void and subcellular distribution in the cytosol and plasma membrane but does not account for neighboring cells or for lysosome binding that greatly increases computational time with minimal accuracy benefit (Figure S6). Scale bar, 5 μm. (C) Mean-squared error (MSE) of the described 3D non-linear model (of panels A and B) versus a 3D linear model, 2D non-linear model, and 2D linear model. Pooled dataset contains cells stimulated at φ = 0.67%–10% (N = 17). Linear models performed worse for high protein concentrations (Figures S2D–S2F). Paired Wilcoxon signed rank test: ∗p < 0.05, ∗∗p < 0.01. (D) Schematized non-linear modeling of dynamic membrane recruitment. The system is linear at low membrane binding site occupancy or low cytosolic BcLOV4. High concentrations typical of overexpressed inducible/optogenetic signaling systems require non-linear models due to high fractional occupancy of membrane binding sites upon photoactivation.
Figure 4
Figure 4
Spatial confinement of BcLOV4 BcLOV4 refers to BcLOV4-mCherry. (A) Scheme of laser-scanning confocal microscopy (LSCM) patterning of a narrow peri-membrane excitation ROI (∼1.5 × ∼0.5 μm, blue region, λ = 405 nm). Confinement measurements tracked fluorescence time course along the membrane profile (orange line). (B) Membrane profile fluorescence evolution of a representative cell. (i) Unwrapped profile (blue shaded area denotes excitation region). (ii) Heatmap and (iii) corresponding model prediction of complex spatiotemporal dynamics generally agreed. Black lines denote excitation region. Heatmaps are normalized so that peak fluorescence over the entire time course is set to 1. (C) SD of the Gaussian profile (solid black line ± 95% CI, N = 14) from the heatmaps, a proxy for the degree of spatial confinement. (i) Experiment and (ii) model prediction. The SD initially rapidly increases because of cytosolic diffusion-limited association. BcLOV4 is then largely immobile due to slow lateral diffusion and membrane affinity. (D) Biophysical processes (i.e., excluding hardware contributions) that govern spatial resolution of optically inducible recruitment, pre-/post-binding to the membrane. See Figure 5 for sensitivity analysis.
Figure 5
Figure 5
Determinants of spatiotemporal resolution and signaling magnitude of optically inducible membrane recruitment BcLOV4 refers to BcLOV4-mCherry. (A) Diffractive differences between hardware for induction. Larger stimulation volumes increase cytosolic diffusion lengths and consequently decrease spatial resolution. (B) Spatial confinement post stimulation impacted by: (1) cytosolic diffusion distance before membrane binding; (2) unbinding frequency and distance traveled before rebinding, and (3) distance traveled by lateral diffusion. (C) Sensitivity analysis of spatial confinement to the intrinsic biophysical parameters. Values span those derived here for BcLOV4 and elsewhere for heterodimerization systems. SD of the protein distribution along a modeled membrane matching the experimental conditions of Figure 4. (i) Binding site availability (Smax), (ii) kon,lit, (iii) koff,lit, (iv) koff,p of the chromophore photocycle, (v) kon,dark, (vi) koff, dark, (vii) cytosolic diffusivity, or (viii) lateral diffusivity along the membrane. The role of lateral diffusion is limited for large excitation volumes and/or when binding kinetics permit extensive cytosolic diffusion when rebinding. (D) Effect of stimulation method. Systems with larger excitation volumes drive more potent signaling but reduce spatial precision. (i) Simulated excitation of 2 × 2 μm region at the bottom of a model cell (excitation duration = 100 ms, cytoplasmic [BcLOV4] = 1 μM) by different stimulation methods (10 W/cm2 irradiance at focal plane). Highlighted volumes show the 1 W/cm2 isosurfaces of the excitation volume. (ii) Peak membrane-bound protein recruitment, baselined to subtract pre-bound protein in the dark state. The rapid drop-off in peak recruitment for axially confined stimulation (2P, TIRF) due to low levels of activated cytosolic BcLOV4 results in decreased induced signaling. (iii) Spatial resolution quantified by SD for a Gaussian distribution fit (1P) or the full width at half maximum /2sqrt(2ln(2)) (2P, TIRF) of the membrane profile at each time point. Axially confined methods do not outperform classic 1P excitation for this measure overall, but better retain focality during initial recruitment (t < 5–10 s). (iv) Spatial resolution quantified by width at half of initial/absolute maximum. Inset schematizes the steep drop-off at longer time points by this metric from threshold clipping.
Figure 6
Figure 6
3D FEA-derived resolution of hardware-dependent interpretive confounds BcLOV4 refers to BcLOV4-mCherry. (A) Example of observed paradoxical fluorescence enhancement. Widefield imaging of DMD-excited cells (12 mW/cm2, duty cycle φ = 10%) shows (i) apparent protein depletion from distal unstimulated regions and notable brightening within the stimulation field (white box). Scale bar, 10 μm. (ii) Fluorescence-derived cytosolic concentration traces within stimulation field (cyan quantification box in i), distal unstimulated region (orange box in i), and their (iii) ratio normalized to 1. The fluorescence enhancement in the stimulation field erroneously suggests photoinduced diffusional gradients lead to protein accumulation within the stimulation field. (B) Confocal images of DMD-excited cells do not show the large fluorescence enhancement within the stimulation region. Analyzed as in (A). (C) Model-derived explanation of paradoxical cytosolic fluorescence enhancement within a stimulation field by PSF-dependent axial signal integration of membrane-bound protein. The cytosol darkens quickly outside the field whereas the brightening within it counteracts photobleaching. See (D), (E), and (F) for decomposition. (D) Model of single cell with approximated contours by volumetric extrapolation of one focal plane. (i) Cell and corresponding simulated image in response to patterned illumination (red box, 12 mW/cm2, φ = 2.5%). Geometric uncertainty of the initial mesh precludes pixel-wise accuracy of the output. Gamma corrected (γ = 0.6) to improve discrimination. Scale bar, 5 μm. (ii) Decomposition of the model output. Theoretical isolated contribution of cytoplasmic protein to the model result in (i). (iii) Theoretical isolated contribution of membrane-bound protein to the model result in (i). (E and F) Partial recapitulation of rebinding phenomena observed (E) within and (F) outside the stimulation field. (i) PSF-limited cytosolic depletion time course (photobleach-corrected). Inset: simulated initial image with measurement field overlaid. (ii) Theoretical cytosolic and (iii) membrane fluorescence contributions to the net signal. The ∼0.4 μM equivalent difference between the two cytosolic regions (E-i and F-i) cannot be explained by cytosolic concentration (E-ii and F-ii), but can be by PSF-limited integrated fluorescence of membrane-bound protein (E-iii and F-iii). Dotted lines denote approximate steady-state level outside the stimulation field.
Figure 7
Figure 7
Computational resolution of inter-experimental differences in observed membrane association kinetics (τon) BcLOV4 refers to BcLOV4-mCherry. Kinetics measured in one experiment can be reasonably extrapolated to data generated in another (e.g., different cell or experimental condition). (A) τon varies across a physiological range of cell surface area-to-volume ratios (SA/V) that determine membrane binding site availability relative to total intracellular BcLOV4 (0.1 s pulse, λ = 405 nm, duty cycle φ = 10%, 12.24 W/cm2). SA/V range of ∼0.15–1.2 mm−1 spans geometries from a large 20-μm-radius cell with negligible nuclear fractional volume to a small 5-μm-radius cell with sizable 4-μm-radius nucleus. (B) Log-order acceleration of τon with increasing SA/V as the main contributor to intercellular differences in recruitment kinetics. Experimental cells and corresponding FEM (experiment: black, 95% CI; simulation: red) and calculated τon (blue band, in idealized spherical cells) across SA/V and stimulation duty ratios (as in A, φ = 0.67%–10%). (C) In silico “transposition” of a cell between experiments. (i) Validated cell-unique FEM from a pulsatile stimulation experiment with τon quantified by cytosolic depletion is simulated as if it was in a different experiment of continuous stimulation and quantified by colocalization with a virtually introduced membrane marker. (ii) Simulated transposition of one cell with virtual GFP-CAAX (experiment-derived marker background fluorescence of ∼10% relative to its membrane fluorescence; error = 95% CI; ∼0.5 μM protein to match previous work [Glantz et al., 2018]). Colocalization correlation analysis along a line profile transecting the membrane results in faster perceived recruitment dynamics than by cytoplasmic depletion. Predictions on markerless experimental cells using virtual markers here agree with previous work (inset table). (D) Post hoc analysis reconciles data quantified by the two methods. (i) Schematized GFP-CAAX marker with constant membrane/cytosol ratio. (ii) Tool∷marker correlation initially improves in both the membrane and cytosol to synergistically accelerate perceived colocalization increase. The correlation improvement subsequently slows when membrane colocalization increase is counterbalanced by cytosolic colocalization decrease (when cytosolic BcLOV4 depletes beyond the cytosolic marker level).

Similar articles

References

    1. Ambroggio E., Sorre B., Bassereau P., Goud B., Manneville J.B., Antonny B. ArfGAP1 generates an Arf1 gradient on continuous lipid membranes displaying flat and curved regions. EMBO J. 2010;29:292–303. doi: 10.1038/emboj.2009.341. - DOI - PMC - PubMed
    1. Angert I., Karuka S.R., Hennen J., Chen Y., Albanesi J.P., Mansky L.M., Mueller J.D. Sensitive detection of protein binding to the plasma membrane with dual-color Z-scan fluorescence. Biophys. J. 2020;118:281–293. doi: 10.1016/j.bpj.2019.12.002. - DOI - PMC - PubMed
    1. Baddeley D., Marin Z., Miguel Susano Pinto D. 2021. Python-Microscopy/Python-Microscopy: Release 20.11.25. - DOI
    1. Bartelt S.M., Chervyachkova E., Steinkühler J., Ricken J., Wieneke R., Tampé R., Dimova R., Wegner S.V. Dynamic blue light-switchable protein patterns on giant unilamellar vesicles. Chem. Commun. 2018;54:948–951. doi: 10.1039/c7cc08758f. - DOI - PubMed
    1. Bendezú F.O., Vincenzetti V., Vavylonis D., Wyss R., Vogel H., Martin S.G. Spontaneous Cdc42 polarization independent of GDI-mediated extraction and actin-based trafficking. PLoS Biol. 2015;13:e1002097. doi: 10.1371/journal.pbio.1002097. - DOI - PMC - PubMed

Publication types

LinkOut - more resources