

Escherichia coli transcription factors of unknown function: sequence features and possible evolutionary relationships
- PMID: 35880217
- PMCID: PMC9308461
- DOI: 10.7717/peerj.13772
Escherichia coli transcription factors of unknown function: sequence features and possible evolutionary relationships
Abstract
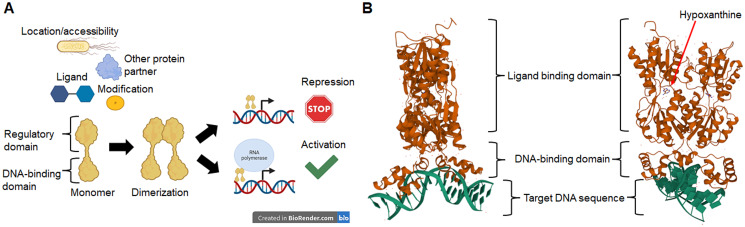
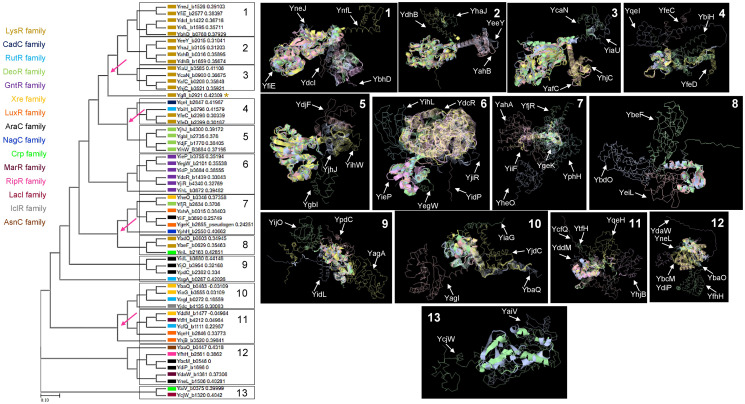
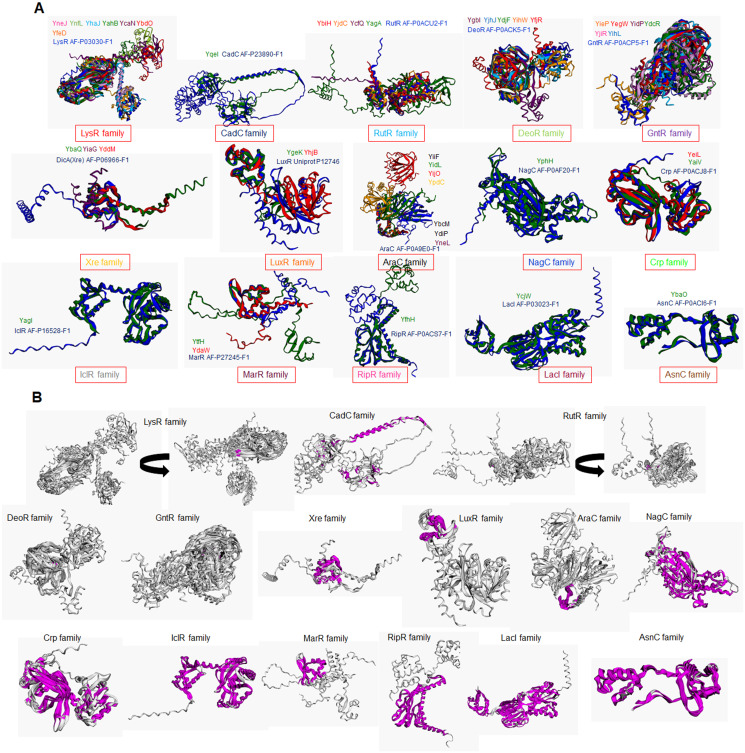
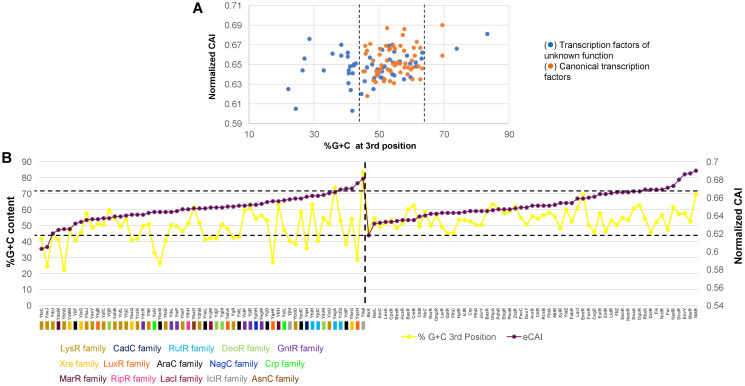
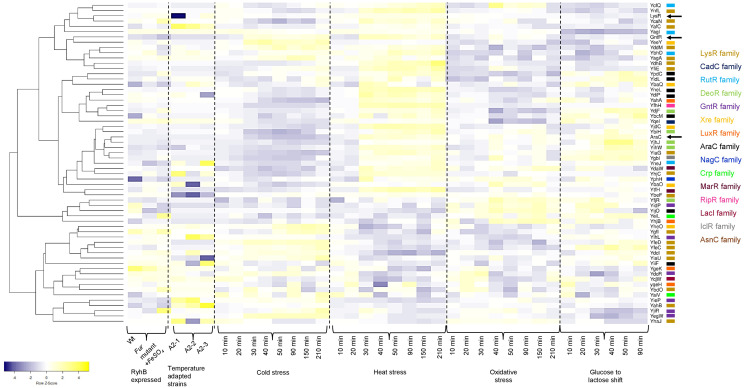
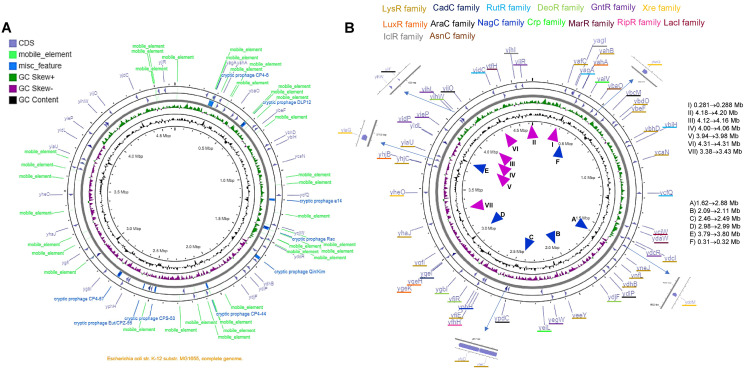
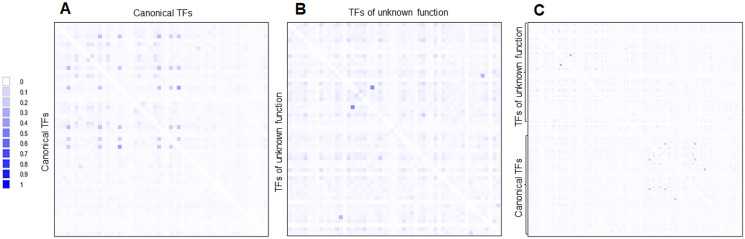
Organisms need mechanisms to perceive the environment and respond accordingly to environmental changes or the presence of hazards. Transcription factors (TFs) are required for cells to respond to the environment by controlling the expression of genes needed. Escherichia coli has been the model bacterium for many decades, and still, there are features embedded in its genome that remain unstudied. To date, 58 TFs remain poorly characterized, although their binding sites have been experimentally determined. This study showed that these TFs have sequence variation at the third codon position G+C content but maintain the same Codon Adaptation Index (CAI) trend as annotated functional transcription factors. Most of these transcription factors are in areas of the genome where abundant repetitive and mobile elements are present. Sequence divergence points to groups with distinctive sequence signatures but maintaining the same type of DNA binding domain. Finally, the analysis of the promoter sequences of the 58 TFs showed A+T rich regions that agree with the features of horizontally transferred genes. The findings reported here pave the way for future research of these TFs that may uncover their role as spare factors in case of lose-of-function mutations in core TFs and trace back their evolutionary history.
Keywords: Escherichia coli; Mobile elements; Sequence codon bias; Structural features; Synteny; Transcription factors of unknown function.
© 2022 Duarte-Velázquez et al.
Conflict of interest statement
Bernardo Franco is an Academic Editor for PeerJ. Héctor Manuel Mora-Montes is an Academic Editor for PeerJ.
Figures
Similar articles
-
The loose evolutionary relationships between transcription factors and other gene products across prokaryotes.BMC Res Notes. 2014 Dec 17;7:928. doi: 10.1186/1756-0500-7-928. BMC Res Notes. 2014. PMID: 25515977 Free PMC article.
-
Widespread Strain-Specific Distinctions in Chromosomal Binding Dynamics of a Highly Conserved Escherichia coli Transcription Factor.mBio. 2020 Jun 23;11(3):e01058-20. doi: 10.1128/mBio.01058-20. mBio. 2020. PMID: 32576674 Free PMC article.
-
H-NS Facilitates Sequence Diversification of Horizontally Transferred DNAs during Their Integration in Host Chromosomes.PLoS Genet. 2016 Jan 20;12(1):e1005796. doi: 10.1371/journal.pgen.1005796. eCollection 2016 Jan. PLoS Genet. 2016. PMID: 26789284 Free PMC article.
-
Determinants of DNA sequence divergence between Escherichia coli and Salmonella typhimurium: codon usage, map position, and concerted evolution.J Mol Evol. 1991 Jul;33(1):23-33. doi: 10.1007/BF02100192. J Mol Evol. 1991. PMID: 1909371 Review.
-
Building a complete image of genome regulation in the model organism Escherichia coli.J Gen Appl Microbiol. 2018 Jan 15;63(6):311-324. doi: 10.2323/jgam.2017.01.002. Epub 2017 Sep 12. J Gen Appl Microbiol. 2018. PMID: 28904250 Review.
Cited by
-
RegulonDB v12.0: a comprehensive resource of transcriptional regulation in E. coli K-12.Nucleic Acids Res. 2024 Jan 5;52(D1):D255-D264. doi: 10.1093/nar/gkad1072. Nucleic Acids Res. 2024. PMID: 37971353 Free PMC article.
-
Mono- and multidomain defense toxins of the RelE/ParE superfamily.mBio. 2025 Apr 9;16(4):e0025825. doi: 10.1128/mbio.00258-25. Epub 2025 Feb 25. mBio. 2025. PMID: 39998207 Free PMC article.
-
Transcriptional Regulation in Bacteria.Microorganisms. 2024 Dec 6;12(12):2514. doi: 10.3390/microorganisms12122514. Microorganisms. 2024. PMID: 39770717 Free PMC article.
-
Proteomics and metabolic burden analysis to understand the impact of recombinant protein production in E. coli.Sci Rep. 2024 May 28;14(1):12271. doi: 10.1038/s41598-024-63148-y. Sci Rep. 2024. PMID: 38806637 Free PMC article.
-
Phylogeny and structural modeling of the transcription factor CsqR (YihW) from Escherichia coli.Sci Rep. 2024 Apr 3;14(1):7852. doi: 10.1038/s41598-024-58492-y. Sci Rep. 2024. PMID: 38570624 Free PMC article.
References
-
- Abdala DA, Ciria R, Merino E. GeConT 3: gene context analysis for orthologous proteins, conserved domains, and metabolic pathways. 2008. http://biocomputo.ibt.unam.mx:8080/GeConT/index.jsp http://biocomputo.ibt.unam.mx:8080/GeConT/index.jsp - PMC - PubMed
Publication types
MeSH terms
Substances
LinkOut - more resources
Full Text Sources
Molecular Biology Databases
