. 2022 Jul 20:10:e13724.
doi: 10.7717/peerj.13724. eCollection 2022.

Baleen whale inhalation variability revealed using animal-borne video tags

Affiliations

Baleen whale inhalation variability revealed using animal-borne video tags

Emily C Nazario et al. PeerJ. .

Abstract

Empirical metabolic rate and oxygen consumption estimates for free-ranging whales have been limited to counting respiratory events at the surface. Because these observations were limited and generally viewed from afar, variability in respiratory properties was unknown and oxygen consumption estimates assumed constant breath-to-breath tidal volume and oxygen uptake. However, evidence suggests that cetaceans in human care vary tidal volume and breathing frequency to meet aerobic demand, which would significantly impact energetic estimates if the findings held in free-ranging species. In this study, we used suction cup-attached video tags positioned posterior to the nares of two humpback whales (Megaptera novaeangliae) and four Antarctic minke whales (Balaenoptera bonaerensis) to measure inhalation duration, relative nares expansion, and maximum nares expansion. Inhalation duration and nares expansion varied between and within initial, middle, and terminal breaths of surface sequences between dives. The initial and middle breaths exhibited the least variability and had the shortest durations and smallest nares expansions. In contrast, terminal breaths were highly variable, with the longest inhalation durations and the largest nares expansions. Our results demonstrate breath-to-breath variability in duration and nares expansion, suggesting differential oxygen exchange in each breath during the surface interval. With future validation, inhalation duration or nares area could be used alongside respiratory frequency to improve oxygen consumption estimates by accounting for breath-to-breath variation in wild whales.

Keywords: Biotelemetry; Nares; Rorqual whales; Ventilation.


Conflict of interest statement

The authors declare there are no competing interests.

Figures

Figure 1
Figure 1. Frames measuring integrated area over time.
(A) This image sequence depicts our method for calculating the integrated area of the nares for humpback whale mn180607-44. The area of the pixels inside the yellow circle were measured for each frame (represented in text). (B) The plot depicts how the frame area changes over the duration of the inhalation. The y-axis was normalized to the largest area for each sequence of frames and the x-axis normalized to the longest duration for each sequence of frames.
Figure 2
Figure 2. Normalized nares expansion over time.
Relationship between normalized inhalation duration and frame area during initial, middle, and terminal breaths. The transparent lines show all the breaths for a given animal and the brighter lines represent the moving average for that breath type. The grey line is the flow rate over time for an inhalation as displayed in Sumich (2001). The line pictured here, however, is plotted along a positive y-axis instead of a negative one as originally done in the article. The x-axis was normalized to the longest inhalation duration, the left y-axis was normalized to the largest frame area, and the right y-axis was normalized to the largest ûow rate. The labels for each column represent the species (bb = Antarctic minke whale, mn = humpback) and the field identification number.
Figure 3
Figure 3. Inhalation duration, normalized integrated area, and normalized maximum nares area across breath types.
Boxplot showing (top) the inhale duration, (middle) the normalized integrated area, and (bottom) the normalized maximum nares expansion for initial, middle, and terminal breaths for all whales in the study. The box plots provide the mean, standard error, minimum, maximum, and outliers. The integrated and maximum nares area were normalized to the largest inhalation for each animal. The points on both plots represent outliers. Each whale is plotted separately according to their whale field ID and are represented by the different colors.
Figure 4
Figure 4. Normalized maximum nares area vs. inhalation duration.
Normalized integrated area plotted against inhalation duration separated by species. The black line represents the GLMM where inhale duration and species were the predictor variables and normalized maximum nares area was the response variable. Whale field ID was included as a random effect. Observations were grouped by breath type (initial, middle, or terminal). The labels for each panel represent the species (mn = humpback, bb = Antarctic minke whale). The y-axis was normalized to the largest maximum nares area for each individual.
Figure 5
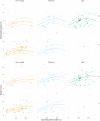
Figure 5. Total inhale duration and breath count vs. upcoming dive duration and lunge count.
The total duration spent inhaling per surface sequence plotted against the upcoming dive duration. The colored lines are separated by lunge count categories defined separately for humpback and minke whales. For minke whales: non-foraging = 0 lunges; moderate = 1–4 lunges; high = ≥ 5 lunges. For humpback whales: non-foraging = 0 lunges; moderate = 1–2 lunges; high = ≥ 3 lunges. No model was plotted for high lunges for humpback whales due to the small sample size. The lines represent the second degree polynomial GLMM where both lunge count and dive duration of the upcoming dive were predictor variables, total inhale duration or breath count was the response, and whale ID and species were random effects. Observations were separated by species. The labels for each panel represent the species (mn = humpback, bb = Antarctic minke whale).

Similar articles

Cited by

References

    1. Aphalo PJ. Ggpmisc: Miscellaneous Extensions to ‘Ggplot2’. R package version 0.3.3https://cran.r-project.org/web/packages/ggpmisc/index.html 2019
    1. Arranz P, Benoit-Bird KJ, Southall BL, Calambokidis J, Friedlaender AS, Tyack PL. Risso’s dolphins plan foraging dives. Journal of Experimental Biology. 2018;221:jeb165209. doi: 10.1242/jeb.165209. - DOI - PubMed
    1. Blawas AM, Nowacek DP, Rocho-Levine J, Robeck TR, Fahlman A. Scaling of heart rate with breathing frequency and body mass in cetaceans. Philosophical Transactions of the Royal Society B. 2021;376:20200223. doi: 10.1098/rstb.2020.0223. - DOI - PMC - PubMed
    1. Blix AS, Folkow LP. Daily energy expenditure in free living minke whales. Acta Physiologica Scandinavia. 1995;153:61–66. doi: 10.1111/j.1748-1716.1995.tb09834.x. - DOI - PubMed
    1. Boutilier RG, Reed JZ, Fedak MA. Unsteady-state gas exchange and storage in diving marine mammals: the harbor porpoise and gray seal. American Journal Physiology-Regulatory, Integrative and Comparative Physiology. 2001;281:R490–R494. doi: 10.1152/ajpregu.2001.281.2.R490. - DOI - PubMed

Publication types