. 2022 Nov 22;146(21):1591-1609.
doi: 10.1161/CIRCULATIONAHA.121.057623. Epub 2022 Jul 26.

Nuclear Receptor NR1D1 Regulates Abdominal Aortic Aneurysm Development by Targeting the Mitochondrial Tricarboxylic Acid Cycle Enzyme Aconitase-2

Affiliations

Nuclear Receptor NR1D1 Regulates Abdominal Aortic Aneurysm Development by Targeting the Mitochondrial Tricarboxylic Acid Cycle Enzyme Aconitase-2

Ling-Yue Sun et al. Circulation. .

Abstract

Background: Metabolic disorder increases the risk of abdominal aortic aneurysm (AAA). NRs (nuclear receptors) have been increasingly recognized as important regulators of cell metabolism. However, the role of NRs in AAA development remains largely unknown.

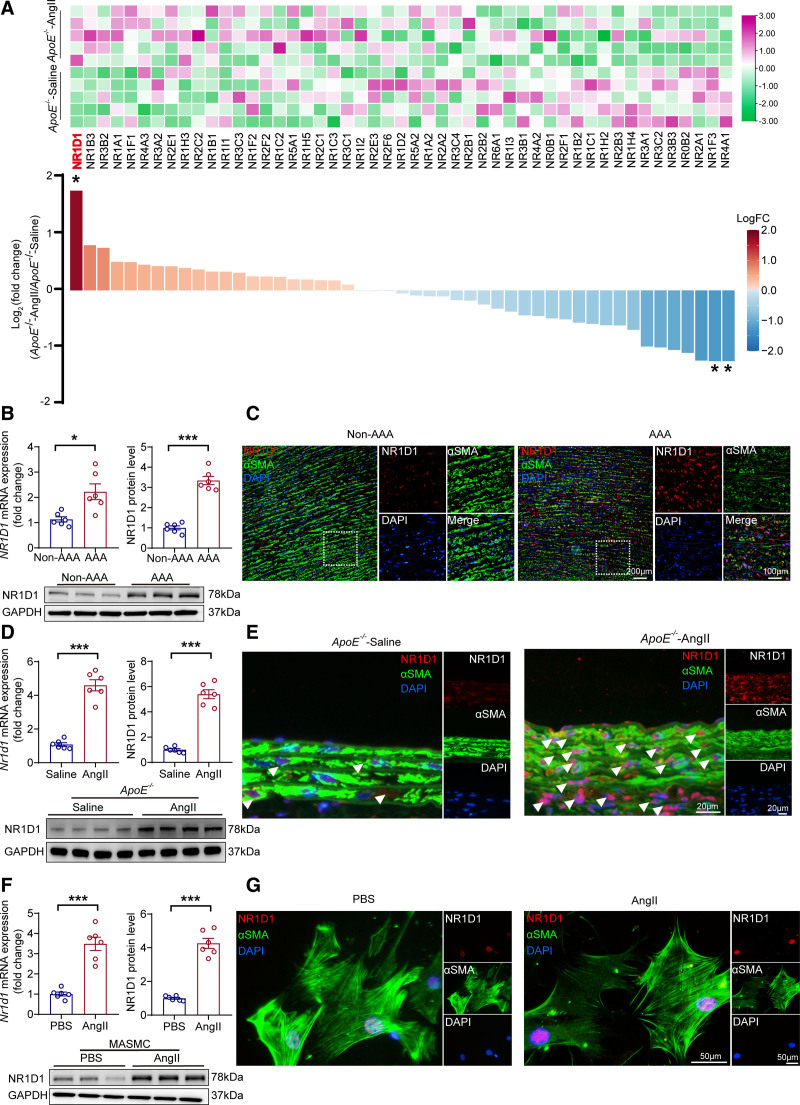
Methods: We analyzed the expression profile of the NR superfamily in AAA tissues and identified NR1D1 (NR subfamily 1 group D member 1) as the most highly upregulated NR in AAA tissues. To examine the role of NR1D1 in AAA formation, we used vascular smooth muscle cell (VSMC)-specific, endothelial cell-specific, and myeloid cell-specific conditional Nr1d1 knockout mice in both AngII (angiotensin II)- and CaPO4-induced AAA models.

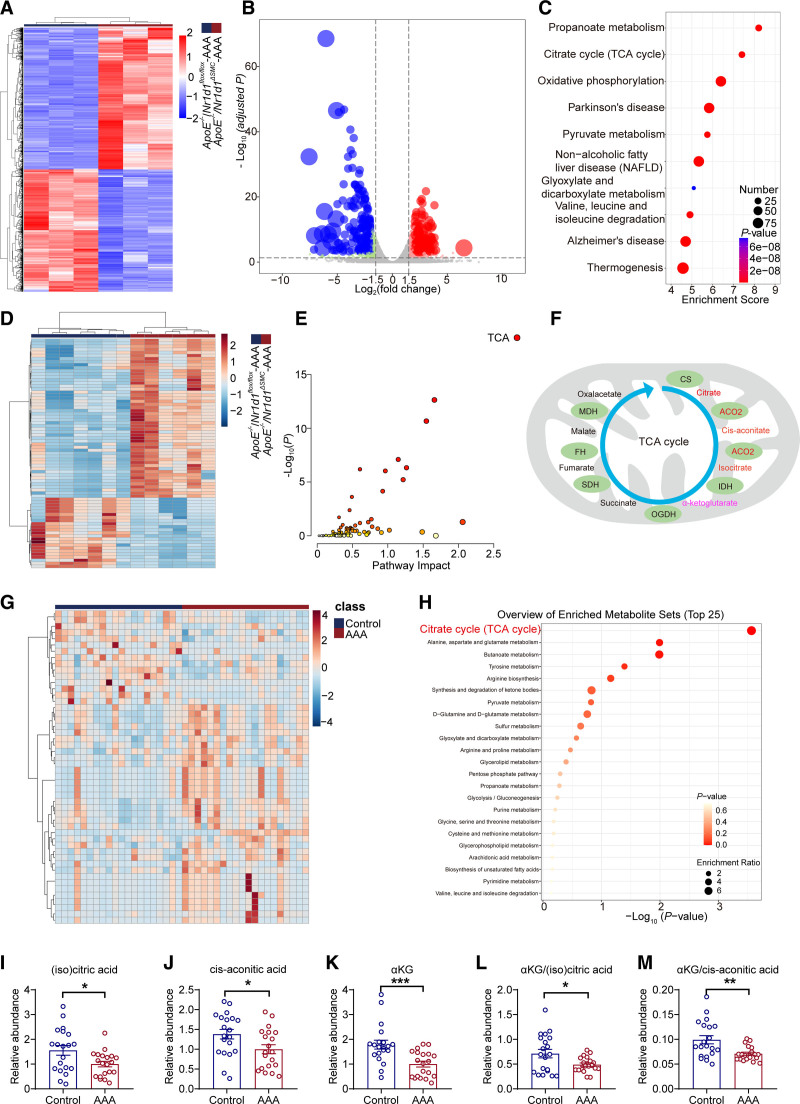
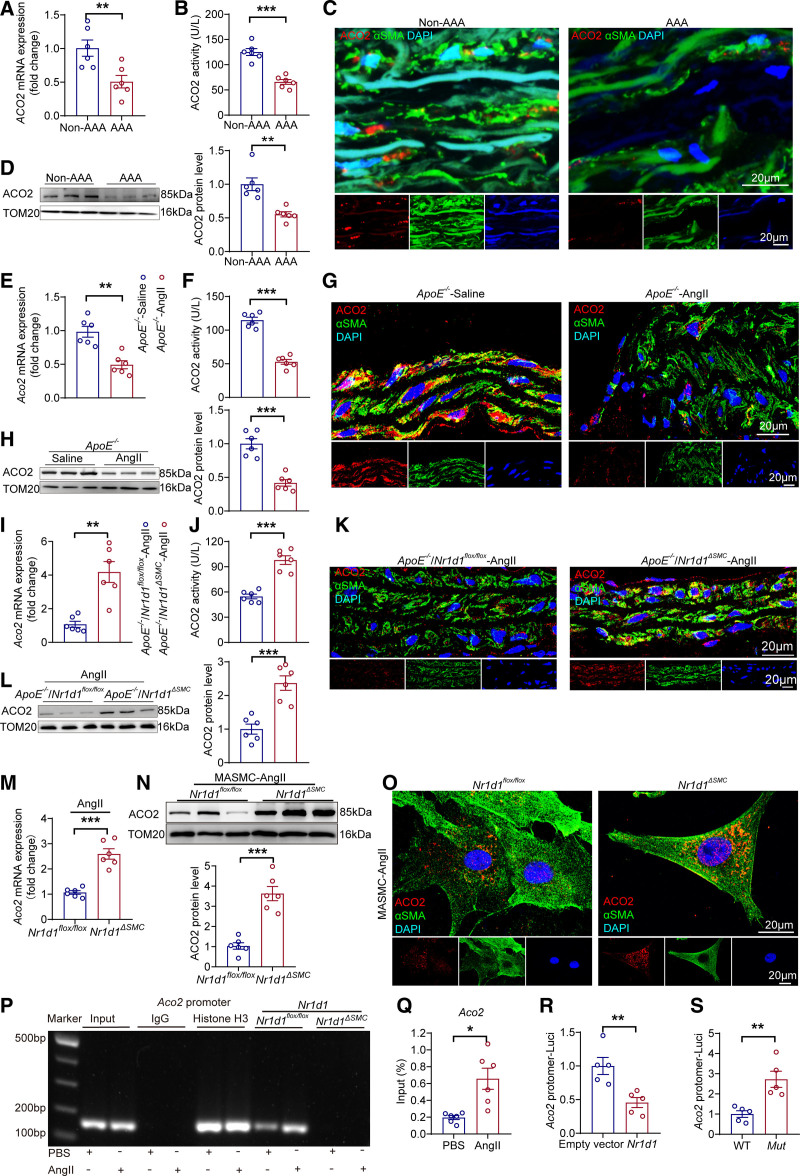
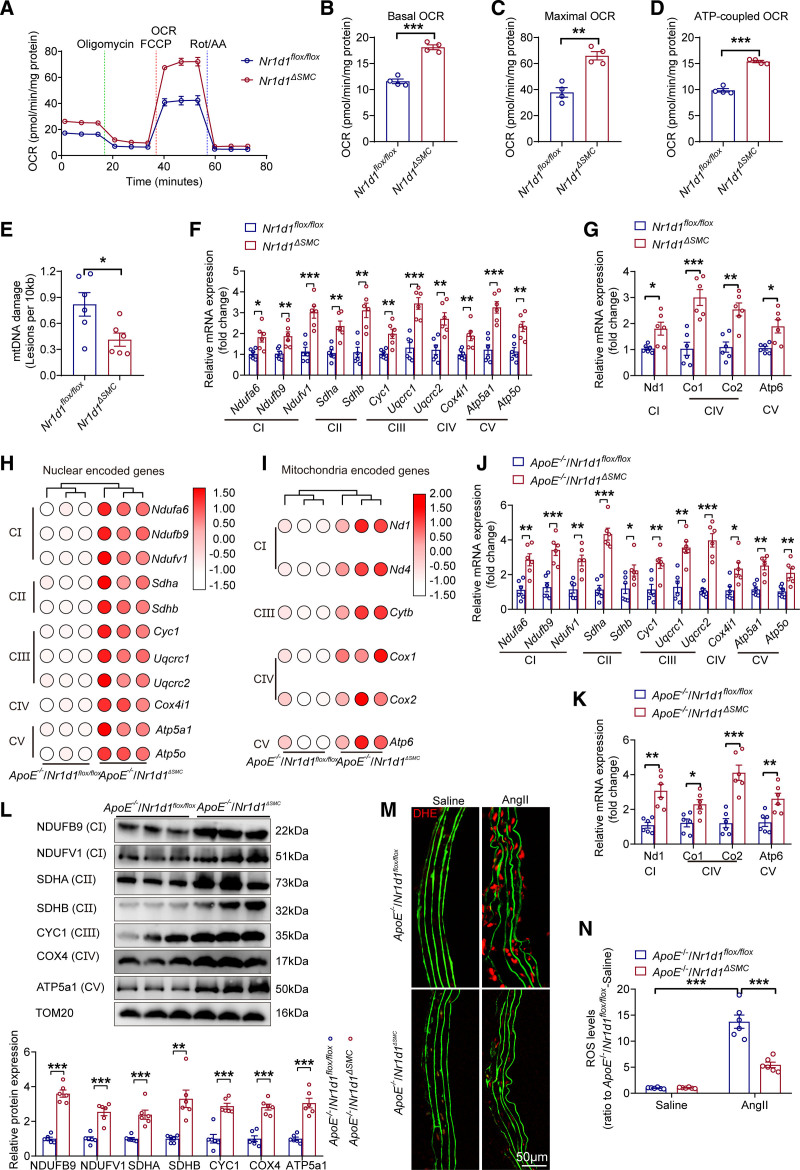
Results: Nr1d1 gene expression exhibited the highest fold change among all 49 NRs in AAA tissues, and NR1D1 protein was upregulated in both human and murine VSMCs from AAA tissues. The knockout of Nr1d1 in VSMCs but not endothelial cells and myeloid cells inhibited AAA formation in both AngII- and CaPO4-induced AAA models. Mechanistic studies identified ACO2 (aconitase-2), a key enzyme of the mitochondrial tricarboxylic acid cycle, as a direct target trans-repressed by NR1D1 that mediated the regulatory effects of NR1D1 on mitochondrial metabolism. NR1D1 deficiency restored the ACO2 dysregulation and mitochondrial dysfunction at the early stage of AngII infusion before AAA formation. Supplementation with αKG (α-ketoglutarate, a downstream metabolite of ACO2) was beneficial in preventing and treating AAA in mice in a manner that required NR1D1 in VSMCs.

Conclusions: Our data define a previously unrecognized role of nuclear receptor NR1D1 in AAA pathogenesis and an undescribed NR1D1-ACO2 axis involved in regulating mitochondrial metabolism in VSMCs. It is important that our findings suggest αKG supplementation as an effective therapeutic approach for AAA treatment.

Keywords: abdominal aortic aneurysm; alpha-Ketoglutarate; mitochondria; nuclear receptor; vascular smooth muscle.


Conflict of interest statement

None.

Figures

Figure 1.
Figure 1.
NR1D1 is upregulated in human and murine aortic SMCs from AAA tissues. A, Relative mRNA expression of 49 NRs measured by Nanostring profiling in saline- or AngII-induced AAA mice (n=5 per group). The raw data were normalized to the mean expression levels of the housekeeping genes, and the normalized data were log2-transformed. The log2 (fold change) and P values were calculated, and multiple testing using the Benjamini-Hochberg method was applied to adjust the P values. With a Benjamini-Hochberg adjusted P<0.05 and |log2(fold change)|≥1 as the criteria, 3 genes (Nr1d1 [adjusted P=0.03], Nr4a1 [adjusted P=0.04], and Nr1f3 [adjusted P=0.04]) were identified as differentially expressed NRs in mouse AAA tissues. *Benjamini–Hochberg adjusted P<0.05. B, Top, Quantification of NR1D1 mRNA and NR1D1 protein expression measured by RT-qPCR and Western blot in human AAA and non-AAA segments (n=6 per group). Data were analyzed by unequal variance t test. *P<0.05; ***P<0.001. Bottom, NR1D1 protein expression assessed by Western blot in human AAA and non-AAA segments. C, Representative images of NR1D1 expression by immunofluorescence staining of human AAA and non-AAA segments and costaining with the key SMC-associated marker αSMA and DAPI. D, Top, Quantification of Nr1d1 mRNA and NR1D1 protein expression measured by RT-qPCR and Western blot in mouse abdominal aortic segments (n=6 per group). Data were analyzed by Student t test. ***P<0.001. Bottom, NR1D1 protein expression assessed by Western blot in mouse abdominal aortic segments. E, Representative images of NR1D1 expression by immunofluorescence staining in mouse suprarenal abdominal aortas and costaining with αSMA and DAPI. F, Top, Quantification of Nr1d1 mRNA and NR1D1 protein expression measured by RT-qPCR and Western blot in isolated MASMCs after stimulation with PBS or AngII for 48 hours (n=6 independent experiments). Data were analyzed by Student t test. ***P<0.001. Bottom, NR1D1 protein expression assessed by Western blot in isolated MASMCs after stimulation with PBS or AngII for 48 hours. G, Representative images of NR1D1 expression by immunofluorescence staining in MASMCs and costaining with αSMA and DAPI. Data are expressed as mean ± SEM. AAA indicates abdominal aortic aneurysm; AngII, angiotensin II; DAPI, 4’6-diamidino-2-phenylindole; αSMA, α-smooth muscle actin; MASMCs, mouse aortic smooth muscle cells; NR1D1, nuclear receptor subfamily 1 group D member 1; Nr1f3, nuclear receptor subfamily 1 group F member 3; Nr4a1, nuclear receptor subfamily 4 group A member 1 NRs, nuclear receptors; PBS‚ phosphate-buffered saline; RT-qPCR, real-time quantitative polymerase chain reaction; and SMC, smooth muscle cell.
Figure 2.
Figure 2.
VSMC-specific NR1D1 deficiency represses AngII-induced AAA formation. A, Schematic protocol: ApoE−/−/Nr1d1flox/flox and ApoE−/−/Nr1d1ΔSMC mice were subcutaneously injected with saline or AngII by a mini osmotic pump for 28 days (n=30 per group). B, Representative images of the macroscopic features of AAA formation in indicated groups. C, Representative images of macroscopic features and HE staining of crossed-sections of aneurysm ruptures (arrow indicated). D, Survival curves in indicated groups (n=30 per group). Survival data were analyzed by the Kaplan-Meier method and compared using log-rank tests. *P<0.05. E, The incidence of AngII-induced AAA in indicated groups (n=30 per group). Data were analyzed by a Fisher exact test. **P<0.01; ***P<0.001. F, The incidence of AngII-induced aneurysm rupture in indicated groups (n=30 per group). Data were analyzed by a Fisher exact test. *P<0.05. G and H, Quantification of the maximal diameter of suprarenal abdominal aortas measured by a Digital Vernier Caliper and total aortic weight/BW in indicated groups (n=22–30 per group). Data were analyzed by 2-way ANOVA followed by the Bonferroni post hoc test. ***P<0.001. I, Representative images of abdominal aortas visualized by MUI using the B mode in indicated groups. J, Quantification of the maximal diameter of suprarenal abdominal aortas measured by MUI using the B mode in indicated groups (n=22–30 per group). Data were analyzed by 2-way ANOVA followed by the Bonferroni post hoc test. ***P<0.001. K, Representative images of abdominal aortas visualized by MRI in indicated groups. Top, Abdominal aortas visualized using 3-dimensional time of flight fast low angle shot sequence (TOF-3D-Flash). Bottom, Abdominal aortas visualized by T2-weighted, PD-weighted imaging with multiple-echo multishot sequence (MEMS-PD-T2). Data are expressed as mean ± SEM. AAA indicates abdominal aortic aneurysm; AngII, angiotensin II; BW, body weight; EVG staining, elastin van Gieson staining; HE staining, hematoxylin and eosin staining; MUI, micro-ultrasound imaging; MRI, magnetic resonance imaging; NR1D1, nuclear receptor subfamily 1 group D member 1; and SMC, smooth muscle cell.
Figure 3.
Figure 3.
NR1D1 perturbs mitochondrial metabolism by the TCA cycle in AAA. A, Heatmap of differentially expressed genes in ApoE−/−/Nr1d1flox/flox-AngII and ApoE−/−/Nr1d1ΔSMC-AngII groups. Each column represents an individual replicate, and each row represents an individual gene. Upregulated genes are shown in red, and downregulated genes are displayed in blue. n=3 for both groups. Differentially expressed genes were defined as genes with a Benjamini-Hochberg adjusted P value <0.05 and |log2(fold change)|≥1. B, Volcano plot reveals the magnitude and significance of altered genes in ApoE−/−/Nr1d1flox/flox-AngII and ApoE−/−/Nr1d1ΔSMC-AngII groups. Differentially expressed genes were defined as genes with a Benjamini-Hochberg adjusted P value <0.05 and |log2(fold change)|≥1. C, The top 10 Kyoto Encyclopedia Genes and Genomes (KEGG) pathways of differentially expressed genes. D, Heatmap of differential plasma metabolites in ApoE−/−/Nr1d1flox/flox-AngII and ApoE−/−/Nr1d1ΔSMC-AngII groups. n=7 for ApoE−/−/Nr1d1flox/flox-AngII, n=6 for ApoE−/−/Nr1d1ΔSMC-AngII. Differential metabolites in plasma were identified using variable important in projection (VIP) values of >1.2 in an orthogonal partial least squares–discriminant analysis (OPLS-DA) model. E, Multi-omics joint pathway analysis of transcriptomes and metabolomes. The highest ranked pathway is the TCA cycle. F, A combined analysis of transcriptome and metabolome profiles identified ACO2 in the TCA cycle as the potential target of NR1D1. The schematic illustration of intracellular metabolites and enzymes in the TCA metabolic pathway (modified from the combined analysis). CS, IDH, and OGDH are rate-limiting enzymes in the TCA cycle. G, Heatmap of differential plasma metabolites in patients with AAA and matched control subjects (n=20 per group). Differential metabolites in plasma were identified using VIP values of >1.2 in an OPLS-DA model. H, KEGG pathway enrichment analysis of human metabolomics. I through M, Relative abundances of (iso)citric acid, cis-aconitic acid, and αKG, and αKG to (iso)citrate/cis-aconitate ratios in patients with AAA and matched control subjects (n=20 per group). Data were analyzed by Student t test (I, J, and L) or Mann-Whitney U test (K and M). *P<0.05; **P<0.01; ***P<0.001. Data are expressed as mean ± SEM. AAA indicates abdominal aortic aneurysm; ACO2, aconitase-2; αKG, α-ketoglutarate; AngII, angiotensin II; CS, citrate synthase; FH, fumarate hydratase; IDH, isocitrate dehydrogenase; MDH, malate dehydrogenase; NR1D1, nuclear receptor subfamily 1 group D member 1; OGDH, oxoglutarate dehydrogenase; SDH, succinate dehydrogenase; and TCA, tricarboxylic acid.
Figure 4.
Figure 4.
Aco2 is the direct trans-repression target of NR1D1 in regulating mitochondrial function. A and B, Aco2 mRNA expression and ACO2 activity measured by RT-qPCR and ELISAs in human AAA and non-AAA segments (n=6 per group). Data were analyzed by Student t test. **P<0.01; ***P<0.001. C, Representative images of ACO2 expression by immunofluorescence staining of human AAA and non-AAA segments and costaining with the key smooth muscle cell–associated marker αSMA and DAPI. D, Left, ACO2 protein expression assessed by Western blot in human AAA and non-AAA segments. Right, Quantification of ACO2 protein expression measured by Western blot in indicated groups (n=6 per group). Data were analyzed by Student t test. **P<0.01. E and F, Aco2 mRNA expression and ACO2 activity measured by RT-qPCR and ELISAs in abdominal aortic segments from saline- and AngII-infused ApoE−/− mice (n=6 per group). Data were analyzed by Student t test. **P<0.01; ***P<0.001. G, Representative images of ACO2 expression by immunofluorescence staining in abdominal aortas from saline- and AngII-infused ApoE−/− mice. H, Left, ACO2 protein expression measured by Western blot in abdominal aortas from saline- and AngII-infused ApoE−/− mice. Right, Quantification of ACO2 protein expression measured by Western blot in indicated groups (n=6 per group). Data were analyzed by Student t test. ***P<0.001. I and J, Aco2 mRNA expression and ACO2 activity measured by RT-qPCR and ELISAs in abdominal aortas from AngII-infused ApoE−/−/Nr1d1flox/flox and ApoE−/−/Nr1d1ΔSMC mice (n=6 per group). Data were analyzed by Student t test. **P<0.01; ***P<0.001. K, Representative images of ACO2 expression by immunofluorescence staining in abdominal aortas from AngII-infused ApoE−/−/Nr1d1flox/flox and ApoE−/−/Nr1d1ΔSMC mice. L, Left, ACO2 protein expression measured by Western blot in abdominal aortas from AngII-infused ApoE−/−/Nr1d1flox/flox and ApoE−/−/Nr1d1ΔSMC mice. Right, Quantification of ACO2 protein expression measured by Western blot in indicated groups (n=6 per group). Data were analyzed by Student t test. ***P<0.001. M, Aco2 mRNA expression measured by RT-qPCR in MASMCs isolated from Nr1d1flox/flox and Nr1d1ΔSMC mice after stimulation with AngII for 48 h (n=6 independent experiments). Data were analyzed by Student t test. ***P<0.001. N, Top, Mitochondrial ACO2 protein expression measured by Western blot in MASMCs isolated from Nr1d1flox/flox and Nr1d1ΔSMC mice after stimulation with AngII for 48 hours. Bottom, Quantification of ACO2 protein expression measured by Western blot in indicated groups (n=6 independent experiments). Data were analyzed by Student t test. ***P<0.001. O, Representative images of ACO2 expression by immunofluorescence staining in MASMCs isolated from Nr1d1flox/flox and Nr1d1ΔSMC mice after stimulation with AngII for 48 hours. P, ChIP-qPCR was performed with antibodies to NR1D1, and the target promoter region of Aco2 was amplified by qPCR. Q, Quantification of ChIP-qPCR (n=6 independent experiments). Data were analyzed by Student t test. *P<0.05. R, MASMCs were cotransfected with empty or Nr1d1 plasmid and pGL3-Aco2-promoter-Luci plasmid for 48 hours (n=5 independent experiments). Data were analyzed by Student t test. **P<0.01. S, MASMCs were cotransfected with Nr1d1 plasmid and pGL3-m_wtAco2-promoter-Luci (WT) or pGL3-m_mutAco2-promoter-Luci plasmid (Mut) for 48 hours (n=5 independent experiments). Data were analyzed by Student t test. **P<0.01. Data are expressed as mean ± SEM. AAA indicates abdominal aortic aneurysm; ACO2, aconitase-2; AngII, angiotensin II; ChIP, chromatin immunoprecipitation; MASMCs, mouse aortic smooth muscle cells; NR1D1, nuclear receptor subfamily 1 group D member 1; RT-qPCR, real-time quantitative polymerase chain reaction; and WT, wild type.
Figure 5.
Figure 5.
VSMC-specific NR1D1 deficiency regulates the expression of mitochondria-related genes and inhibits mitochondrial ROS production. A, Summarized OCR tracings in MASMCs isolated from Nr1d1flox/flox and Nr1d1ΔSMC mice after stimulation with AngII for 48 hours (n=4 independent experiments). B through D, Basal, maximal, and ATP-coupled OCRs in indicated groups (n=4 independent experiments). Data were analyzed by Student t test. **P<0.01; ***P<0.001. E, mtDNA damage detection in MASMCs isolated from Nr1d1flox/flox and Nr1d1ΔSMC mice after stimulation with AngII for 48 hours (n=6 independent experiments). Data were analyzed by Student t test. *P<0.05. F and G, Relative mRNA expression of nuclear- and mitochondrial-encoded mitochondrial genes in MASMCs isolated from Nr1d1flox/flox and Nr1d1ΔSMC mice with AngII treatment for 48 hours, normalized to β-actin (n=6 independent experiments). Data were analyzed by Student t test. *P<0.05; **P<0.01; ***P<0.001. H and I, Heatmap of log2 (fold change) of nuclear- and mitochondrial-encoded mitochondrial genes in the abdominal aorta from AngII-infused ApoE−/−/Nr1d1flox/flox and ApoE−/−/Nr1d1ΔSMC mice (n=3 per group). Differentially expressed genes were defined as genes with a Benjamini-Hochberg adjusted P value <0.05 and |log2(fold change)| ≥1. J and K, Relative mRNA expression of nuclear and mitochondria-encoded mitochondrial genes in AngII-infused ApoE−/−/Nr1d1flox/flox and ApoE−/−/Nr1d1ΔSMC mice (n=6 per group). Data were analyzed by Student t test. *P<0.05; **P<0.01; ***P<0.001. L, Top, Protein expression of mitochondrial complexes in abdominal aortas from AngII-infused ApoE−/−/Nr1d1flox/flox and ApoE−/−/Nr1d1ΔSMC mice. Bottom, Quantification of protein expression of mitochondrial complexes in indicated groups (n=6 per group). Data were analyzed by Student t test. *P<0.05; ***P<0.001. M and N, Representative images of in situ DHE staining and quantification of ROS levels in suprarenal abdominal aortas to assess superoxide generation in indicated groups (n=6 per group). Data were analyzed by 2o-way ANOVA followed by the Bonferroni post hoc test. ***P<0.001. Data are expressed as mean ± SEM. AngII indicates angiotensin II; DHE, dihydroethidium; MASMCs, mouse aortic smooth muscle cells; mtDNA, mitochondrial DNA; NR1D1, nuclear receptor subfamily 1 group D member 1; OCR, oxygen consumption rate; ROS, reactive oxygen species; and SMC, smooth muscle cell.
Figure 6.
Figure 6.
NR1D1 deficiency results in early changes in mitochondrial function on day 3 after AngII infusion before a change in AAAs. Abdominal aortas from ApoE−/−/Nr1d1flox/flox and ApoE−/−/Nr1d1ΔSMC mice were harvested on the morning of day 3 after AngII infusion before a change in AAAs. A, Representative images of the macroscopic features and HE staining of suprarenal abdominal aortas in ApoE−/−/Nr1d1flox/flox and ApoE−/−/Nr1d1ΔSMC mice on day 3 after AngII infusion. B, Quantification of the maximal diameter of suprarenal abdominal aortas in indicated groups (n=10 per group). Data were analyzed by Student t test. C, Representative images of MMP activity and in situ DHE staining in indicated groups. D, Left, MMP-2 protein expression measured by Western blot and MMP activity measured by zymography in indicated groups. Right, Quantification of MMP-2 protein expression and MMP activity in indicated groups (n=6 per group). Data were analyzed by Student t test. **P<0.01; ***P<0.001. E, IL-6, TNF-α, and MCP-1 expression in abdominal aortas assessed by ELISAs in indicated groups (n=10 per group). Data were analyzed by Student t test. **P<0.01; ***P<0.001. F, IL-6, TNF-α, and MCP-1 expression measured by immunohistochemistry in indicated groups. G and H, Aco2 mRNA expression and ACO2 activity measured by RT-qPCR and ELISAs in abdominal aortas from ApoE−/−/Nr1d1flox/flox and ApoE−/−/Nr1d1ΔSMC mice on day 3 after AngII infusion (n=6 per group). Data were analyzed by Student t test. ***P<0.001. I, Left, ACO2 protein expression measured by Western blot in abdominal aortas from ApoE−/−/Nr1d1flox/flox and ApoE−/−/Nr1d1ΔSMC mice on day 3 after AngII infusion. Right, Quantification of ACO2 protein expression measured by Western blot in indicated groups (n=6 per group). Data were analyzed by Student t test. **P<0.01. J, Representative images of ACO2 expression by immunofluorescence staining in indicated groups. K, Left, Representative images of mitochondrial ∆Ψm by JC-1 staining in indicated groups. Right, Quantification of JC-1 staining (n=6 per group). Data were analyzed by Student t test. ***P<0.001. L, Left, Protein expression of mitochondrial complexes in the abdominal aortas from AngII-infused ApoE−/−/Nr1d1flox/flox and ApoE−/−/Nr1d1ΔSMC mice on day 3 after AngII infusion. Right, Quantification of protein expression of mitochondrial complexes in indicated groups (n=6 per group). Data were analyzed by Student t test. *P<0.05; **P<0.01; ***P<0.001. Data are expressed as mean ± SEM. ACO2 indicates aconitase-2; AngII, angiotensin II; DHE, dihydroethidium; IL-6, interleukin-6; MCP-1, monocyte chemoattractant protein-1; MMP, matrix metalloproteinase; NR1D1, nuclear receptor subfamily 1 group D member 1; NS, nonsignificant; RT-qPCR, real-time quantitative polymerase chain reaction; SMC, smooth muscle cell; and TNF-α, tumor necrosis factor-α.
Figure 7.
Figure 7.
ACO2 silencing abolishes the protective effects of NR1D1 deficiency on mitochondrial function. A, Top, Quantification of Aco2 mRNA and ACO2 protein expression assessed by RT-qPCR and Western blot in MASMCs after transfection with SiCon and SiAco2-1, normalized to β-actin (n=6 independent experiments). Data were analyzed by Student t test. ***P<0.001. Bottom, ACO2 protein expression assessed by Western blot in indicated groups. B, Summarized OCR tracings in AngII-treated MASMCs isolated from Nr1d1flox/flox and Nr1d1ΔSMC mice pretreated with SiCon and SiAco2 (n=6 independent experiments). C, mtDNA damage assay in indicated groups (n=10 independent experiments). Data were analyzed by 2-way ANOVA followed by the Bonferroni post hoc test. *P<0.05; ***P<0.001. D, MitoTracker Red CMXRos staining was used to measure mitochondrial membrane potential for the assessment of early-stage apoptosis. E, Quantification of MitoTracker Red CMXRos staining (n=6 independent experiments). Data were analyzed by 2-way ANOVA followed by the Bonferroni post hoc test. *P<0.05; ***P<0.001. F, JC-1 staining was used to measure mitochondrial membrane potential for the assessment of early-stage apoptosis. G, Quantification of JC-1 staining (n=6 independent experiments). Data were analyzed by 2-way ANOVA followed by the Bonferroni post hoc test. *P<0.05; ***P<0.001. H, Protein expression of MMP-2, apoptotic proteins (Cleaved caspase-3/Caspase-3, Bcl2 and Bax), and mitochondrial ETC complexes measured by Western blot, and MMP activity determined by zymography in indicated groups. I, Quantification of MMP-2, apoptotic proteins (Cleaved caspase-3/Caspase-3, Bcl2 and Bax), and mitochondrial ETC complexes protein expression determined by Western blot and MMP activity determined by zymography in indicated groups (n=6 independent experiments). Data were analyzed by 2-way ANOVA followed by the Bonferroni post hoc test. *P<0.05; **P<0.01; ***P<0.001. Data are expressed as mean ± SEM. ACO2 indicates aconitase-2; AngII, angiotensin II; ETC, electron transport chain; MASMC, mouse aortic smooth muscle cell; MMP, matrix metallopeptidase; mtDNA, mitochondrial DNA; NR1D1, nuclear receptor subfamily 1 group D member 1; NS, nonsignificant; OCR, oxygen consumption rate; and RT-qPCR, real-time quantitative polymerase chain reaction.
Figure 8.
Figure 8.
Supplementation with the ACO2 downstream metabolite αKG protects against AAA formation. A, Schematic protocol: saline- or AngII-infused ApoE−/−/Nr1d1flox/flox and ApoE−/−/Nr1d1ΔSMC mice were intraperitoneally injected with vehicle or DM-αKG (100 mg/kg/d) for 28 days. B, Representative images of the macroscopic features of AAA formation in indicated groups. C, The incidence of AAA formation in indicated groups (n=30 per group). Data were analyzed by a Fisher exact test. *P<0.05; **P<0.01; ***P<0.001. D, Quantification of the maximal diameter of suprarenal abdominal aortas measured using a Digital Vernier Caliper (n=22–30 per group). Data were analyzed by 2-way ANOVA followed by the Bonferroni post hoc test. **P<0.01; ***P<0.001. E, Quantification of total aortic weight/BW (n=22–30 per group). Data were analyzed by 2-way ANOVA followed by the Bonferroni post hoc test. ***P<0.001. F, Representative images of suprarenal abdominal aortas visualized by MUI using the B mode in indicated groups. G, Quantification of the maximal diameter of suprarenal abdominal aortas measured by MUI using the B mode in indicated groups (n=22–30 per group). Data were analyzed by 2-way ANOVA followed by the Bonferroni post hoc test. **P<0.01; ***P<0.001. Data are expressed as mean ± SEM. H, Schematic representation of the molecular mechanisms. Under a pathological state during AAA development, upregulation of NR1D1 represses the nuclear transcription of Aco2 in VSMCs with recruitment of the NCoR1-HDAC3 corepressor complex. Consequently, reduced ACO2 expression and activity suppress the TCA cycle, disrupt mitochondrial homeostasis, and subsequently trigger VSMCs apoptosis, eventually resulting in the formation of AAA. Supplementation with αKG, a downstream metabolite of ACO2, alleviates mitochondrial dysfunction and restricts AAA formation. AAA indicates abdominal aortic aneurysm; ACO2, aconitase-2; αKG, α-ketoglutarate; AngII, angiotensin II; DM-αKG, dimethyl α-ketoglutarate; HDAC3, histone deacetylase 3; MUI, micro-ultrasound imaging; NCoR1, nuclear receptor corepressor 1; NR1D1, nuclear receptor subfamily 1 group D member 1; NS, nonsignificant; SMC, smooth muscle cell; TCA, tricarboxylic acid; and VSMCs, vascular smooth muscle cells.

Comment in

References

    1. Chaikof EL, Dalman RL, Eskandari MK, Jackson BM, Lee WA, Mansour MA, Mastracci TM, Mell M, Murad MH, Nguyen LL, et al. . The Society for Vascular Surgery practice guidelines on the care of patients with an abdominal aortic aneurysm. J Vasc Surg. 2018;67:2–77.e2. doi: 10.1016/j.jvs.2017.10.044 - PubMed
    1. Shi J, Yang Y, Cheng A, Xu G, He F. Metabolism of vascular smooth muscle cells in vascular diseases. Am J Physiol Heart Circ Physiol. 2020;319:H613–H631. doi: 10.1152/ajpheart.00220.2020 - PubMed
    1. Nasrallah CM, Horvath TL. Mitochondrial dynamics in the central regulation of metabolism. Nat Rev Endocrinol. 2014;10:650–658. doi: 10.1038/nrendo.2014.160 - PubMed
    1. Li Y, Ren P, Dawson A, Vasquez HG, Ageedi W, Zhang C, Luo W, Chen R, Li Y, Kim S, et al. . Single-cell transcriptome analysis reveals dynamic cell populations and differential gene expression patterns in control and aneurysmal human aortic tissue. Circulation. 2020;142:1374–1388. doi: 10.1161/CIRCULATIONAHA.120.046528 - PMC - PubMed
    1. Hollenberg AN. Metabolic health and nuclear-receptor sensitivity. N Engl J Med. 2012;366:1345–1347. doi: 10.1056/NEJMcibr1114529 - PubMed

Publication types

MeSH terms