. 2022 Aug 23;146(8):623-638.
doi: 10.1161/CIRCULATIONAHA.121.057400. Epub 2022 Jul 26.

Donor Macrophages Modulate Rejection After Heart Transplantation

Affiliations

Donor Macrophages Modulate Rejection After Heart Transplantation

Benjamin J Kopecky et al. Circulation. .

Abstract

Background: Cellular rejection after heart transplantation imparts significant morbidity and mortality. Current immunosuppressive strategies are imperfect, target recipient T cells, and have adverse effects. The innate immune response plays an essential role in the recruitment and activation of T cells. Targeting the donor innate immune response would represent the earliest interventional opportunity within the immune response cascade. There is limited knowledge about donor immune cell types and functions in the setting of cardiac transplantation, and no current therapeutics exist for targeting these cell populations.

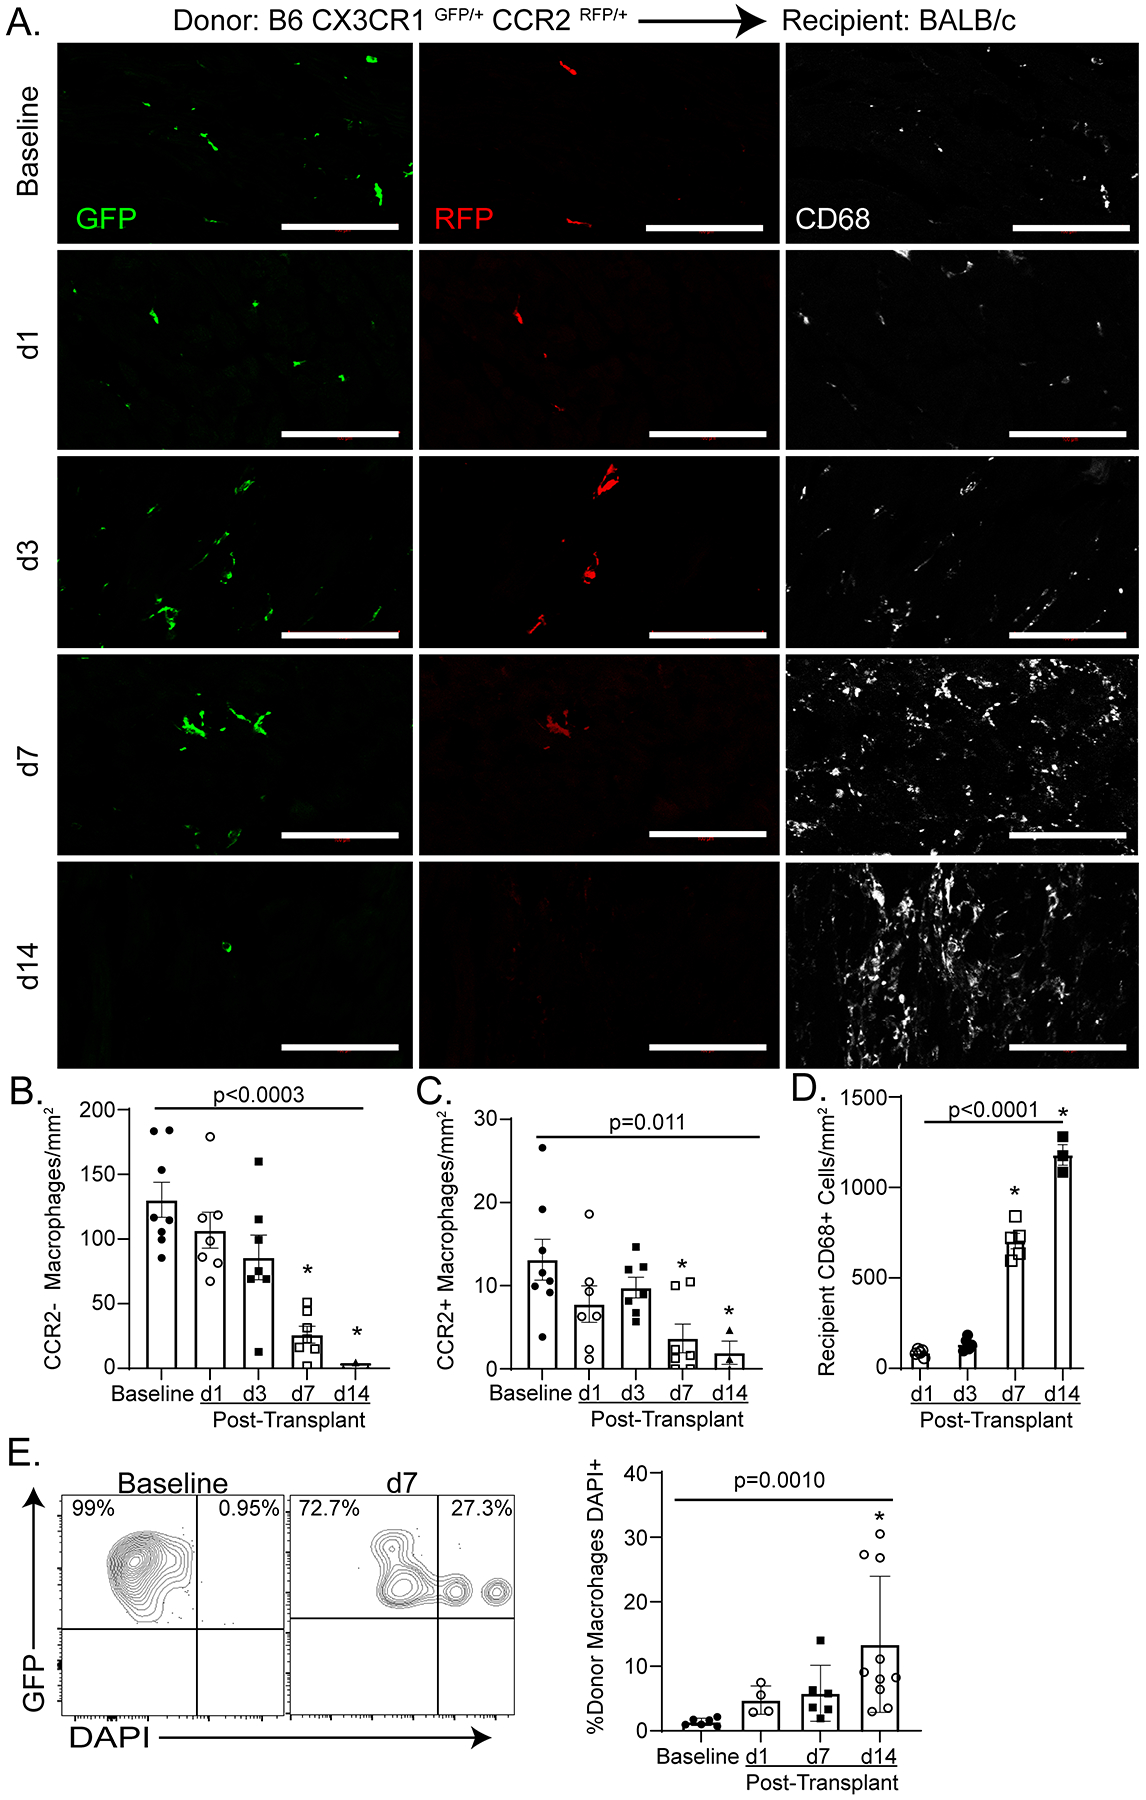
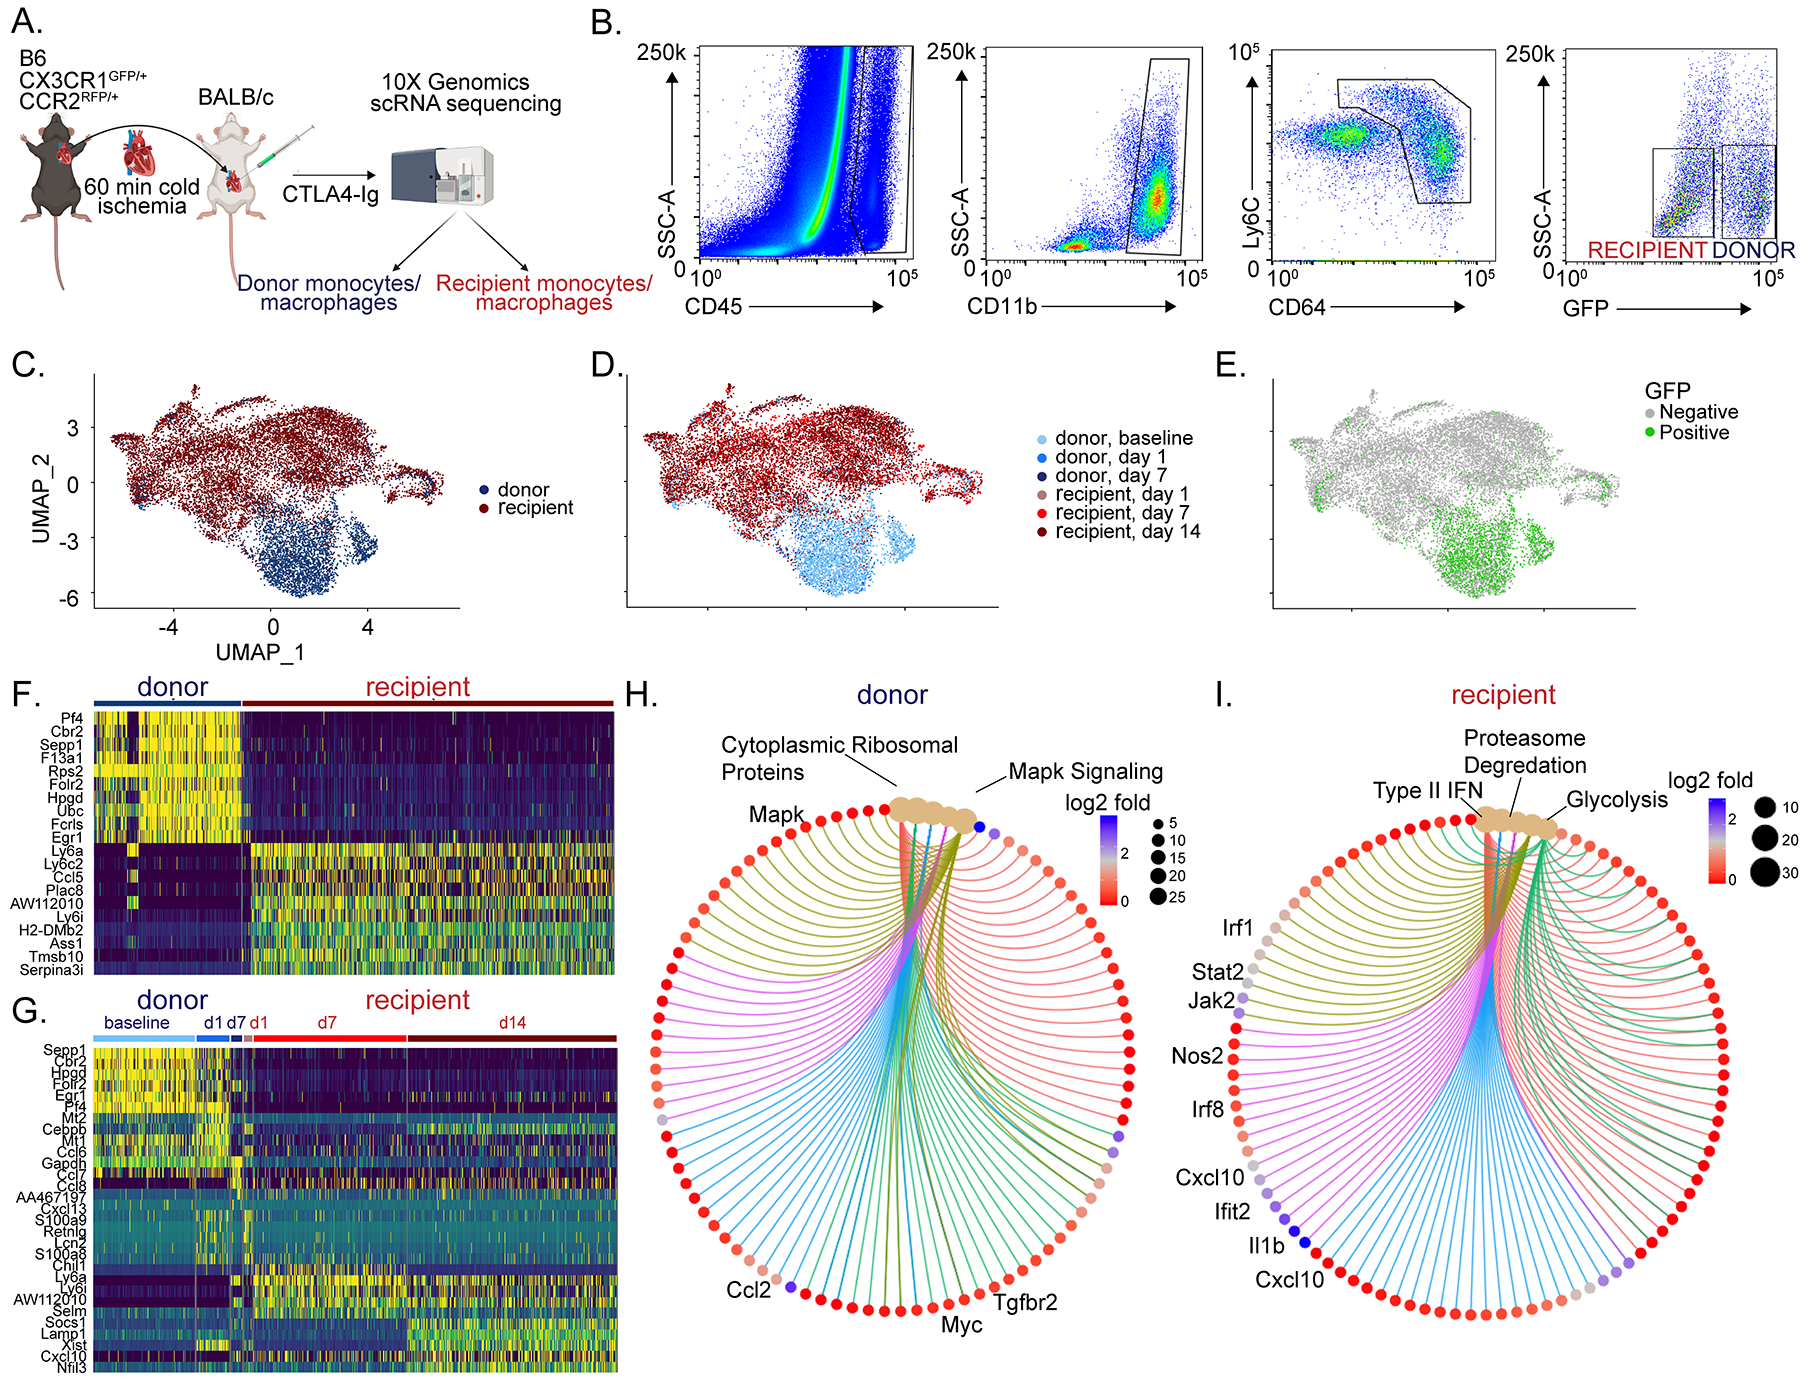
Methods: Using genetic lineage tracing, cell ablation, and conditional gene deletion, we examined donor mononuclear phagocyte diversity and macrophage function during acute cellular rejection of transplanted hearts in mice. We performed single-cell RNA sequencing on donor and recipient macrophages and monocytes at multiple time points after transplantation. On the basis of our imaging and single-cell RNA sequencing data, we evaluated the functional relevance of donor CCR2+ (C-C chemokine receptor 2) and CCR2- macrophages using selective cell ablation strategies in donor grafts before transplant. Last, we performed functional validation that donor macrophages signal through MYD88 (myeloid differentiation primary response protein 88) to facilitate cellular rejection.

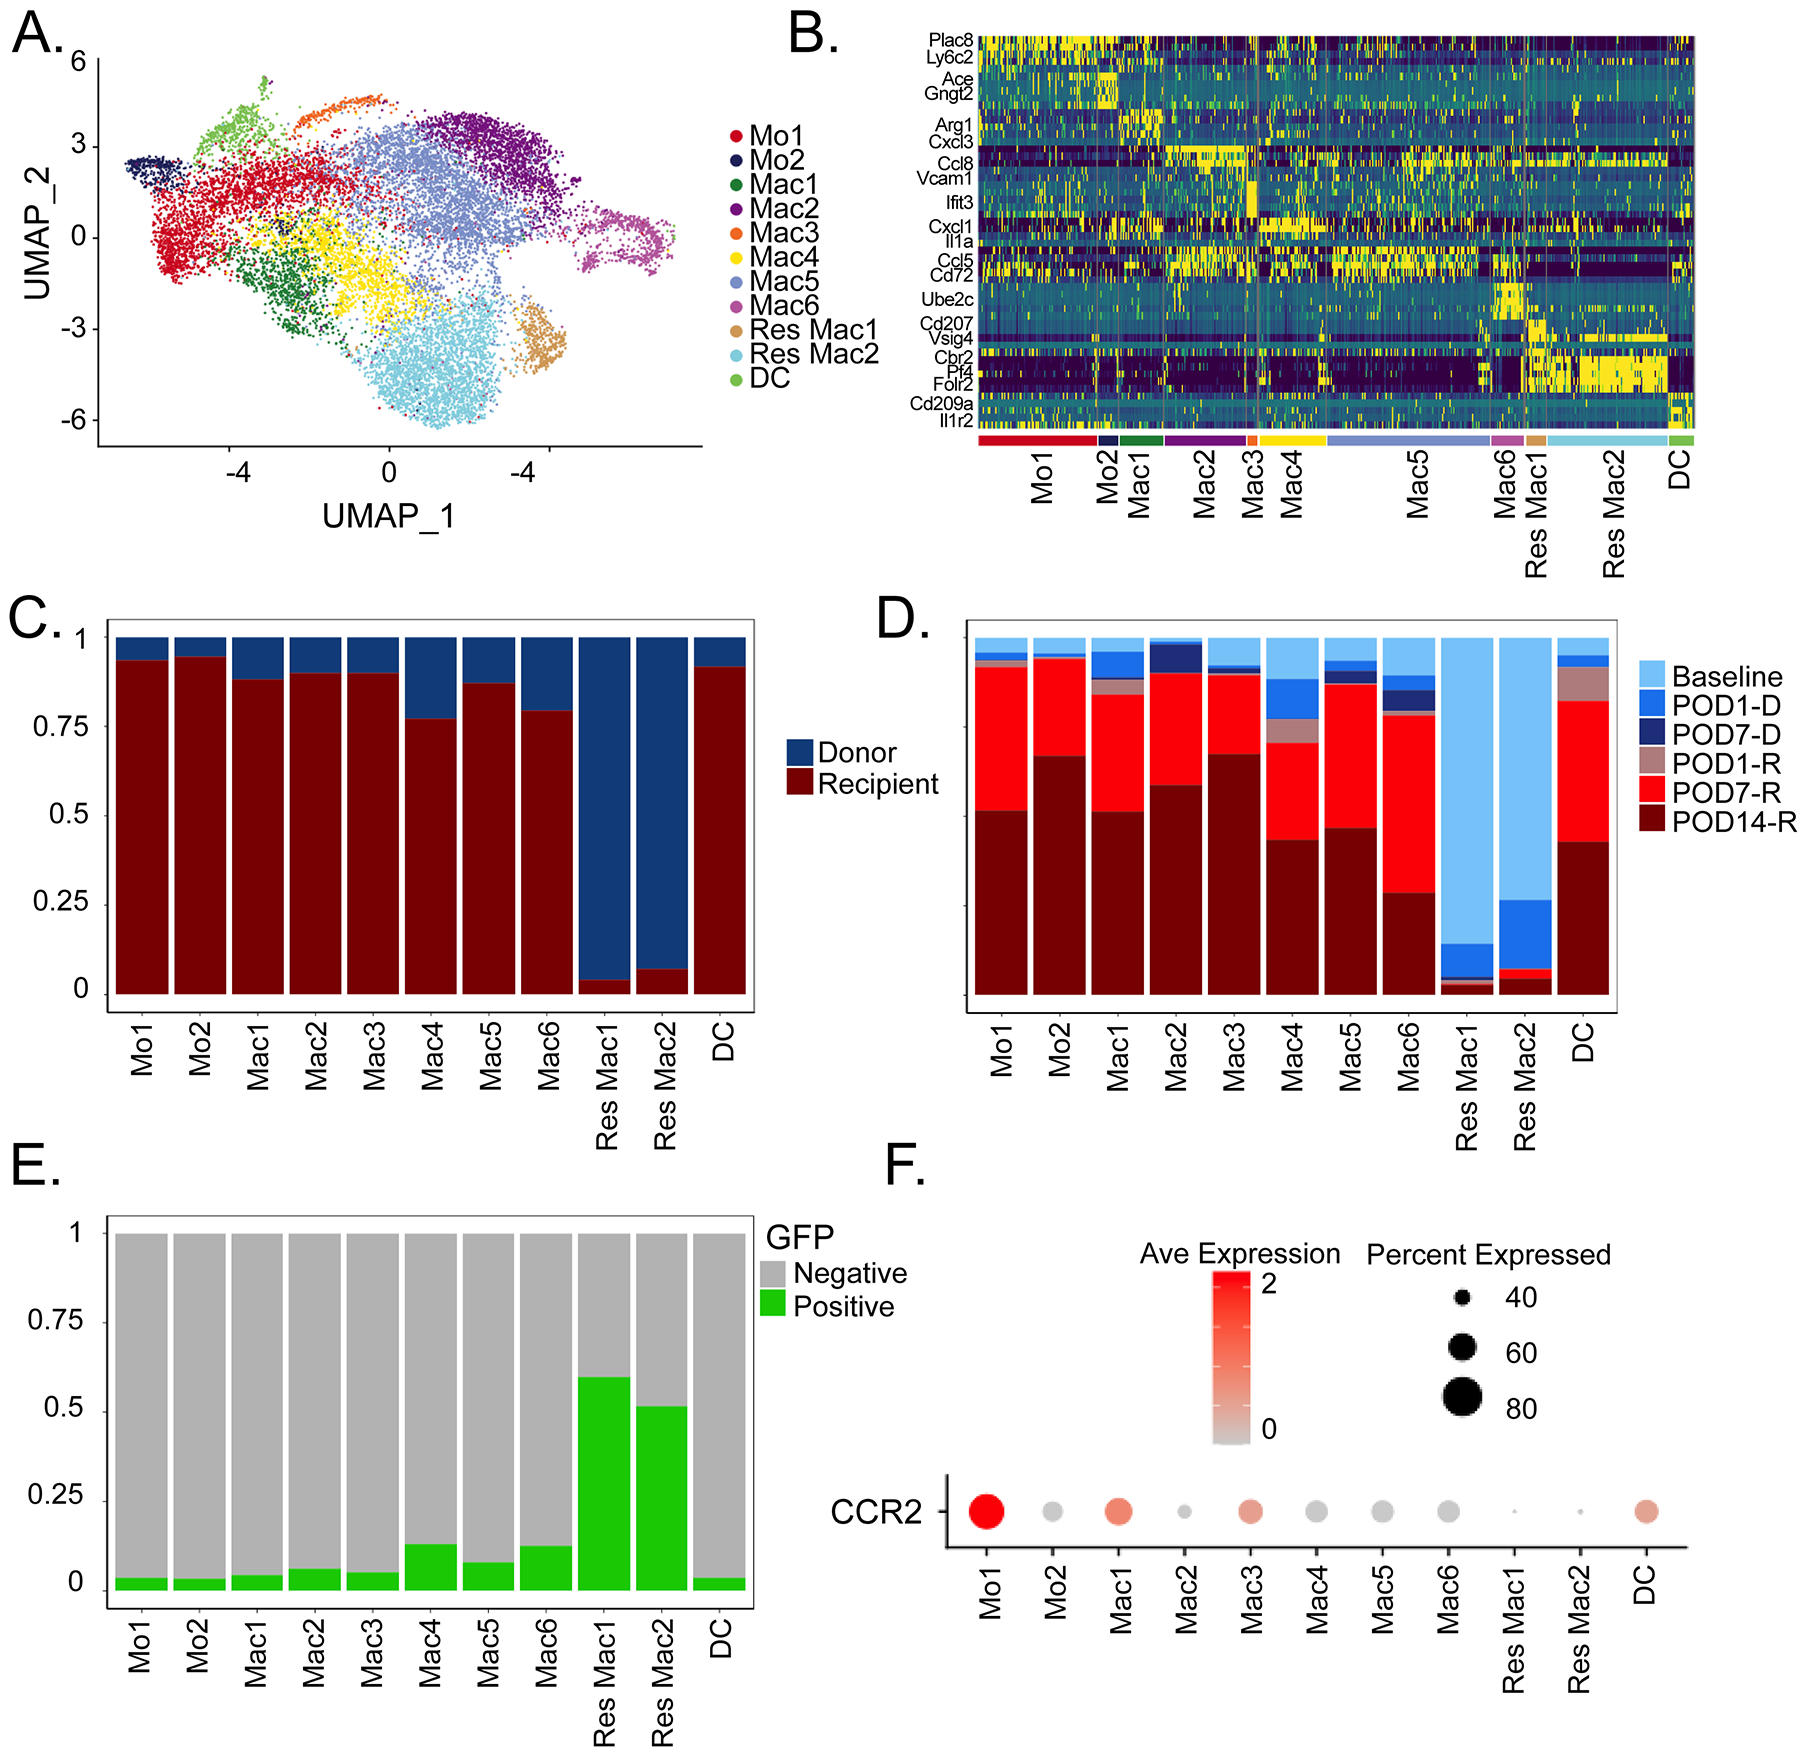
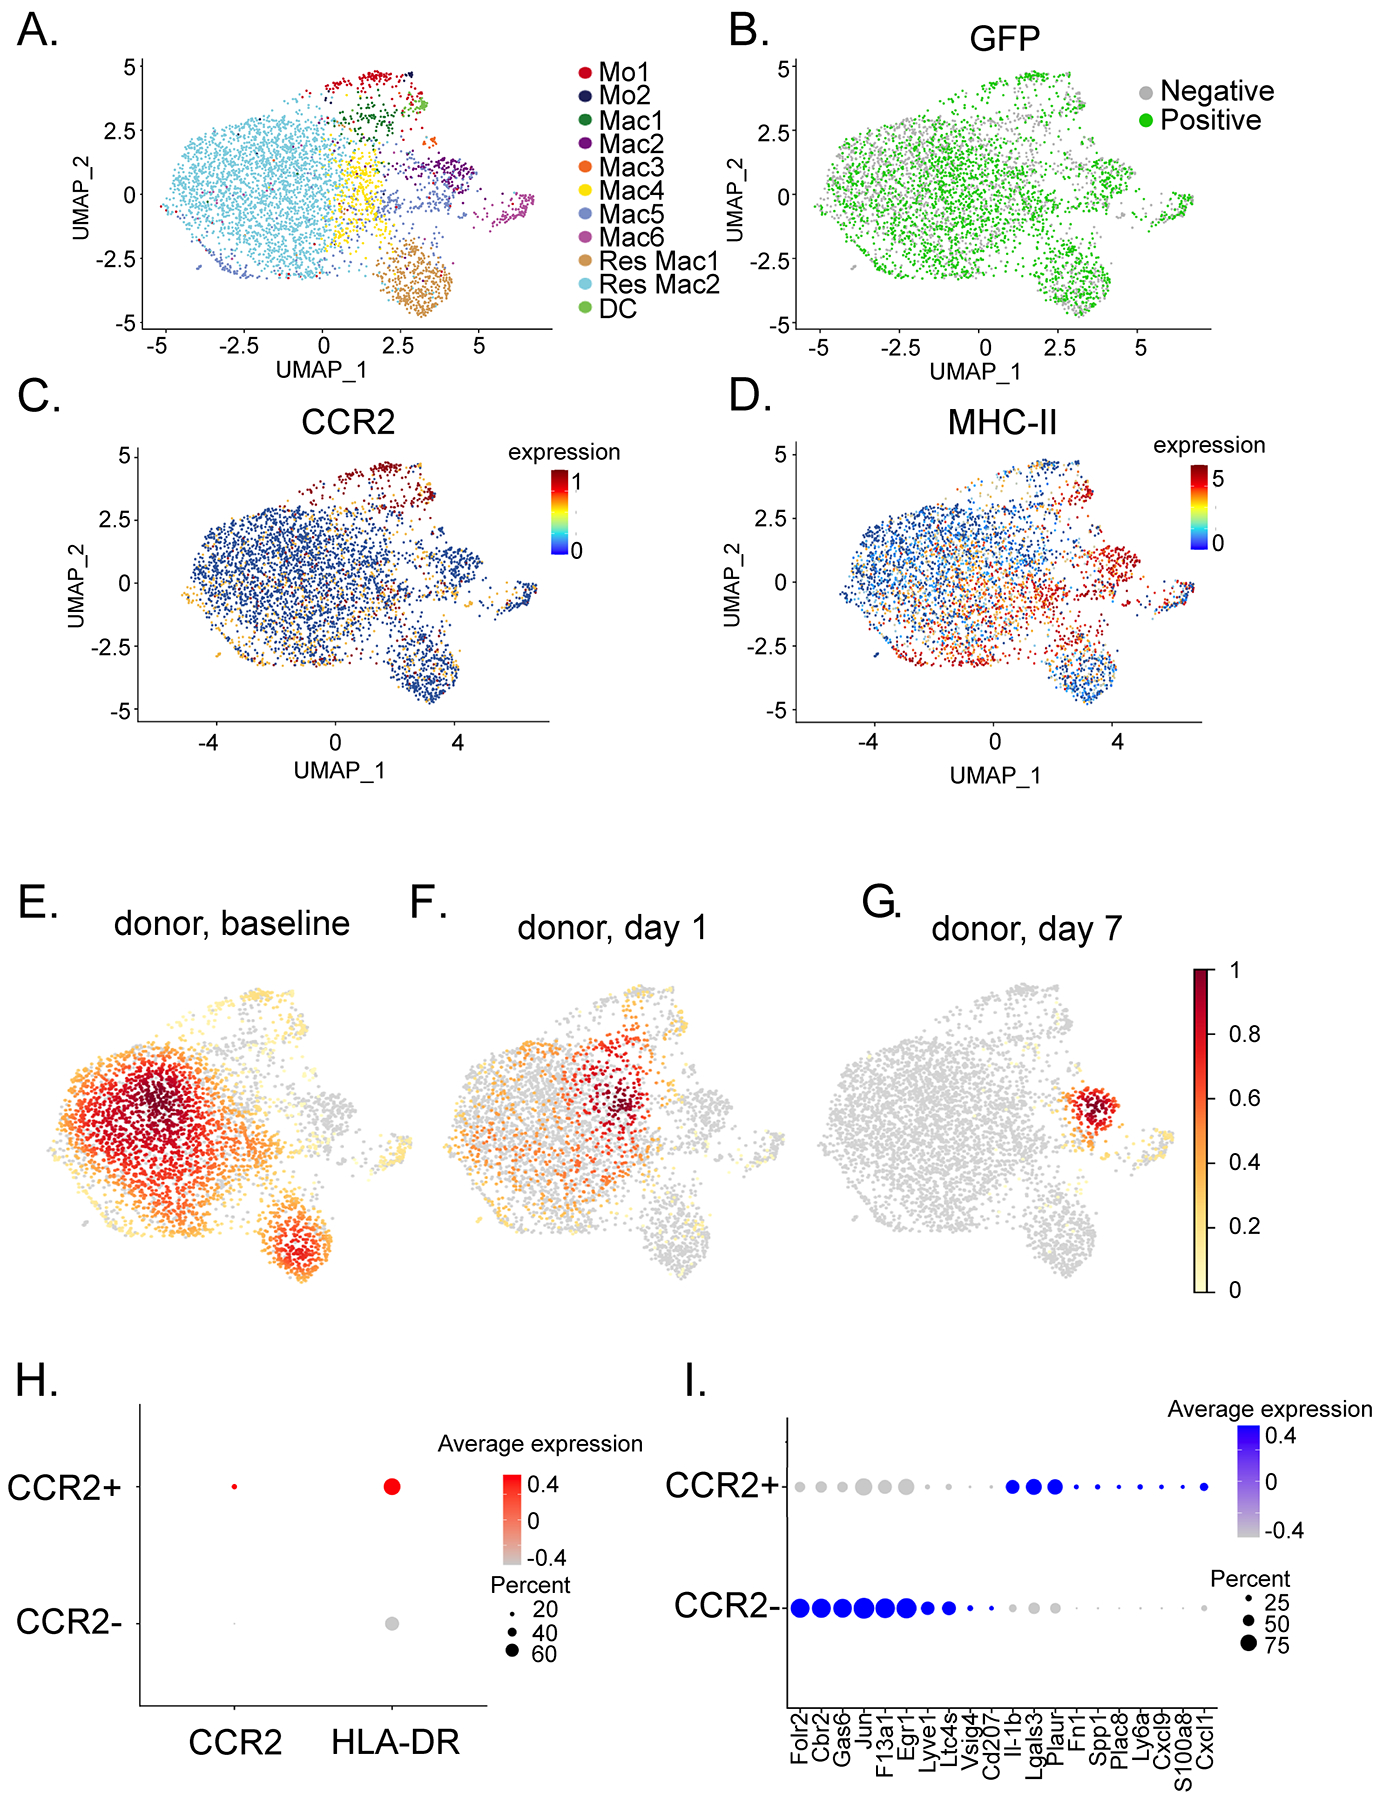
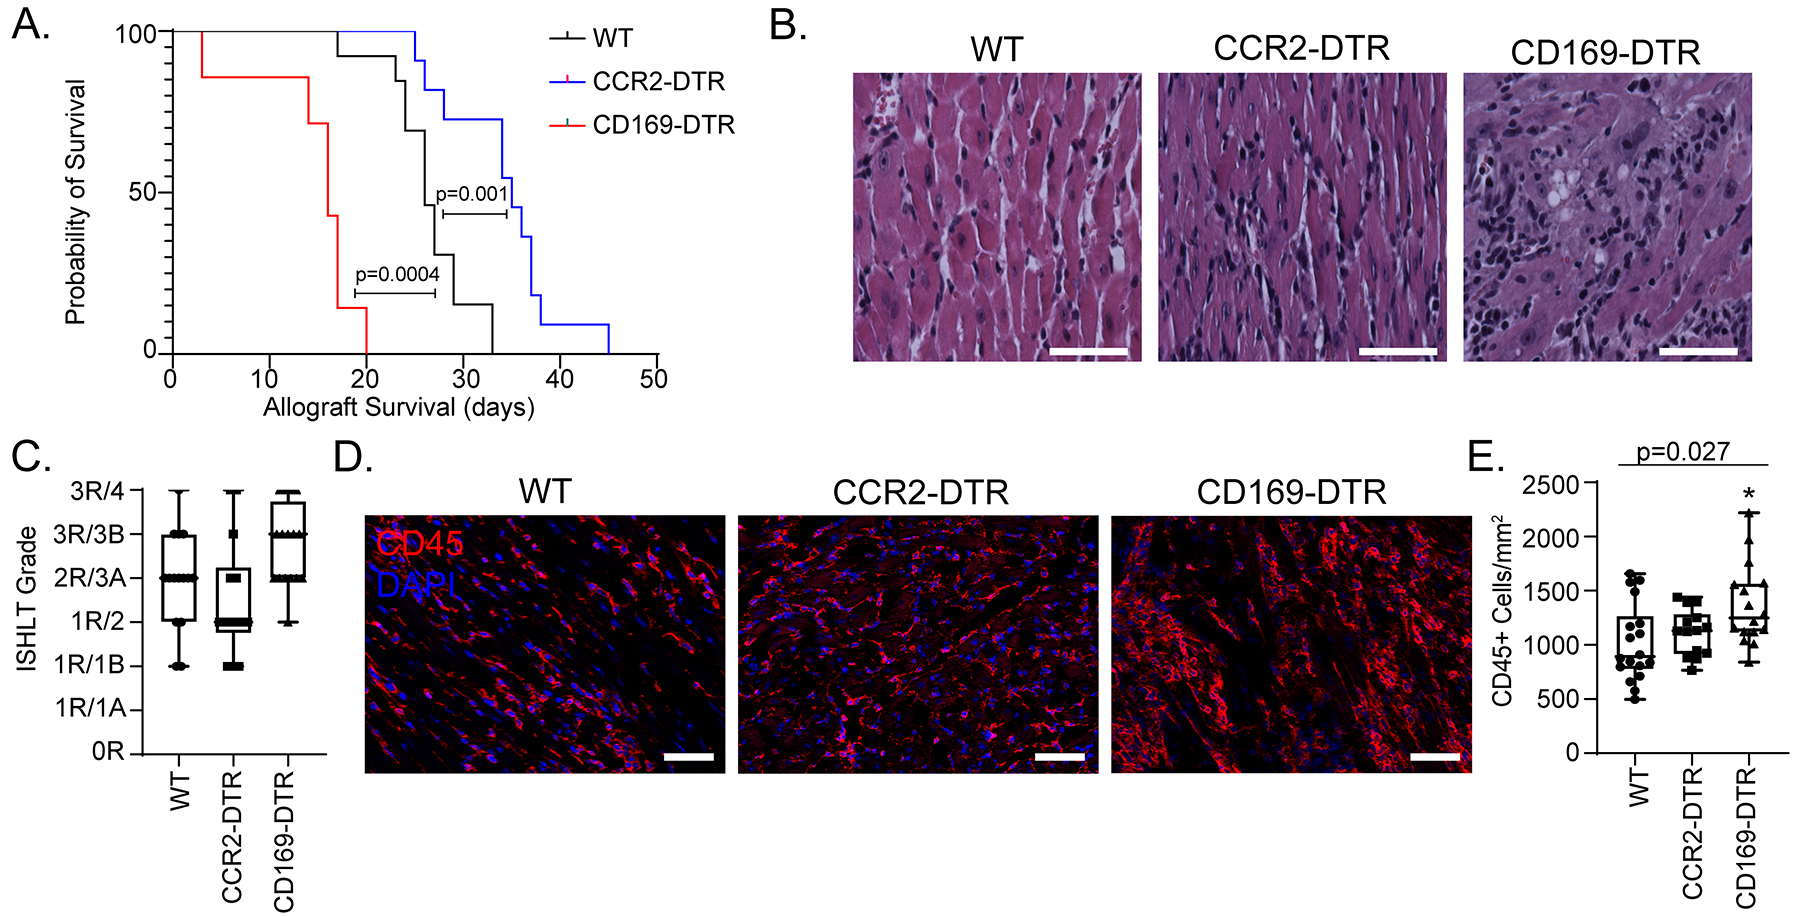
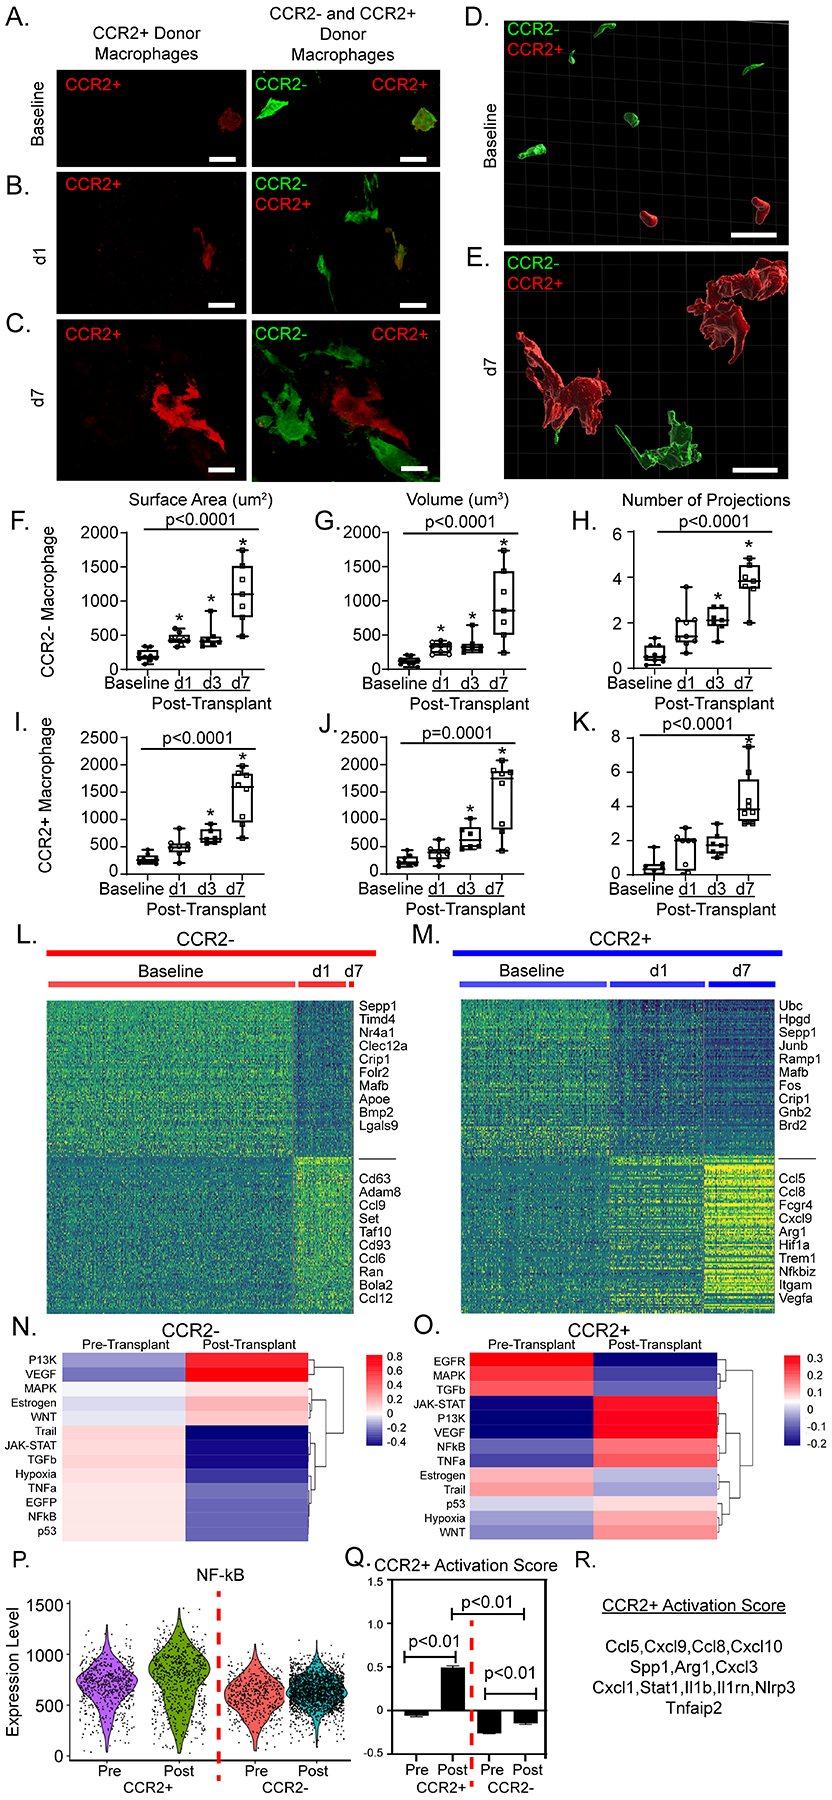
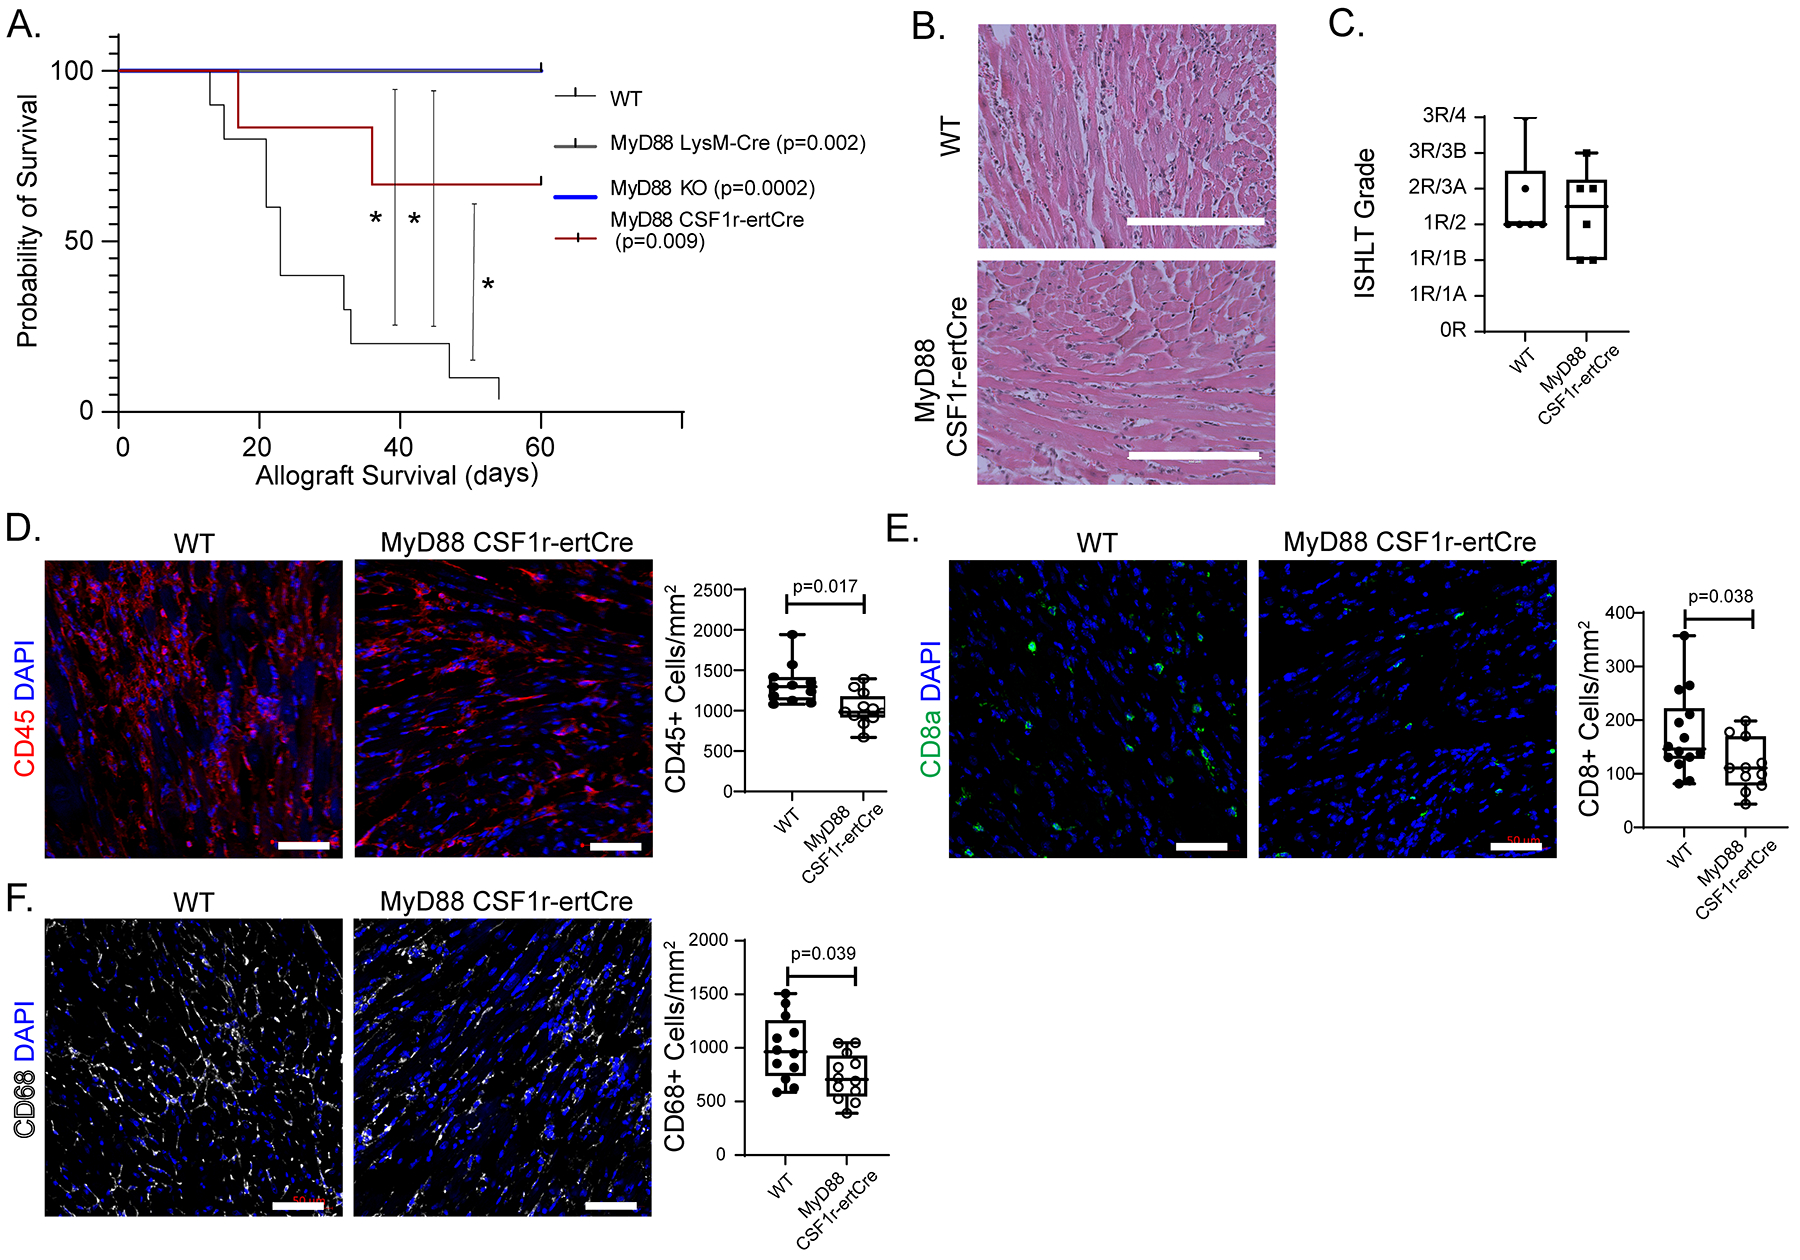
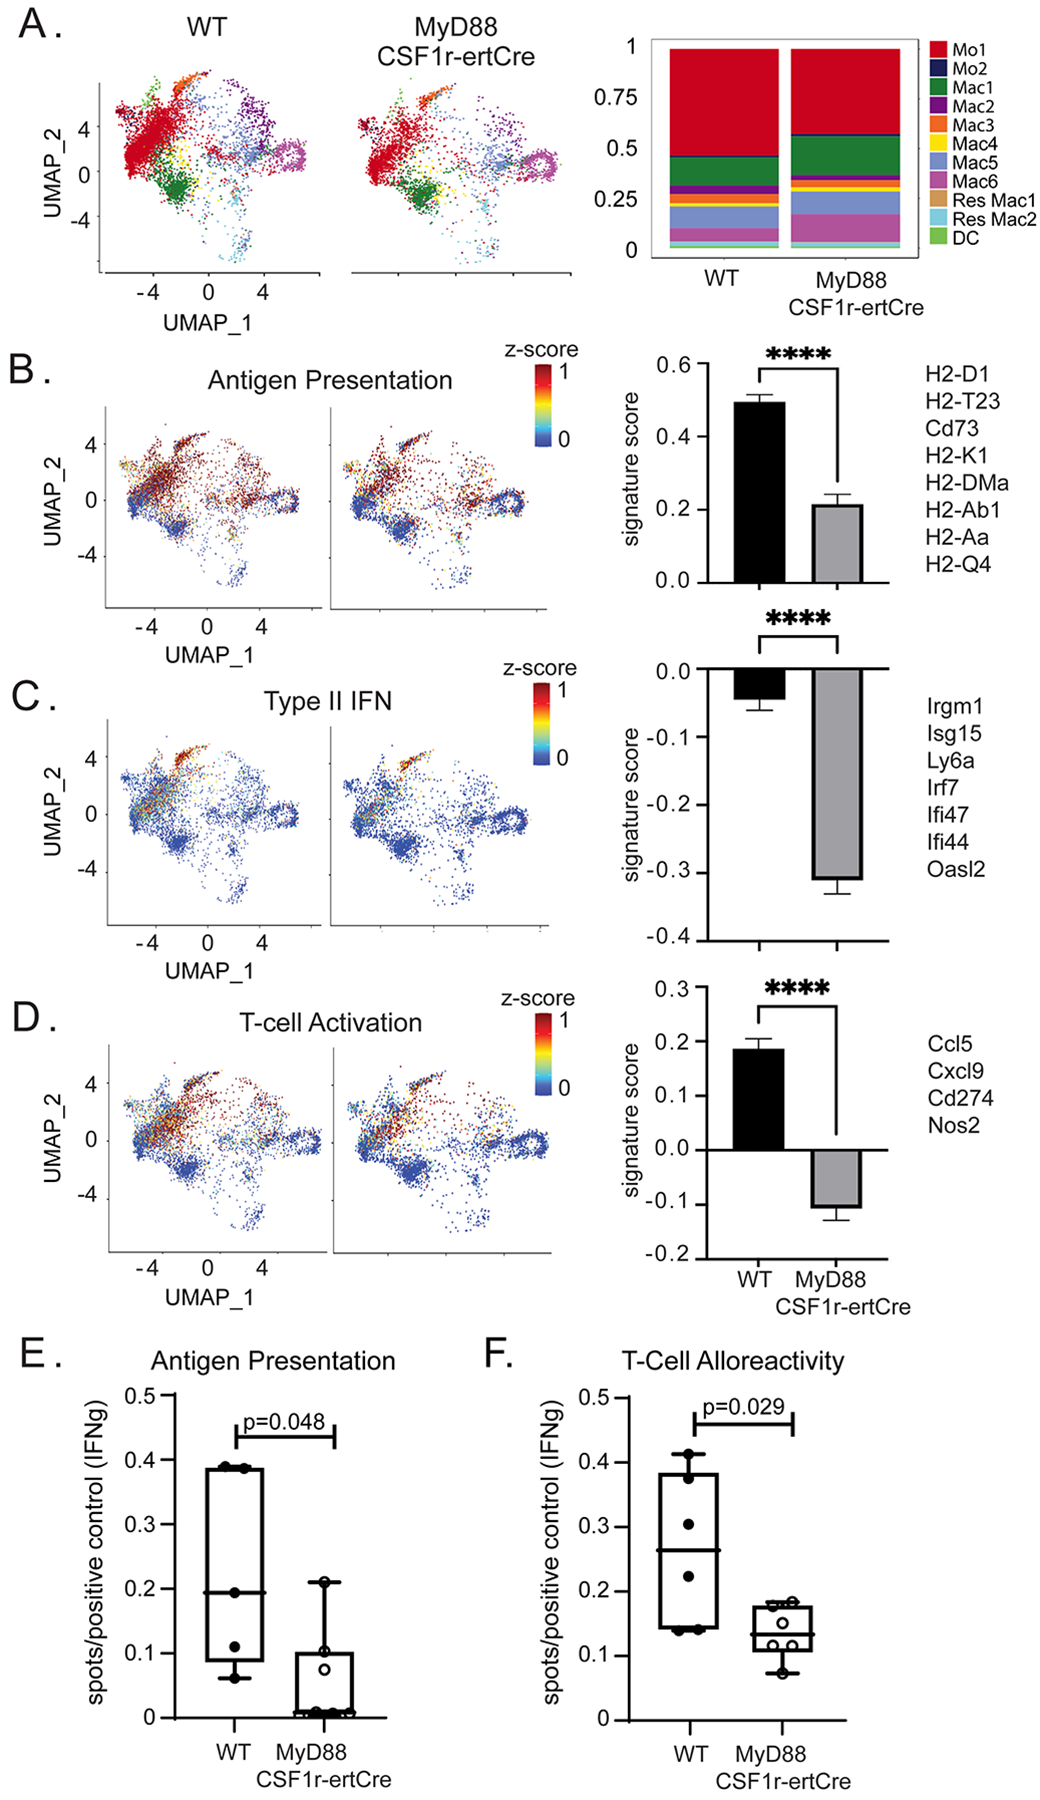
Results: Donor macrophages persisted in the rejecting transplanted heart and coexisted with recipient monocyte-derived macrophages. Single-cell RNA sequencing identified donor CCR2+ and CCR2- macrophage populations and revealed remarkable diversity among recipient monocytes, macrophages, and dendritic cells. Temporal analysis demonstrated that donor CCR2+ and CCR2- macrophages were transcriptionally distinct, underwent significant morphologic changes, and displayed unique activation signatures after transplantation. Although selective depletion of donor CCR2- macrophages reduced allograft survival, depletion of donor CCR2+ macrophages prolonged allograft survival. Pathway analysis revealed that donor CCR2+ macrophages are activated through MYD88/nuclear factor kappa light chain enhancer of activated B cells signaling. Deletion of MYD88 in donor macrophages resulted in reduced antigen-presenting cell recruitment, reduced ability of antigen-presenting cells to present antigen to T cells, decreased emergence of allograft-reactive T cells, and extended allograft survival.

Conclusions: Distinct populations of donor and recipient macrophages coexist within the transplanted heart. Donor CCR2+ macrophages are key mediators of allograft rejection, and deletion of MYD88 signaling in donor macrophages is sufficient to suppress rejection and extend allograft survival. This highlights the therapeutic potential of donor heart-based interventions.

Keywords: donor; heart; macrophages; sequence analysis, RNA; transplant.


Figures

Figure 1:
Figure 1:. Persistence of Donor Macrophages after Heart Transplantation.
A-D) At baseline, all macrophages co-express GFP and CD68. A subset of GFP+ CD68+ macrophages express RFP and are identified as donor CCR2+ macrophages. Donor CCR2 macrophages are identified as CD68+ GFP+ RFP. At post-transplant day 1 (d1), donor CCR2 and CCR2+ macrophages co-exist with recipient monocyte derived macrophages (CD68+ only). By post-transplant day 14 (d14), only rare donor macrophages are identified. B) Donor CCR2 macrophages significantly decrease over time from baseline to d14 (Kruskal-Wallis; p < 0.0003). Specifically, there is a decrease in donor CCR2 macrophages between baseline and post-transplant day 7 (d7, n = 7) (Dunn’s test for multiple comparisons; p = 0.0015) and baseline and d14 (Dunn’s test for multiple comparisons; p = 0.0014) (baseline n = 8, d1 = 7, d3 = 7, d 7 = 7, d14 = 3). C) There is a significant decrease of donor CCR2+ macrophages over time from baseline to d14 (Kruskal-Wallis; p = 0.0111) and specifically between baseline and d7 (Dunn’s test for multiple comparisons; p = 0.0197) and baseline and d14 (Dunn’s test for multiple comparisons; p = 0.0215) (baseline n = 8, d1 = 7, d3 = 7, d 7 = 7, d14 = 3). D) There is a significant increase in recipient CD68+ cells during the course of rejection (Kruskal-Wallis; p < 0.0001) and specifically between post-transplant day 1(d1) and d7 (Dunn’s test for multiple comparisons; p = 0.0134) and baseline and d14 (Dunn’s test for multiple comparisons; p = 0.0015) (d1 = 5, d3 = 5, d 7 = 5, d14 = 3). E) DAPI+ donor macrophages (GFP+) were considered to have undergone cell death. There was a significant increase in donor macrophages cell death after transplant (Kruskal-Wallis; p = 0.0010) and from baseline to d7 (Dunn’s test for multiple comparisons; p = 0.002) (baseline n = 6, d1 = 4, d 7 = 6, d14 = 10). Scale bar = 100 μm.
Figure 2:
Figure 2:. Donor and recipient immune cells are distinct.
A) Schematic of single cell RNA sequencing workflow. B) Post-transplant day 1 gating scheme. Donor macrophages and monocytes are CD45+ CD11b+ Ly6c+ CD64+ GFP+ whereas recipient macrophages and monocytes are CD45+ CD11b+ Ly6c+ CD64+ GFP. UMAP embedding plot of aggregated dataset split by C) donor and recipient, D) donor and recipient split by different timepoints, and E) GFP expression showing donor vs recipient demarcation, confirming robustness of FACS gating strategy. Heatmaps of normalized counts for differentially expressed marker genes between F) donor versus recipient and G) unique markers enriched in donor and recipients at different time points. Gene-Concept Network Plot for upregulated pathways with key genes annotated in H) donors and I) recipients using statistically significant genes (adjusted p-value < 0.05, Bonferroni correction) from differential gene testing.
Figure 3:
Figure 3:. Macrophage diversity in integrated recipient and donor hearts post heart transplantation.
A) UMAP embedding plot of Harmony integrated donor and recipient libraries colored by transcriptionally distinct cell states. B) Heatmap of top 5 differentially expressed genes across populations using statistically significant genes (adjusted p-value < 0.05, Bonferroni correction), with representative genes shown. C) Relative donor and recipient contribution to cell states in (A). D) Cell composition of donor/recipient cells at different time points among the different myeloid cell states. E) Percent GFP positive cells in myeloid cell states from (A). (F) DotPlot of CCR2 expression in different cell states.
Figure 4:
Figure 4:. Donor macrophages change their transcriptional state and are diminished post-transplantation.
UMAP embedding plot of A) donor macrophages annotated by integrated object annotation B) GFP (51.7% positive) positive cells, C) Ccr2 and D) H2-Aa expression in donor myeloid cells. Gaussian kernel density embedding plots showing density of E) baseline, F) post-transplant day 1, and G) post-transplant day 7 donor myeloid cells in the UMAP space. H) DotPlot of CCR2 and HLA-DR expression in CCR2 (Res Mac1, Res Mac2, Mac2) and CCR2+ (Mo1, Mo2, Mac1, Mac3-6, DC) populations. I) Top differentially expressed genes between donor CCR2+ and CCR2 macrophages using statistically significant genes (adjusted p-value < 0.05, Bonferroni correction).
Figure 5:
Figure 5:. Donor macrophages differentially mediate allograft survival.
A) Kaplan-Meier survival curve of CD169DTR/+ (n = 7) vs CCR2DTR/+ (n = 11) vs littermate controls (n = 13) (Log-rank). B) H & E stain on transplanted hearts collected at post-transplant day 10. C) At least 3 random regions were evaluated by a trained cardiac pathologist and scored based on the 1990/2004 ISHLT cellular rejection grading guidelines (n=16 hearts for each cohort). D) Post-transplant day 10 hearts were stained with CD45 (red) and DAPI (blue). E) Number of CD45+ cell/mm2 heart was quantified. There was a significant difference among the three groups (Kruskal-Wallis; p = 0.027) and between WT and CD169DTR/+ (Dunn’s test for multiple comparisons; p=0.014). There was no difference noted between WT and CCR2DTR/+ (Dunn’s test for multiple comparisons; p = 0.58). n=16 for each cohort. Scale bar = 50 μm.
Figure 6:
Figure 6:. Donor macrophages dynamically respond after heart transplantation.
40X magnification z-stacks were obtained of dual reporter mice at A) baseline, B) post-transplant day 1 (d1), and C) post-transplant day 7 (d7). 30 μm thick sections were reconstructed with Imaris software to obtain volumetric reconstructions of donor macrophages at D) baseline and E) at d7. From reconstructions, quantitative measurements of donor CCR2 macrophages F) surface area (μm2), G) volume (μm3) and H) number of projections were obtained. For each timepoint, each data point represents the average of 10–20 macrophages from at least two regions of interest in at least two separate sections per heart. Identical measurements were performed in donor CCR2+ macrophages (I-K) across time. Statistical analyses were computed with Kruskal-Wallis (noted p-value) and Dunn’s test for multiple comparisons (* when < 0.05 compared to baseline) (baseline n = 10, d1 = 9, d3 = 7, d7 = 8). Heatmaps of normalized counts for differentially expressed marker genes between baseline and post-transplant for L) donor CCR2 macrophages and M) donor CCR2+ macrophages. PROGENy pathway analysis at basleine and post-transplant in N) CCR2 and O) CCR2+ macrophages. P) PROGENy derived NF-қB pathway enrichment score violin plot across 4 CCR2 and CCR2+ macrophages at baseline and post-transplant. Q) Gene set score for CCR2+ macrophage activation post-transplant shown in CCR2+ and CCR2 macrophages pre- and post-transplant (p < 0.01). Gene set score p-values calculated with 2-way ANOVA with multiple comparisons. R) Genes used to calculate gene set score. Scale bar = 10 μm.
Figure 7:
Figure 7:. Donor macrophages signal through MyD88.
A) Kaplan-Meier survival curve with control (n = 10) versus MyD88f/f LysMCre/+ (Log-rank; p = 0.002, n = 4), MyD88f/f CSF1rertCre/+ (Log-rank; p = 0.009, n = 6), or MyD88−/− (“KO” Log-rank; p = 0.0002; n = 8) donor allografts (censored at 60 days). B) H & E staining of WT and MyD88f/f CSF1rertCre/+ allografts collected at post-transplant day 10. C) ISHLT cellular rejection scores comparing WT (n=12) and MyD88f/f CSF1rertCre/+ (n=12) hearts. D) CD45+ immunofluorescent staining of WT (n=12) and MyD88f/f CSF1rertCre/+ (n=12) hearts with quantification showing significant reduction in CD45+ cells/mm2 in MyD88f/f CSF1rertCre/+ hearts (1022 cells vs 1328 cells/mm2; Mann-Whitney U Test; p = 0.0017,) compared to littermate control. E) CD8a+ immunofluorescent staining of WT (n=14) and MyD88f/f CSF1rertCre/+ (n=11) hearts with quantification showing significant reduction in CD8a+ cells/mm2 in MyD88f/f CSF1rertCre/+ hearts (110 cells vs 146 cells/mm2; Mann-Whitney U Test; p = 0.038) compared to littermate control. F) CD68+ immunofluorescent staining of WT (n=12) and MyD88f/f CSF1rertCre/+ (n=12) hearts with quantification showing significant reduction in CD68+ cells/mm2 in MyD88f/f CSF1rertCre/+ hearts (705 cells vs 964 cells/mm2; Mann-Whitney U Test; p = 0.039,) compared to littermate control. Scale bar: B= 200 μm; D=50 μm.
Figure 8:
Figure 8:. Donor MyD88 depletion leads to modulation of recipient immune cell gene expression.
UMAP embedding plot of A) post-transplant day 3 WT and post-transplant day 3 MyD88f/f CSF1rertCre/+ mapped onto integrated donor/recipient UMAP (left). Composition plot showing frequency of each population (right) in WT and MyDf/f CSF1rertCre/+. Combined z-scores for top genes and calculated gene set scores for B) antigen presentation (0.569 vs 0.211, p<0.0001), C) interferon signaling (−0.0032 vs −0.324, p<0.0001), and D) T-cell activation (0.1744 vs −0.1803 p< 0.0001) gene set scores with genes on the right. Statistical test Mann-Whitney U Test. E) Number of IFN-γ spots per conA positive control of DO.11 T-cells co-cultured with OVA-loaded post-transplant days 3–4 macrophages and monocytes (Antigen presentation assay) with a significant reduction in MyD88f/f CSF1rertCre/+ cohort (0.0084 vs 0.19 spots/conA treated T-cell control; Mann-Whitney U Test; p = 0.048; n = 5 WT, n = 6 MyD88f/f CSF1rertCre/+). F) Number of IFN-γ spots per conA positive control of recipient T-cells co-cultured with irradiated donor antigen (T-cell alloreactivity assay) with a significant reduction in MyD88f/f CSF1rertCre/+ cohort (0.13 vs 0.26 spots/conA treated T-cell control; Mann-Whitney U Test; p = 0.029; n = 6 each group).

Comment in

Similar articles

Cited by

References

    1. Colvin M, Smith JM, Hadley N, Skeans MA, Carrico R, Uccellini K, Lehman R, Robinson A, Israni AK, Snyder JJ, et al. OPTN/SRTR 2016 Annual Data Report: Heart. Am J Transplant. 2018;18 Suppl 1:291–362. - PubMed
    1. Moayedi Y, Fan CPS, Cherikh WS, Stehlik J, Teuteberg JJ, Ross HJ and Khush KK. Survival Outcomes After Heart Transplantation: Does Recipient Sex Matter? Circ Heart Fail. 2019;12:e006218. - PubMed
    1. Chang DH, Kittleson MM and Kobashigawa JA. Immunosuppression following heart transplantation: prospects and challenges. Immunotherapy. 2014;6:181–94. - PubMed
    1. Alba AC, bain e, ng n, stein m, o’brien k, fortoutan f and ross h. Complications after Heart Transplantation: Hope for the Best, but Prepare for the Worst. International Journal of Transplantation Research and Medicine. 2016;2.
    1. McDonald-Hyman C, Turka LA and Blazar BR. Advances and challenges in immunotherapy for solid organ and hematopoietic stem cell transplantation. Sci Transl Med. 2015;7:280rv2. - PMC - PubMed

Publication types

Substances