. 2022 Nov 28;190(4):2828-2846.
doi: 10.1093/plphys/kiac344.

Transcript and metabolite network perturbations in lignin biosynthetic mutants of Arabidopsis

Affiliations

Transcript and metabolite network perturbations in lignin biosynthetic mutants of Arabidopsis

Peng Wang et al. Plant Physiol. .

Abstract

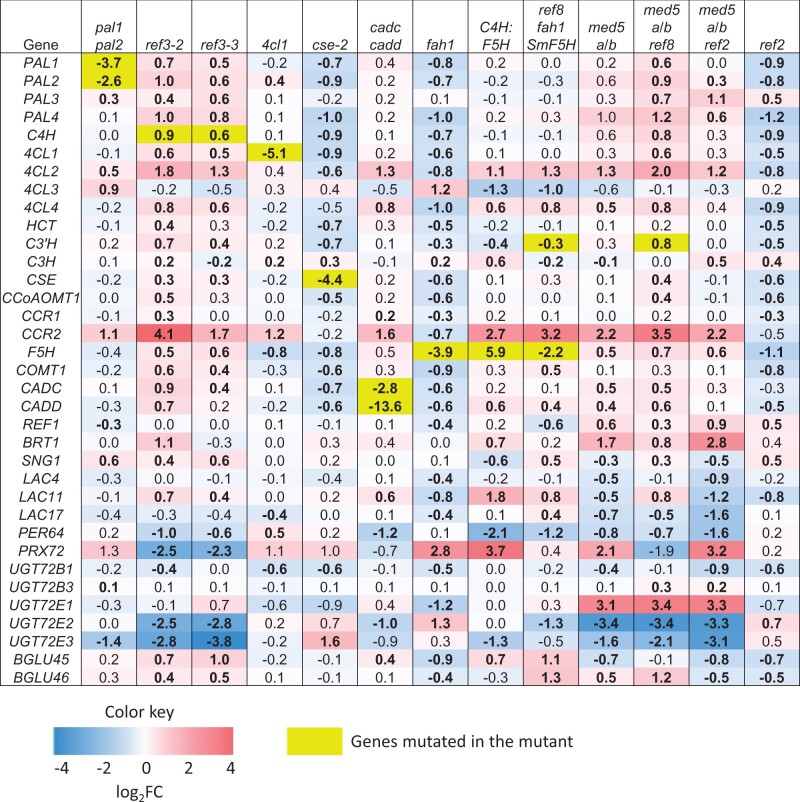
Lignin, one of the most abundant polymers in plants, is derived from the phenylpropanoid pathway, which also gives rise to an array of metabolites that are essential for plant fitness. Genetic engineering of lignification can cause drastic changes in transcription and metabolite accumulation with or without an accompanying development phenotype. To understand the impact of lignin perturbation, we analyzed transcriptome and metabolite data from the rapidly lignifying stem tissue in 13 selected phenylpropanoid mutants and wild-type Arabidopsis (Arabidopsis thaliana). Our dataset contains 20,974 expressed genes, of which over 26% had altered transcript levels in at least one mutant, and 18 targeted metabolites, all of which displayed altered accumulation in at least one mutant. We found that lignin biosynthesis and phenylalanine supply via the shikimate pathway are tightly co-regulated at the transcriptional level. The hierarchical clustering analysis of differentially expressed genes (DEGs) grouped the 13 mutants into 5 subgroups with similar profiles of mis-regulated genes. Functional analysis of the DEGs in these mutants and correlation between gene expression and metabolite accumulation revealed system-wide effects on transcripts involved in multiple biological processes.


Figures

Figure 1
Figure 1
Growth phenotype of 28-day-old wild-type Arabidopsis and plants with perturbed lignification.
Figure 2
Figure 2
PCA analysis of expressed genes in RNA-seq data from individual samples of wild-type and the perturbed plants. The values were determined with log transformed transcript counts. The first two principal components were plotted here. Percentage on x- and y-axes showed the variance explained by PC1 and PC2, respectively.
Figure 3
Figure 3
Expression of lignin biosynthetic genes in the RNA-seq data. Values are log2FC of expression in mutant compared to wild-type. Bold indicates the value is significant (P-value cutoff of 0.05).
Figure 4
Figure 4
Hierarchical clustering analysis of the shikimate and lignin pathway genes from 13 mutants compared with wild-type. Log2FC values for 47 genes were used to generate the heat map and ward.D2 method was used for clustering both the genes and the mutants.
Figure 5
Figure 5
Expression of genes involved in regulating phenylpropanoid metabolism in the RNA-seq data. Values are log2FC of expression in mutant compared to wild-type. Bold indicates the value is significant (P-value cutoff of 0.05). Yellow background indicates genes mutated in the line.
Figure 6
Figure 6
Pearson’s correlation (r) of gene expression profiles. Values were obtained based on log2FC of 5,581 genes that were up or downregulated more than two-fold in at least one mutant. Size of circle represents the absolute values of r and color code represents the value of r indicated as the scale on the right. Blank wells mean that the correlation is not significant based on P-value cutoff of 0.01.
Figure 7
Figure 7
Hierarchical clustering analysis of substantial DEGs from 13 mutants compared with wild-type. Log2FC values for 5,581 DEGs with at least two-fold changes in at least one mutant were used to generate the heat map and ward.D2 method was used for clustering. GO terms of BPs for 16 clusters are shown on the right. Black color indicates statistically significant (FDR < 0.01) and gray color indicates FDR between 0.01 and 0.1.
Figure 8
Figure 8
Hierarchical clustering of Pearson correlation analysis between metabolite accumulation and gene expression in all genotypes. Out of 20,974 expressed genes, 2,987 genes have significant correlation (|r| ≥ 0.7, P < 0.05) with at least one metabolite. The rows and columns of the heap map are clusters of genes and metabolites, respectively, generated using ward.D2 method. GO terms of BPs and cellular compartments (FDR < 0.01) for six clusters are shown on the right.

Similar articles

Cited by

References

    1. Anders S, Pyl PT, Huber W (2015a) HTSeq–a Python framework to work with high-throughput sequencing data. Bioinformatics 31: 166–169 - PMC - PubMed
    1. Anderson NA, Bonawitz ND, Nyffeler K, Chapple C (2015b) Loss of FERULATE 5-HYDROXYLASE leads to Mediator-dependent inhibition of soluble phenylpropanoid biosynthesis in Arabidopsis. Plant Physiol 169: 1557–1567 - PMC - PubMed
    1. Anderson NA, Tobimatsu Y, Ciesielski PN, Ximenes E, Ralph J, Donohoe BS, Ladisch M, Chapple C (2015c) Manipulation of guaiacyl and syringyl monomer biosynthesis in an Arabidopsis cinnamyl alcohol dehydrogenase mutant results in atypical lignin biosynthesis and modified cell wall structure. Plant Cell 27: 2195–2209 - PMC - PubMed
    1. Baldacci-Cresp F, Le Roy J, Huss B, Lion C, Créach A, Spriet C, Duponchel L, Biot C, Baucher M, Hawkins S, et al (2020) UDP-GLYCOSYLTRANSFERASE 72E3 plays a role in lignification of secondary cell walls in Arabidopsis. Int J Mol Sci 21:6094. - PMC - PubMed
    1. Barros J, Escamilla-Trevino L, Song L, Rao X, Serrani-Yarce JC, Palacios MD, Engle N, Choudhury FK, Tschaplinski TJ, Venables BJ, et al (2019) 4-Coumarate 3-hydroxylase in the lignin biosynthesis pathway is a cytosolic ascorbate peroxidase. Nat Commun 10: 1994. - PMC - PubMed

Publication types

MeSH terms