

Elucidating Mechanisms of Tolerance to Salmonella Typhimurium across Long-Term Infections Using the Collaborative Cross
- PMID: 35880881
- PMCID: PMC9426527
- DOI: 10.1128/mbio.01120-22
Elucidating Mechanisms of Tolerance to Salmonella Typhimurium across Long-Term Infections Using the Collaborative Cross
Abstract
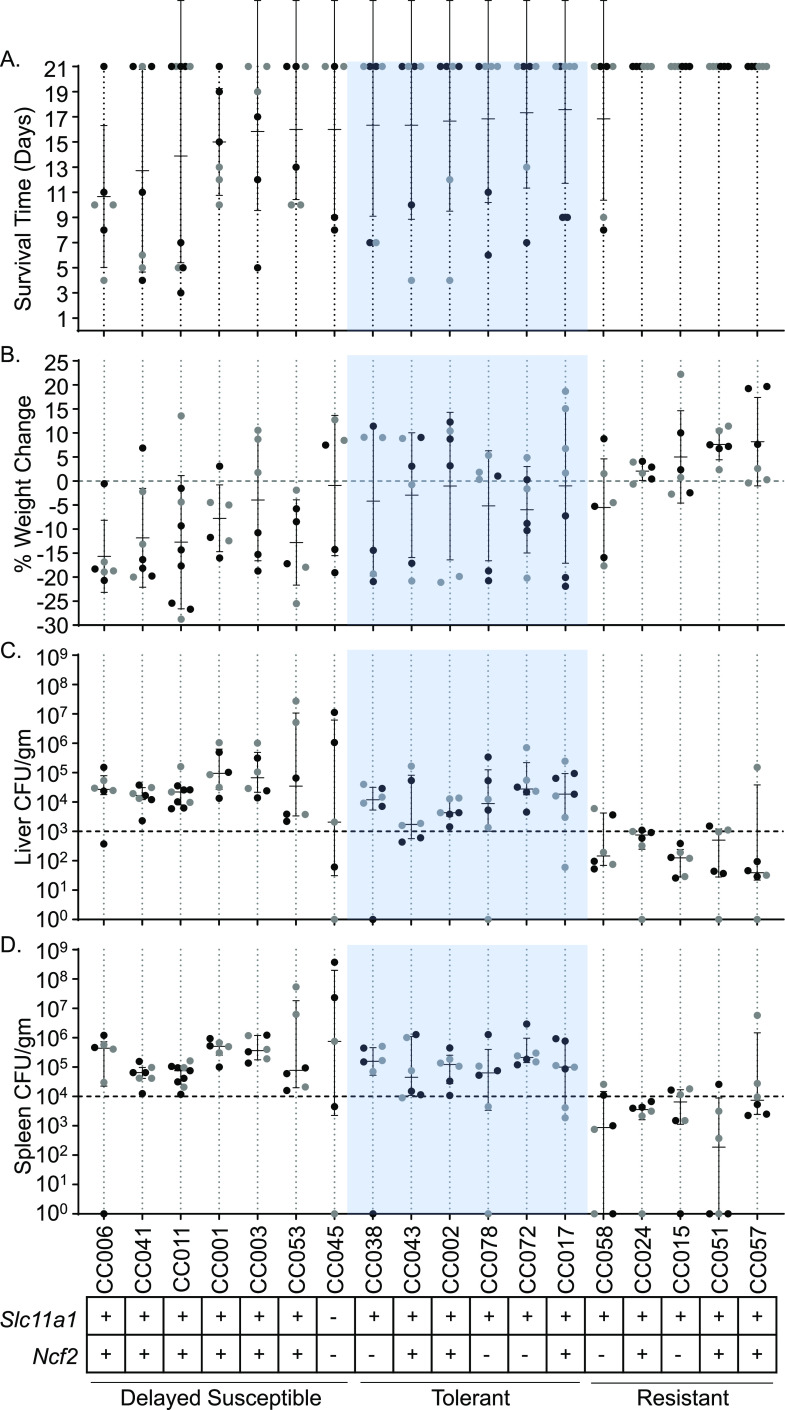
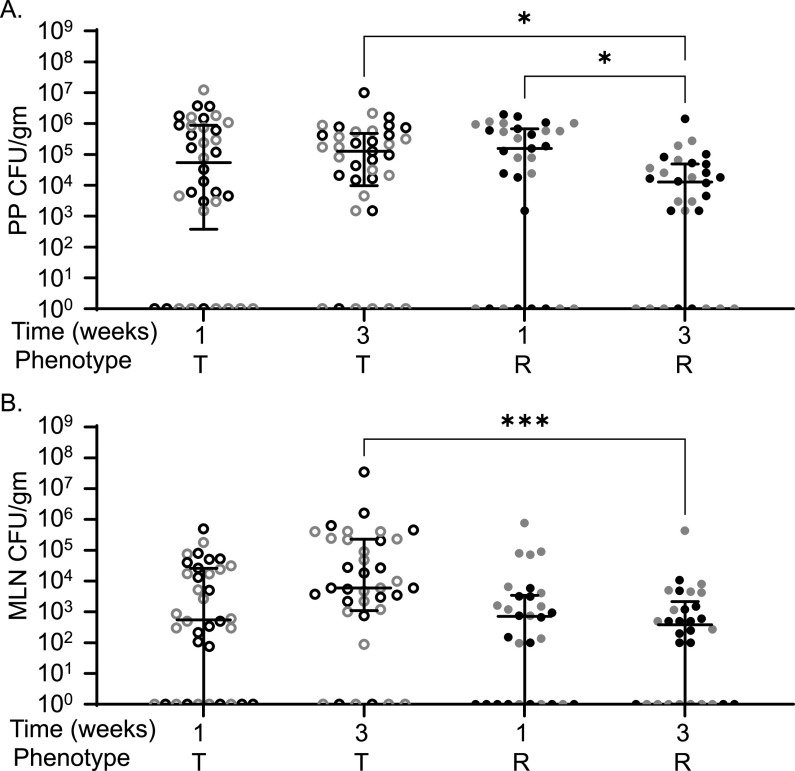
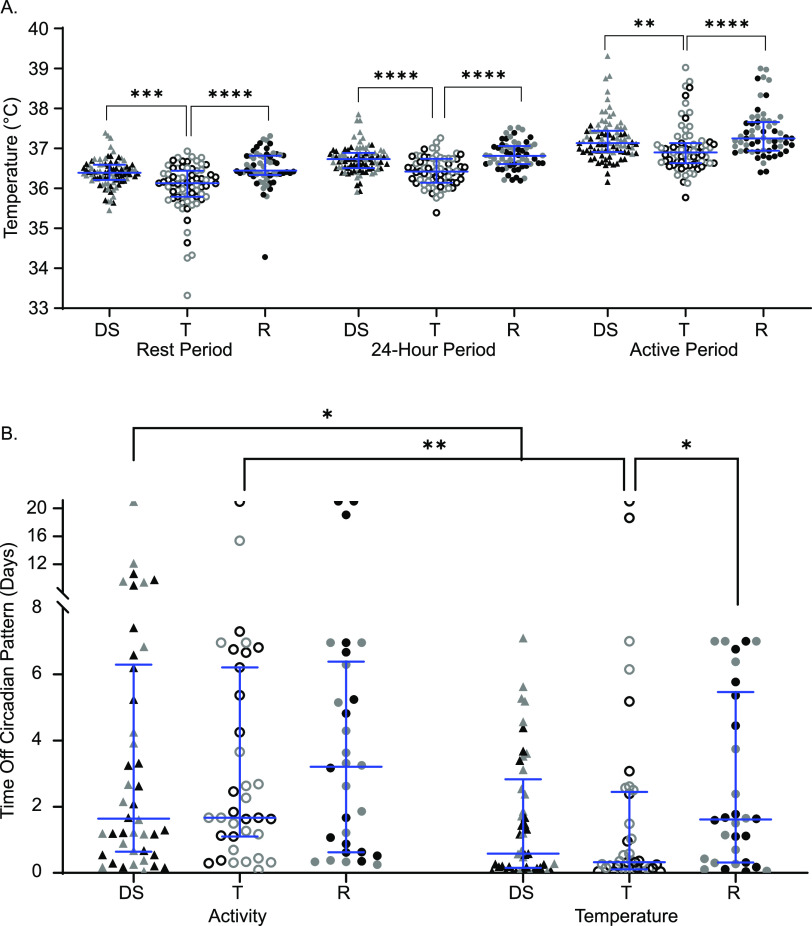
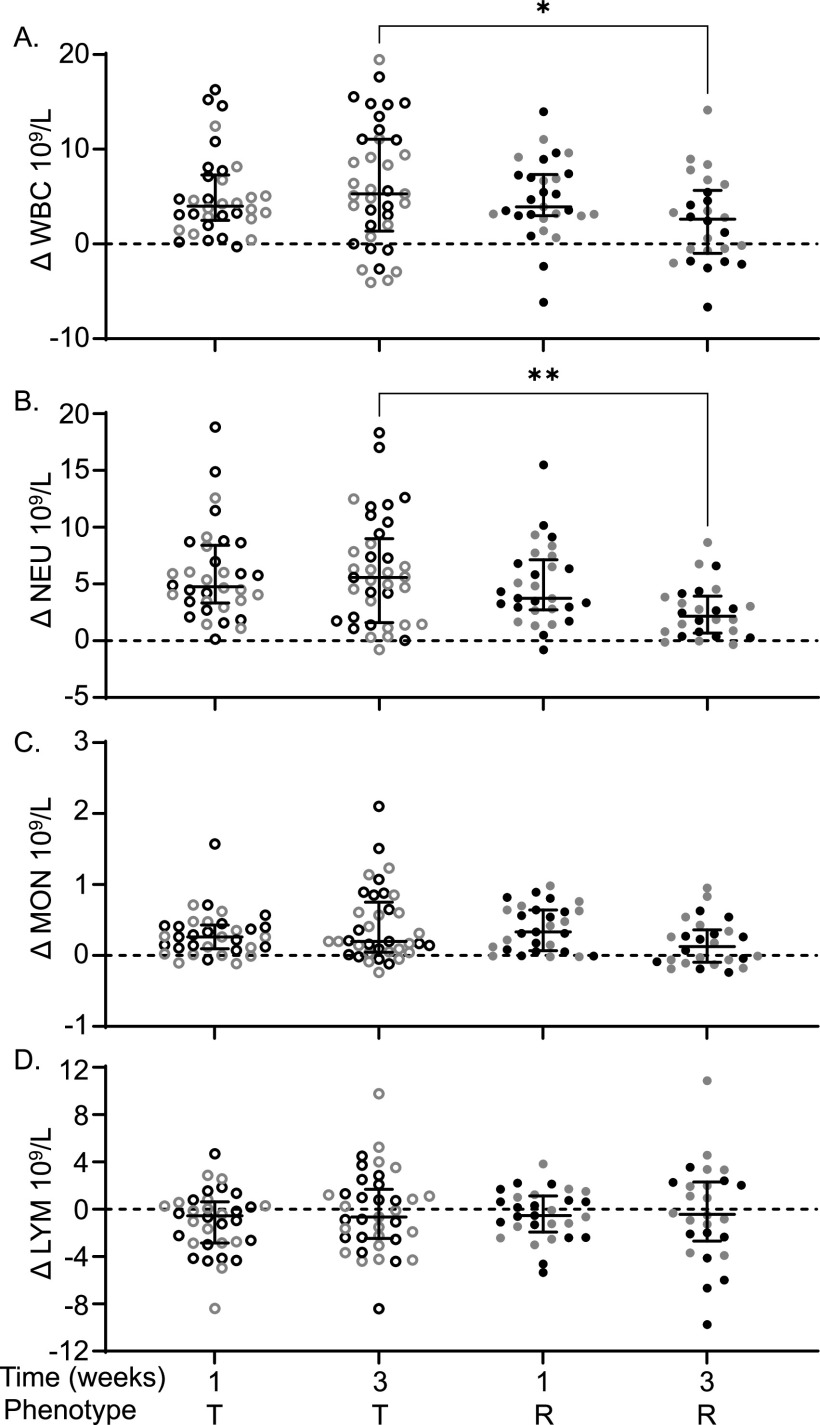
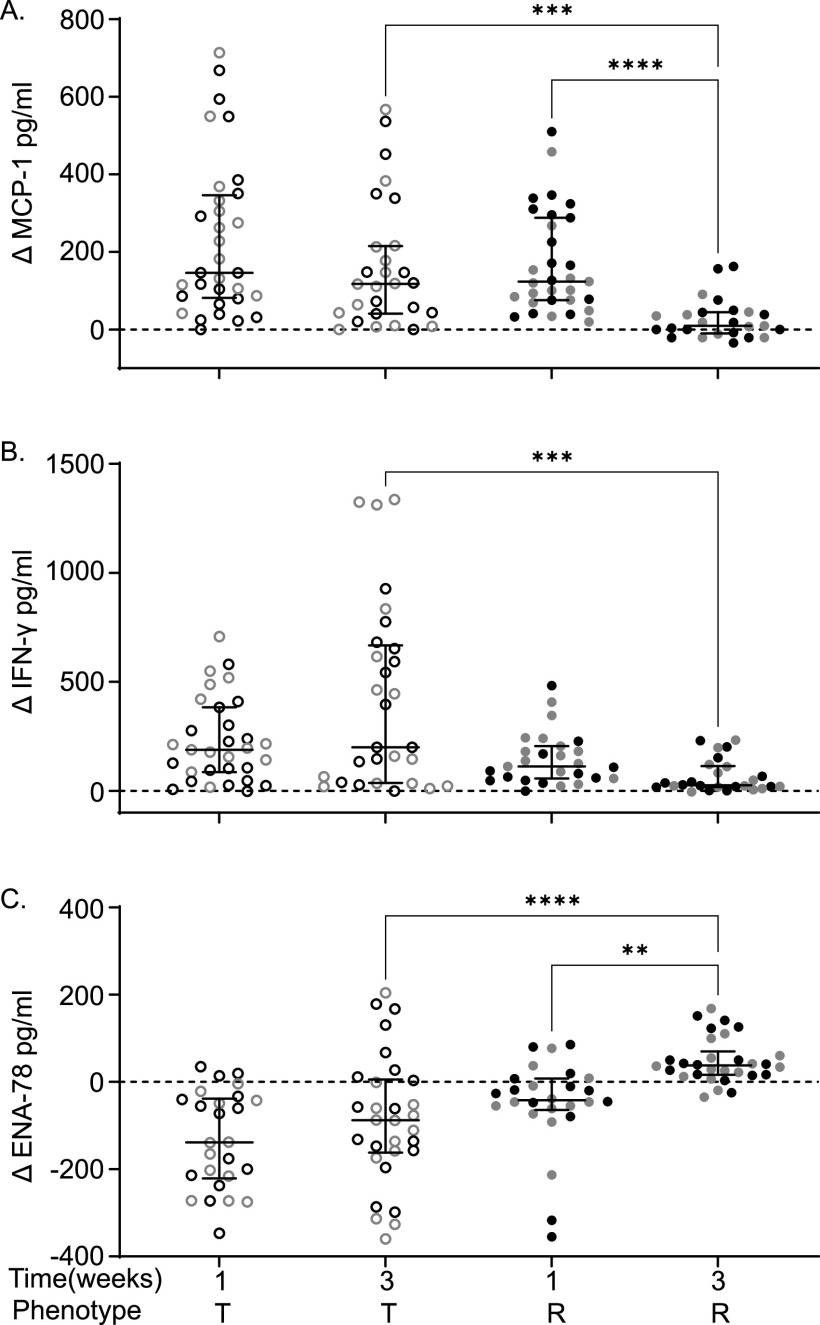
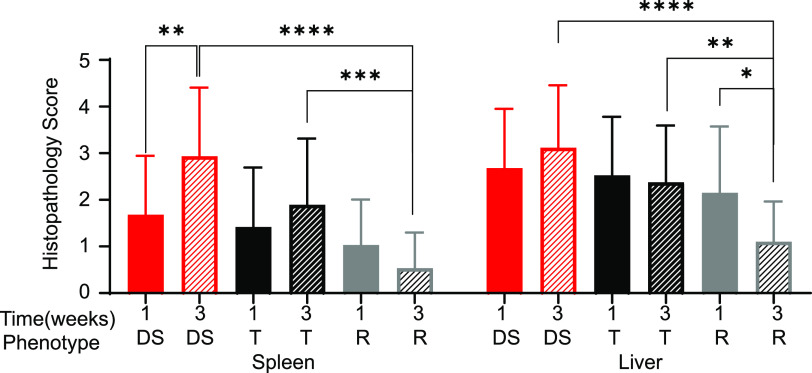
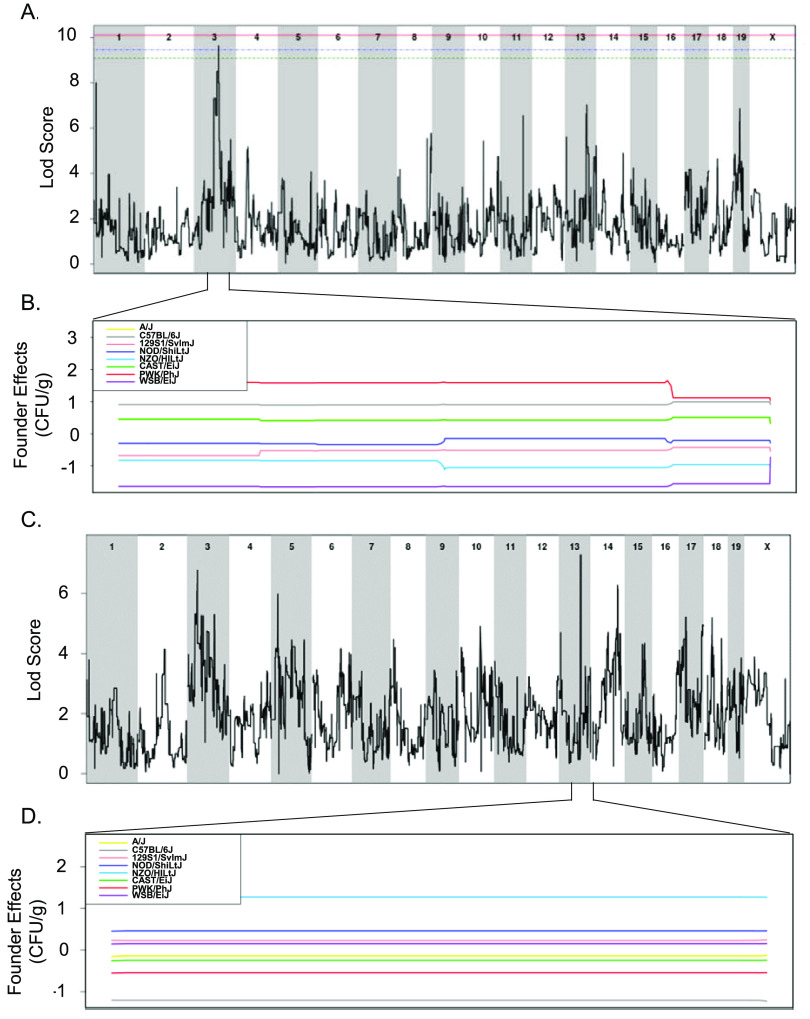
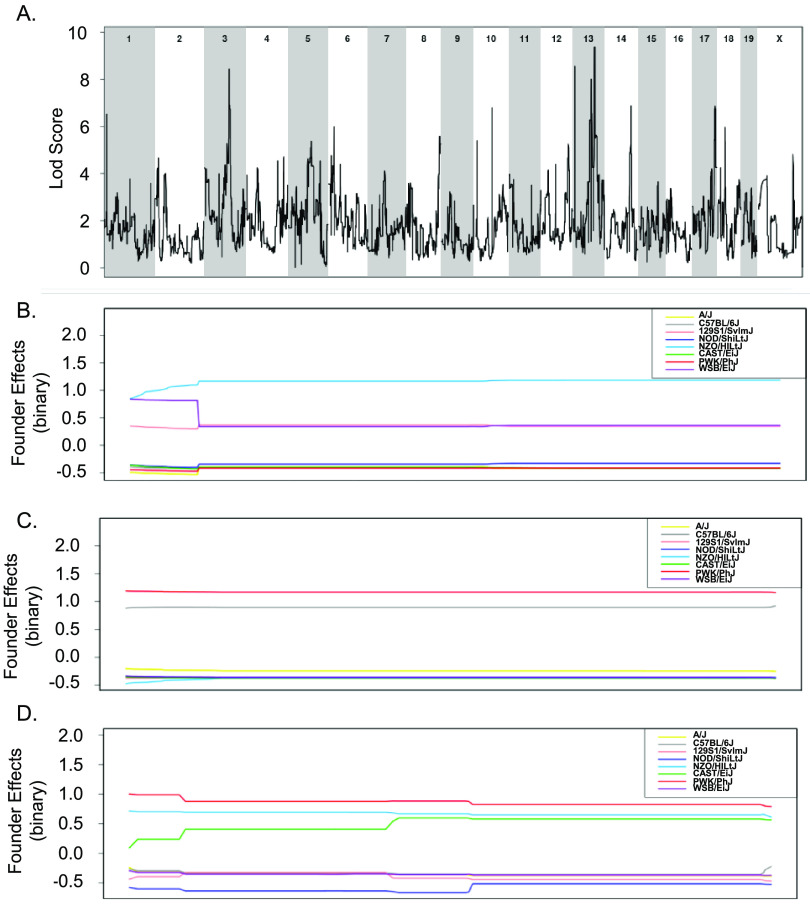
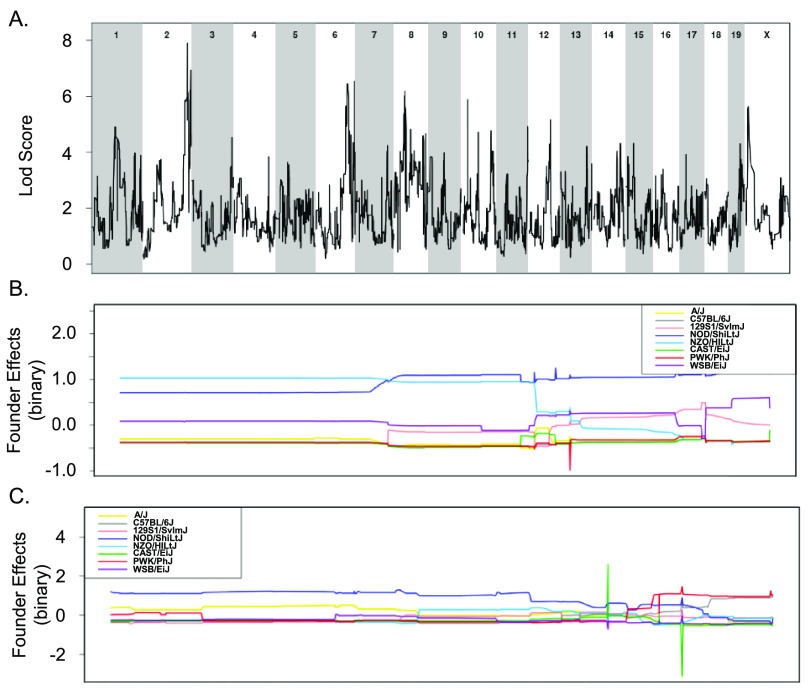
Understanding the molecular mechanisms underlying resistance and tolerance to pathogen infection may present the opportunity to develop novel interventions. Resistance is the absence of clinical disease with a low pathogen burden, while tolerance is minimal clinical disease with a high pathogen burden. Salmonella is a worldwide health concern. We studied 18 strains of collaborative cross mice that survive acute Salmonella Typhimurium (STm) infections. We infected these strains orally and monitored them for 3 weeks. Five strains cleared STm (resistant), six strains maintained a bacterial load and survived (tolerant), while seven strains survived >7 days but succumbed to infection within the study period and were called "delayed susceptible." Tolerant strains were colonized in the Peyer's patches, mesenteric lymph node, spleen, and liver, while resistant strains had significantly reduced bacterial colonization. Tolerant strains had lower preinfection core body temperatures and had disrupted circadian patterns of body temperature postinfection sooner than other strains. Tolerant strains had higher circulating total white blood cells than resistant strains, driven by increased numbers of neutrophils. Tolerant strains had more severe tissue damage and higher circulating levels of monocyte chemoattractant protein 1 (MCP-1) and interferon gamma (IFN-γ), but lower levels of epithelial neutrophil-activating protein 78 (ENA-78) than resistant strains. Quantitative trait locus (QTL) analysis revealed one significant association and six suggestive associations. Gene expression analysis identified 22 genes that are differentially regulated in tolerant versus resistant animals that overlapped these QTLs. Fibrinogen genes (Fga, Fgb, and Fgg) were found across the QTL, RNA, and top canonical pathways, making them the best candidate genes for differentiating tolerance and resistance. IMPORTANCE To survive a bacterial infection, an infected host can display resistance or tolerance. Resistance is indicated by a decrease in pathogen load, while for tolerance a high pathogen load is accompanied by minimal disease. We infected genetically diverse mice with Salmonella Typhimurium for 21 days and discovered new phenotypes for disease outcome (delayed susceptible, tolerant, and resistant). Tolerant strains showed the lowest preinfection core body temperatures and the most rapid disruption in circadian patterns of body temperature postinfection. Tolerant strains had higher circulating neutrophils and higher circulating levels of MCP-1 and IFN-γ, but lower levels of ENA-78 than did resistant strains, in addition to more severe tissue damage. QTL analysis revealed multiple associated regions, and gene expression analysis identified 22 genes that are differentially regulated in tolerant versus resistant animals in these regions. Fibrinogen genes (Fga, Fgb, and Fgg) were found across the QTL, RNA, and the top canonical pathways, suggesting a role in tolerance.
Keywords: QTL; Salmonella; collaborative cross; fibrinogen; resistance; tolerance.
Conflict of interest statement
The authors declare no conflict of interest.
Figures
Similar articles
-
Collaborative Cross mice have diverse phenotypic responses to infection with Methicillin-resistant Staphylococcus aureus USA300.PLoS Genet. 2024 May 2;20(5):e1011229. doi: 10.1371/journal.pgen.1011229. eCollection 2024 May. PLoS Genet. 2024. PMID: 38696518 Free PMC article.
-
Genetic background influences survival of infections with Salmonella enterica serovar Typhimurium in the Collaborative Cross.PLoS Genet. 2022 Apr 13;18(4):e1010075. doi: 10.1371/journal.pgen.1010075. eCollection 2022 Apr. PLoS Genet. 2022. PMID: 35417454 Free PMC article.
-
Identification of new loci involved in the host susceptibility to Salmonella Typhimurium in collaborative cross mice.BMC Genomics. 2018 Apr 27;19(1):303. doi: 10.1186/s12864-018-4667-0. BMC Genomics. 2018. PMID: 29703142 Free PMC article.
-
Surviving Deadly Lung Infections: Innate Host Tolerance Mechanisms in the Pulmonary System.Front Immunol. 2018 Jun 22;9:1421. doi: 10.3389/fimmu.2018.01421. eCollection 2018. Front Immunol. 2018. PMID: 29988424 Free PMC article. Review.
-
Characteristics and molecular mechanism of drug-tolerant cells in cancer: a review.Front Oncol. 2023 Jul 7;13:1177466. doi: 10.3389/fonc.2023.1177466. eCollection 2023. Front Oncol. 2023. PMID: 37483492 Free PMC article. Review.
Cited by
-
Antibiotic-recalcitrant Salmonella during infection.Nat Rev Microbiol. 2025 May;23(5):276-287. doi: 10.1038/s41579-024-01124-z. Epub 2024 Nov 18. Nat Rev Microbiol. 2025. PMID: 39558126 Review.
-
Identification of collaborative cross mouse strains permissive to Salmonella enterica serovar Typhi infection.Sci Rep. 2023 Jan 9;13(1):393. doi: 10.1038/s41598-023-27400-1. Sci Rep. 2023. PMID: 36624251 Free PMC article.
-
The Lack of Natural IgM Increases Susceptibility and Impairs Anti-Vi Polysaccharide IgG Responses in a Mouse Model of Typhoid.Immunohorizons. 2022 Dec 1;6(12):807-816. doi: 10.4049/immunohorizons.2200088. Immunohorizons. 2022. PMID: 36480484 Free PMC article.
-
Collaborative Cross mice have diverse phenotypic responses to infection with Methicillin-resistant Staphylococcus aureus USA300.PLoS Genet. 2024 May 2;20(5):e1011229. doi: 10.1371/journal.pgen.1011229. eCollection 2024 May. PLoS Genet. 2024. PMID: 38696518 Free PMC article.
References
-
- Majowicz SE, Musto J, Scallan E, Angulo FJ, Kirk M, O’Brien SJ, Jones TF, Fazil A, Hoekstra RM, International Collaboration on Enteric Disease “Burden of Illness” Studies . 2010. The global burden of nontyphoidal Salmonella gastroenteritis. Clin Infect Dis 50:882–889. doi:10.1086/650733. - DOI - PubMed
-
- Stanaway JD, Parisi A, Sarkar K, Blacker BF, Reiner RC, Hay SI, Nixon MR, Dolecek C, James SL, Mokdad AH, Abebe G, Ahmadian E, Alahdab F, Alemnew BTT, Alipour V, Allah Bakeshei F, Animut MD, Ansari F, Arabloo J, Asfaw ET, Bagherzadeh M, Bassat Q, Belayneh YMM, Carvalho F, Daryani A, Demeke FM, Demis ABB, Dubey M, Duken EE, Dunachie SJ, et al. . 2019. The global burden of non-typhoidal Salmonella invasive disease: a systematic analysis for the Global Burden of Disease Study 2017. Lancet Infect Dis 19:1312–1324. doi:10.1016/S1473-3099(19)30418-9. - DOI - PMC - PubMed
Publication types
MeSH terms
Substances
LinkOut - more resources
Full Text Sources
Molecular Biology Databases
Research Materials
Miscellaneous
