

Coastal Transient Niches Shape the Microdiversity Pattern of a Bacterioplankton Population with Reduced Genomes
- PMID: 35880883
- PMCID: PMC9426536
- DOI: 10.1128/mbio.00571-22
Coastal Transient Niches Shape the Microdiversity Pattern of a Bacterioplankton Population with Reduced Genomes
Abstract
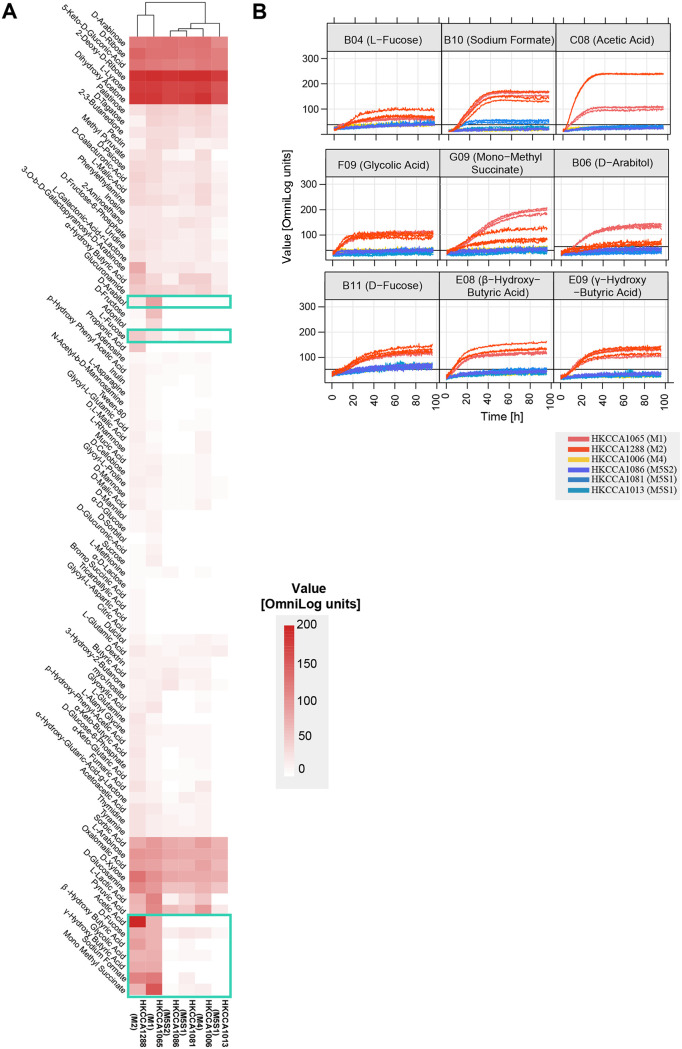
Globally dominant marine bacterioplankton lineages are often limited in metabolic versatility, owing to their extensive genome reductions, and thus cannot take advantage of transient nutrient patches. It is therefore perplexing how the nutrient-poor bulk seawater sustains the pelagic streamlined lineages, each containing numerous populations. Here, we sequenced the genomes of 33 isolates of the recently discovered CHUG lineage (~2.6 Mbp), which have some of the smallest genomes in the globally abundant Roseobacter group (commonly over 4 Mbp). These genome-reduced bacteria were isolated from a transient habitat: seawater surrounding the brown alga, Sargassum hemiphyllum. Population genomic analyses showed that: (i) these isolates, despite sharing identical 16S rRNA genes, were differentiated into several genetically isolated populations through successive speciation events; (ii) only the first speciation event led to the genetic separation of both core and accessory genomes; and (iii) populations resulting from this event are differentiated at many loci involved in carbon utilization and oxygen respiration, corroborated by BiOLOG phenotype microarray assays and oxygen uptake kinetics experiments, respectively. These differentiated traits match well with the dynamic nature of the macroalgal seawater, in which the quantity and quality of carbon sources and the concentration of oxygen likely vary spatially and temporally, though other habitats, like fresh organic aggregates, cannot be ruled out. Our study implies that transient habitats in the overall nutrient-poor ocean can shape the microdiversity and population structure of genome-reduced bacterioplankton lineages. IMPORTANCE Prokaryotic species, defined with operational thresholds, such as 95% of the whole-genome average nucleotide identity (ANI) or 98.7% similarity of the 16S rRNA gene sequences, commonly contain extensive fine-grained diversity in both the core genome and the accessory genome. However, the ways in which this genomic microdiversity and its associated phenotypic microdiversity are organized and structured is poorly understood, which disconnects microbial diversity and ecosystem functioning. Population genomic approaches that allow this question to be addressed are commonly applied to cultured species because linkages between different loci are necessary but are missing from metagenome-assembled genomes. In the past, these approaches were only applied to easily cultivable bacteria and archaea, which, nevertheless, are often not representative of natural communities. Here, we focus on the recently discovered cluster, CHUG, which are representative in marine bacterioplankton communities and possess some of the smallest genomes in the globally dominant marine Roseobacter group. Despite being over 95% ANI and identical in the 16S rRNA gene, the 33 CHUG genomes we analyzed have undergone multiple speciation events, with the first split event predominantly structuring the genomic diversity. The observed pattern of genomic microdiversity correlates with CHUG members' differential utilization of carbon sources and differential ability to explore low-oxygen niches. The available data are consistent with the idea that brown algae may be home to CHUG, though other habitats, such as fresh organic aggregates, are also possible.
Keywords: CHUG; Roseobacter; Sargassum; microdiversity; population genomics; streamlined genomes.
Conflict of interest statement
The authors declare no conflict of interest.
Figures


Similar articles
-
Novel phage infecting the Roseobacter CHUG lineage reveals a diverse and globally distributed phage family.mSphere. 2024 Jul 30;9(7):e0045824. doi: 10.1128/msphere.00458-24. Epub 2024 Jun 27. mSphere. 2024. PMID: 38926906 Free PMC article.
-
Mechanisms driving genome reduction of a novel Roseobacter lineage.ISME J. 2021 Dec;15(12):3576-3586. doi: 10.1038/s41396-021-01036-3. Epub 2021 Jun 18. ISME J. 2021. PMID: 34145391 Free PMC article.
-
Cryptic speciation of a pelagic Roseobacter population varying at a few thousand nucleotide sites.ISME J. 2020 Dec;14(12):3106-3119. doi: 10.1038/s41396-020-00743-7. Epub 2020 Aug 19. ISME J. 2020. PMID: 32814868 Free PMC article.
-
Diversity, ecology, and genomics of the Roseobacter clade: a short overview.Arch Microbiol. 2008 Jun;189(6):531-9. doi: 10.1007/s00203-008-0353-y. Epub 2008 Feb 6. Arch Microbiol. 2008. PMID: 18253713 Review.
-
Marine Bacterioplankton Seasonal Succession Dynamics.Trends Microbiol. 2017 Jun;25(6):494-505. doi: 10.1016/j.tim.2016.12.013. Epub 2017 Jan 17. Trends Microbiol. 2017. PMID: 28108182 Review.
Cited by
-
Genome sequencing and multifaceted taxonomic analysis of novel strains of violacein-producing bacteria and non-violacein-producing close relatives.Microb Genom. 2023 Apr;9(4):mgen000971. doi: 10.1099/mgen.0.000971. Microb Genom. 2023. PMID: 37052581 Free PMC article.
-
Novel phage infecting the Roseobacter CHUG lineage reveals a diverse and globally distributed phage family.mSphere. 2024 Jul 30;9(7):e0045824. doi: 10.1128/msphere.00458-24. Epub 2024 Jun 27. mSphere. 2024. PMID: 38926906 Free PMC article.
References
-
- Fodelianakis S, Washburne AD, Bourquin M, Pramateftaki P, Kohler TJ, Styllas M, Tolosano M, De Staercke V, Schön M, Busi SB, Brandani J, Wilmes P, Peter H, Battin TJ. 2022. Microdiversity characterizes prevalent phylogenetic clades in the glacier-fed stream microbiome. 3. ISME J 16:666–675. doi:10.1038/s41396-021-01106-6. - DOI - PMC - PubMed
Publication types
MeSH terms
Substances
LinkOut - more resources
Full Text Sources
Miscellaneous
