. 2022 Aug 30;7(4):e0030122.
doi: 10.1128/msystems.00301-22. Epub 2022 Jul 26.

Artificial Soils Reveal Individual Factor Controls on Microbial Processes

Affiliations

Artificial Soils Reveal Individual Factor Controls on Microbial Processes

Ilenne Del Valle et al. mSystems. .

Abstract

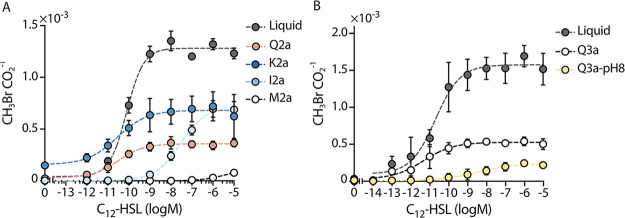
Soil matrix properties influence microbial behaviors that underlie nutrient cycling, greenhouse gas production, and soil formation. However, the dynamic and heterogeneous nature of soils makes it challenging to untangle the effects of different matrix properties on microbial behaviors. To address this challenge, we developed a tunable artificial soil recipe and used these materials to study the abiotic mechanisms driving soil microbial growth and communication. When we used standardized matrices with varying textures to culture gas-reporting biosensors, we found that a Gram-negative bacterium (Escherichia coli) grew best in synthetic silt soils, remaining active over a wide range of soil matric potentials, while a Gram-positive bacterium (Bacillus subtilis) preferred sandy soils, sporulating at low water potentials. Soil texture, mineralogy, and alkalinity all attenuated the bioavailability of an acyl-homoserine lactone (AHL) signaling molecule that controls community-level microbial behaviors. Texture controlled the timing of AHL sensing, while AHL bioavailability was decreased ~105-fold by mineralogy and ~103-fold by alkalinity. Finally, we built artificial soils with a range of complexities that converge on the properties of one Mollisol. As artificial soil complexity increased to more closely resemble the Mollisol, microbial behaviors approached those occurring in the natural soil, with the notable exception of organic matter. IMPORTANCE Understanding environmental controls on soil microbes is difficult because many abiotic parameters vary simultaneously and uncontrollably when different natural soils are compared, preventing mechanistic determination of any individual soil parameter's effect on microbial behaviors. We describe how soil texture, mineralogy, pH, and organic matter content can be varied individually within artificial soils to study their effects on soil microbes. Using microbial biosensors that report by producing a rare indicator gas, we identify soil properties that control microbial growth and attenuate the bioavailability of a diffusible chemical used to control community-level behaviors. We find that artificial soils differentially affect signal bioavailability and the growth of Gram-negative (Escherichia coli) and Gram-positive (Bacillus subtilis) microbes. These artificial soils are useful for studying the mechanisms that underlie soil controls on microbial fitness, signaling, and gene transfer.

Keywords: acylhomoserine lactone; artificial soils; biosensor; cell signaling; indicator gas; soil; synthetic biology; water retention curve.


Conflict of interest statement

The authors declare no conflict of interest.

Figures

FIG 1
FIG 1
Design and characterization of artificial soils. (A) Artificial soils produced by: (1) mixing quartz of different sizes together to provide texture; (2) adding clay minerals to vary mineralogy; (3) adjusting pH using CaCO3; (4) aggregating using wet-dry cycles; and (5) hydrating to the desired water content (θ) and potential (ψm). (B) Three artificial soils (Q2a, M2a, and Q2x0.5) and a natural soil. (C) Water retention curves of soils that vary only in texture or (D) mineralogy. Plant available water follows the trend Q2a > Q3a > Q1. (E) Surface area of soils that vary in mineralogy. Error bars represent one standard deviation from three experiments.
FIG 2
FIG 2
Effect of particle size distribution on microbial growth. Genetic circuit used to program constitutive indicator gas production in (A) Ec-MHT and (B) Bs-MHT. In both strains, the MHT gene is chromosomally integrated and expressed using a constitutive promoter so that it is always on. CH3Br production over time in (C) sand, Q1; (D) liquid; (E) silt loam, Q2a; and (F) clay, Q3a. For each measurement, 106 CFU of Ec-MHT (circles) or Bs-MHT (squares) in 200 μL of MIDV1 medium were added to 2 mL glass vials containing 800 mg of soil. Vials were capped and incubated at 30°C. CH3Br was measured using a GC-MS every 4 h for 40 h. Gas production was normalized to the maximum signal obtained. Error bars represent one standard deviation from three experiments.
FIG 3
FIG 3
Effect of OM on microbial growth in soils. Ec-MHT (106 CFU in 200 μL of MIDV1) were added to 2 mL glass vials containing 800 mg of soils with differentOM source and amount. Vials were capped and incubated at 30°C. CH3Br was measured using a GC-MS after 0 and 1 h then every 3 h thereafter. CH3Br production over time in soils with Xanthan (square) or chitin (triangle) at 0.5% (white) or 1% (gray) (wt/wt). An artificial soil without addition of OM, silt loam Q2a soil (white circle), and a liquid control (gray circle) are shown. Experiments were performed in triplicate. Error bars indicate one standard deviation.
FIG 4
FIG 4
AHL bioavailability changes with soil particle size. (A) Ratiometric gas reporting approach to monitor cell growth (CO2) and AHL sensing (CH3Br). In this circuit, LasR activates MHT production and CH3Br synthesis upon binding AHL. (B) To monitor AHL bioavailability, Ec-MHT (108 cells) in MIDV1 medium (100 μL) were added to the bottom of 2 mL glass vials containing each soil (800 mg). AHL (1 μM) in MIDV1 medium (100 μL) was added to the top of the soil, and vials were capped and incubated at 30°C. CH3Br and CO2 were measured using GC-MS at time zero and 1 h after capping, and then every 3 h. (C) CO2 production in the absence and (D) presence of AHL reveals that cells grow under both conditions. (E) CH3Br production in the absence and (F) presence of AHL reveals that indicator gas production is AHL-dependent. (G) The ratio of CH3Br/CO2 allows for a comparison of the AHL sensed per cell in the presence and (H) absence of AHL. This data shows that soil texture affects the dynamics of AHL sensing. The dashed lines represent a fit to an exponential growth-decay model. Dots indicate average and error bars indicate one standard deviation calculated with n = 3.
FIG 5
FIG 5
Mineralogy and pH affect AHL bioavailability. (A) AHL bioavailability in soils with different mineralogy but the same texture. Ec-AHL-MHT (108 CFU) were mixed with different concentrations of AHL and immediately added to vials containing artificial soils with different clay types in MIDV1. The medium contained 0.25M MOPS to obtain a ψm = −80 kPa. Vials were capped, and CH3Br and CO2 were measured using a GC-MS after 6 h. The dashed lines represent a Hill function fit to the data. With this fit, different k values were obtained for liquid (7.8 × 10−11), Q2a (3.1 × 10−11), K2a (2.8 × 10−11), I2a (2.9 × 10−8), and M2a (≥4.2 × 10−6). (B) Different amounts of AHL were added in 100 μL of MIDV1 medium to vials containing artificial soils with different pH. AHL was incubated for 30 min in the soils before adding the AHL biosensor (108 cells) in 100 μL of MIDV1 containing 0.25 M MOPS, pH 7.0 to achieve FC. Vials were capped and gas production was measured after 6 h. The CH3Br/CO2 ratio represents the per cell sensing of AHL. The dashed lines represent a Hill function fit to the data. With this fit, distinct k values are obtained with liquid (2.0 × 10−11), Q3a (4.7 × 10−12), and Q3a-pH 8 (3.5 × 10−9). Error bars represent one standard deviation determined from three experiments.
FIG 6
FIG 6
AHL bioavailability in artificial soils that recreate different properties of a Mollisol. (A) Different concentrations of AHL were added to MIDV1 medium (300 μL) containing Ec-AHL-MHT (108 CFU), and this mixture was mixed with a series of artificial soils (700 mg) that mimic different levels of complexity found in a Mollisol from Austin, TX. CH3Br gas was normalized by the CO2 signal measured after a 6-h incubation in closed vials. The dashed line indicates the Hill function fit to the data. PS = particle size, M = mineralogy, pH = addition of CaCO3, OM = addition of xanthan gum, and NS = natural soil. In the case of PS+M soil, 0.25 M MOPS, pH 7.0 was included in the buffer to isolate the effect of mineralogy on bioavailability. (B) Maximum gas production (CH3Br/CO2) obtained from a fit of the data to the Hill equation reveals a decrease in maximum gas production as soil complexity increases (ordinary one-way ANOVA, Tukey’s multiple comparisons; **, P < 0.001, *, P < 0.03). (C) Amount of AHL (pM) necessary for a half maximum gas response. Artificial soil that recreates texture, mineralogy, and pH requires an AHL concentration within the same order of magnitude as the natural soil to induce the biosensor (nonparametric ANOVA, Dunn’s multiple comparisons; *, P < 0.03). Error bar represents one standard deviation calculated from three replicates.
FIG 7
FIG 7
Artificial soil applications. Artificial soils with different properties can be used to study (A) the bioavailability of a wide range of chemicals of interest, (B) the survival and distribution of microorganisms under different hydration conditions, (C) microbial metabolisms under different oxygen gradients and availability of cofactors, (D) soil formation, and (E) plant-fungi-bacteria interactions.

References

    1. Falkowski PG, Fenchel T, Delong EF. 2008. The microbial engines that drive earth’s biogeochemical cycles. Science 320:1034–1039. doi:10.1126/science.1153213. - DOI - PubMed
    1. Berendsen RL, Pieterse CMJ, Bakker PAHM. 2012. The rhizosphere microbiome and plant health. Trends Plant Sci 17:478–486. doi:10.1016/j.tplants.2012.04.001. - DOI - PubMed
    1. Jansson JK, Hofmockel KS. 2018. The soil microbiome—from metagenomics to metaphenomics. Curr Opin Microbiol 43:162–168. doi:10.1016/j.mib.2018.01.013. - DOI - PubMed
    1. Cavicchioli R, Ripple WJ, Timmis KN, Azam F, Bakken LR, Baylis M, Behrenfeld MJ, Boetius A, Boyd PW, Classen AT, Crowther TW, Danovaro R, Foreman CM, Huisman J, Hutchins DA, Jansson JK, Karl DM, Koskella B, Mark Welch DB, Martiny JBH, Moran MA, Orphan VJ, Reay DS, Remais JV, Rich VI, Singh BK, Stein LY, Stewart FJ, Sullivan MB, van Oppen MJH, Weaver SC, Webb EA, Webster NS. 2019. Scientists’ warning to humanity: microorganisms and climate change. Nat Rev Microbiol 17:569–586. doi:10.1038/s41579-019-0222-5. - DOI - PMC - PubMed
    1. Vos M, Wolf AB, Jennings SJ, Kowalchuk GA. 2013. Micro-scale determinants of bacterial diversity in soil. FEMS Microbiol Rev 37:936–954. doi:10.1111/1574-6976.12023. - DOI - PubMed

Publication types