. 2022 Jan-Dec;14(1):2104086.
doi: 10.1080/19490976.2022.2104086.

Low abundance members of the gut microbiome exhibit high immunogenicity

Affiliations

Low abundance members of the gut microbiome exhibit high immunogenicity

Geongoo Han et al. Gut Microbes. 2022 Jan-Dec.

Abstract

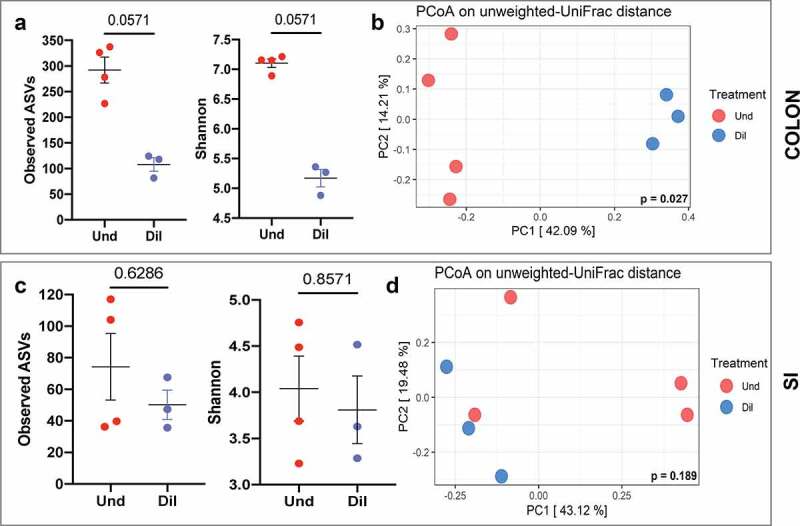
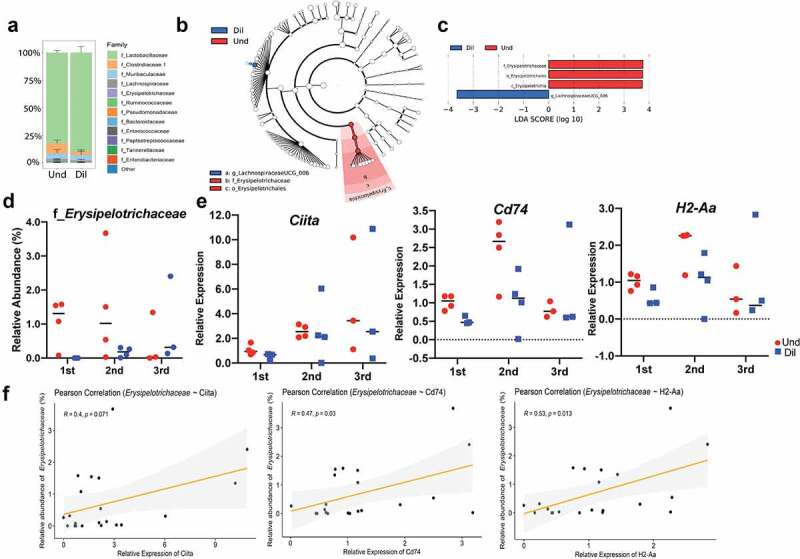
Studies identifying bacterial members that dictate host phenotype have focused mainly on the dominant members, and the role of low abundance microbes in determining host phenotypes and pathogenesis of diseases remains unexplored. In this study, we compared the gut bacterial community of mice with wide-ranging microbial exposure to determine if low abundance bacteria vary based on microbial exposure or remain consistent. We noted that similar to the high abundance bacterial community, a core community of low abundance bacteria made up a significant portion of the gut microbiome irrespective of microbial exposure. To determine the role of low abundance bacteria in regulating community composition and host gene expression, we devised a microbiome dilution strategy to "delete" out low abundance bacteria and engrafted the diluted microbiomes into germ-free mice. Our approach successfully excluded low abundance bacteria from small and large intestinal bacterial communities and induced global changes in microbial community composition in the large intestine. Gene expression analysis of intestinal tissue revealed that loss of low abundance bacteria resulted in a drastic reduction in expression of multiple genes involved MHCII antigen presentation pathway and T-cell cytokine production in the small intestine. The effect of low abundance bacteria on MHCII expression was found to be specific to the intestinal epithelium at an early timepoint post-colonization and correlated with bacteria belonging to the family Erysipelotrichaceae. We conclude that low abundance bacteria have a significantly higher immuno-stimulatory effect compared to dominant bacteria and are thus potent drivers of early immune education in the gut.

Keywords: Erysipelotrichaceae; Gut microbiome; MHC class II; immune education; low abundance bacteria.


Conflict of interest statement

No potential conflict of interest was reported by the author(s).

Figures

Figure 1.
Figure 1.
Low abundance bacteria constitute a significant and unique portion of the gut microbiome. (a) Heat map of high and low abundance bacteria based on the fecal 16S rRNA gene of Taconic, Brown, and pet store mice. A genus with a relative abundance of more than 1% is indicated with sky blue. (b) Heat map of 20 most abundance bacteria at the genus level. (c) Donut chart of the phylum composition of high and low abundance bacteria. Relative abundance (d) and the number of the genus (e) of high and low abundance bacteria at the genus level. Error bar represents SEM. (f) Venn diagram of the shared and unique genus of high and low abundance bacteria among the groups.
Figure 2.
Figure 2.
Low abundance bacteria are deleted from the gut microbiome upon colonization of germ-free mice with diluted cecal contents. (a) Strategy for deleting low abundance bacteria from the gut microbiome. Heat map of the colon (b) and small intestine microbiome (c) at the genus level after a week of colonization with the undiluted or diluted microbiome in germ-free mice. In the heat map, a relative abundance of the genus is expressed as log10(relative abundance). The number of shared and unique genera between the Und and Dil group in the colon or small intestine at 1-week post-colonization (d) and 5-week post-colonization (e).
Figure 3.
Figure 3.
Colonization with diluted cecal contents produced reduced diversity and altered composition at 1 week in the colon bacterial community but not in the small intestine. (a) Alpha diversity (observed ASVs and Shannon) in the colon. (b) PCoA plot based on unweighted-UniFrac distance in the colon. (c) Alpha diversity (observed ASVs and Shannon) in the small intestine. (d) PCoA plot based on unweighted-UniFrac distance in the small intestine. All data were obtained at 1-week post-colonization. Mann-Whitney test and PERMANOVA were used to assess significant differences for alpha and beta diversity, respectively.
Figure 4.
Figure 4.
Low abundance bacteria drive the expression of multiple genes involved in antigen presentation and processing pathways in the small intestine. (a) Volcano plot of RNA-Seq results. Each dot represents each gene, and significant DEGs (FDR < 0.05) are expressed as blue dots. Blue and red boxes mean up-regulated and down-regulated DEGs in the Und, respectively. The X-axis is log2(Fold Change) and Y-axis is – log10(p-value). (b) Enriched pathways of the GO biological process. Red and blue circles represent up-regulated and down-regulated pathways in the Und, respectively. (c) Heat map of normalized counts of 50 most significant DEGs. Genes are ordered by FDR. The smaller counts expressed as the redder, the larger counts expressed as the bluer. All data were obtained from the small intestine at 1-week post-colonization.
Figure 5.
Figure 5.
Low abundance bacteria induce MHC class II expression in the small intestine. (a) Normalized counts of MHC class II-related genes in the Und and Dil. DESeq2 was used for statistical analysis. Representative images (b) and quantification (c) of MHC class II expression in the small intestine of the Und and Dil at 1-week post-colonization. Samples were stained with DAPI (nuclei; blue), EpCAM (epithelial cells; green), and I-A/I-E (MHC class II; violet). For quantification of MHC class II molecules, 6–10 images were used per mouse with 3–4 mice per group. Welch’s t-test was used to find significant differences between the two groups.
Figure 6.
Figure 6.
Presence of low abundance bacteria belonging to the family Erysipelotrichaceae positively correlates with the enhanced MHC class II antigen processing. (a) Bar plot of relative abundance of the small intestine microbiome at the family level. Error bar represents SEM. Cladogram (b) and bar plot (c), which were obtained from LEfSe analysis, show differentially present taxa between the Und and Dil. Relative abundance of Erysipelotrichaceae (d) and relative expression of MHC class II-related genes (Ciita, Cd74, and H2-Aa) (e) in three independent experiments. (f) Scatter plot with regression line to infer the correlation between the Erysipelotrichaceae and MHC class II-related genes. Pearson’s correlation coefficients were used to assess the significance of the relationship between bacteria and genes. All data were obtained from the small intestine at 1-week post-colonization.
Figure 7.
Figure 7.
Summary of the interaction between low abundance bacteria and MHC class II expression in the small intestine. Mice gut microbiome consists of a small number of high abundance bacteria with many low abundance bacteria. Dilution excludes low abundance bacteria from the cecal microbiome, the diluted microbiome is mostly made up of high abundance bacteria. Colonization of the undiluted and diluted cecal microbiome to the germ-free mice shows that the Und group has almost all genera of the Dil group with exclusive bacterial genera and the different rates of MHC class II expression in the small intestine at earlier time points (week 1; higher expression in the undiluted group than in the diluted group). However, dilution effects on microbial composition disappear and there are no differences of the MHC class II expression at later time points (week 5) (Created with BioRender.com).

References

    1. Fan Y, Pedersen O.. Gut microbiota in human metabolic health and disease. Nat Rev Microbiol. 2021;19(1):55–17. doi: 10.1038/s41579-020-0433-9 - DOI - PubMed
    1. Turnbaugh PJ, Gordon JI. The core gut microbiome, energy balance and obesity. J Physiol. 2009;587(17):4153–4158. doi: 10.1113/jphysiol.2009.174136 - DOI - PMC - PubMed
    1. Banerjee S, Schlaeppi K, van der Heijden MGA. Keystone taxa as drivers of microbiome structure and functioning. Nat Rev Microbiol. 2018;16(9):567–576. doi: 10.1038/s41579-018-0024-1 - DOI - PubMed
    1. Hajishengallis G, Darveau RP, Curtis MA. The keystone-pathogen hypothesis. Nat Rev Microbiol. 2012;10(10):717–725. doi: 10.1038/nrmicro2873 - DOI - PMC - PubMed
    1. Holt SC, Ebersole JL. Porphyromonas gingivalis, Treponema denticola, and Tannerella forsythia: the “red complex”, a prototype polybacterial pathogenic consortium in periodontitis. Periodontol. 2005;38:72–122. doi: 10.1111/j.1600-0757.2005.00113.x - DOI - PubMed

Publication types

Substances