. 2022 Aug 26;377(6609):951-959.
doi: 10.1126/science.abp8715. Epub 2022 Jul 26.

The Huanan Seafood Wholesale Market in Wuhan was the early epicenter of the COVID-19 pandemic

Affiliations

The Huanan Seafood Wholesale Market in Wuhan was the early epicenter of the COVID-19 pandemic

Michael Worobey et al. Science. .

Erratum in

Abstract

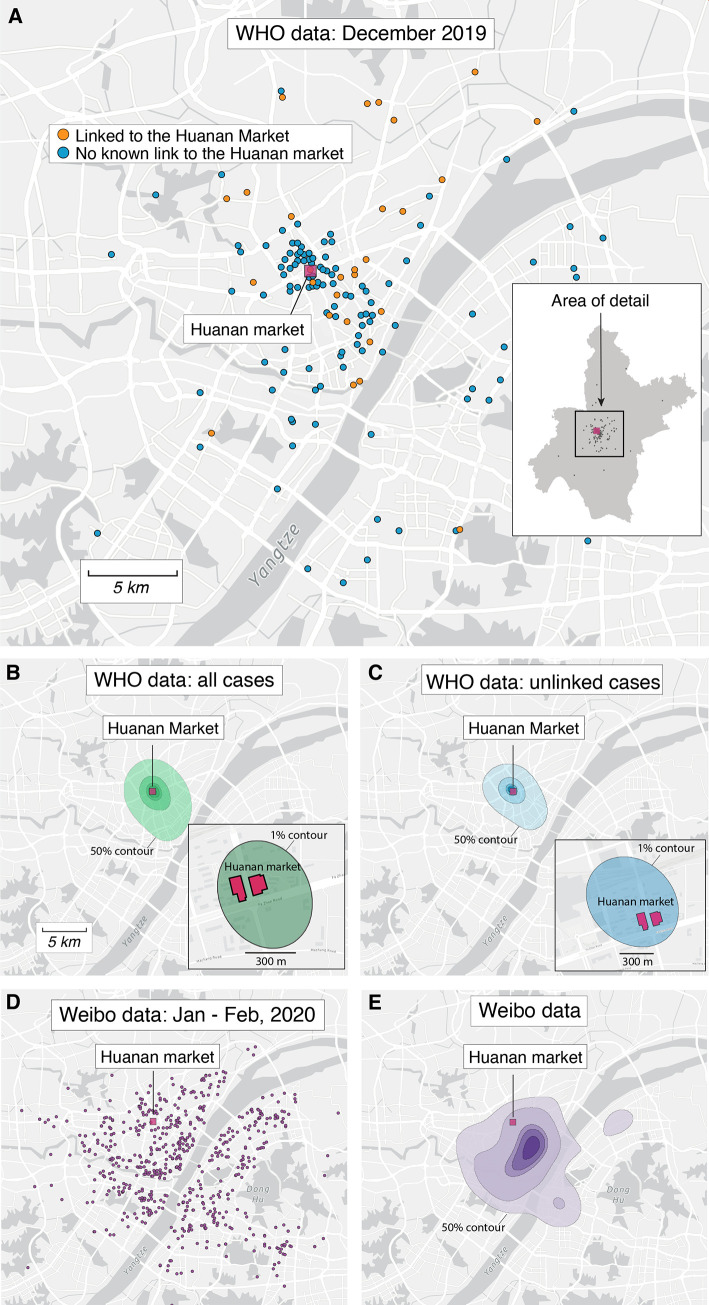
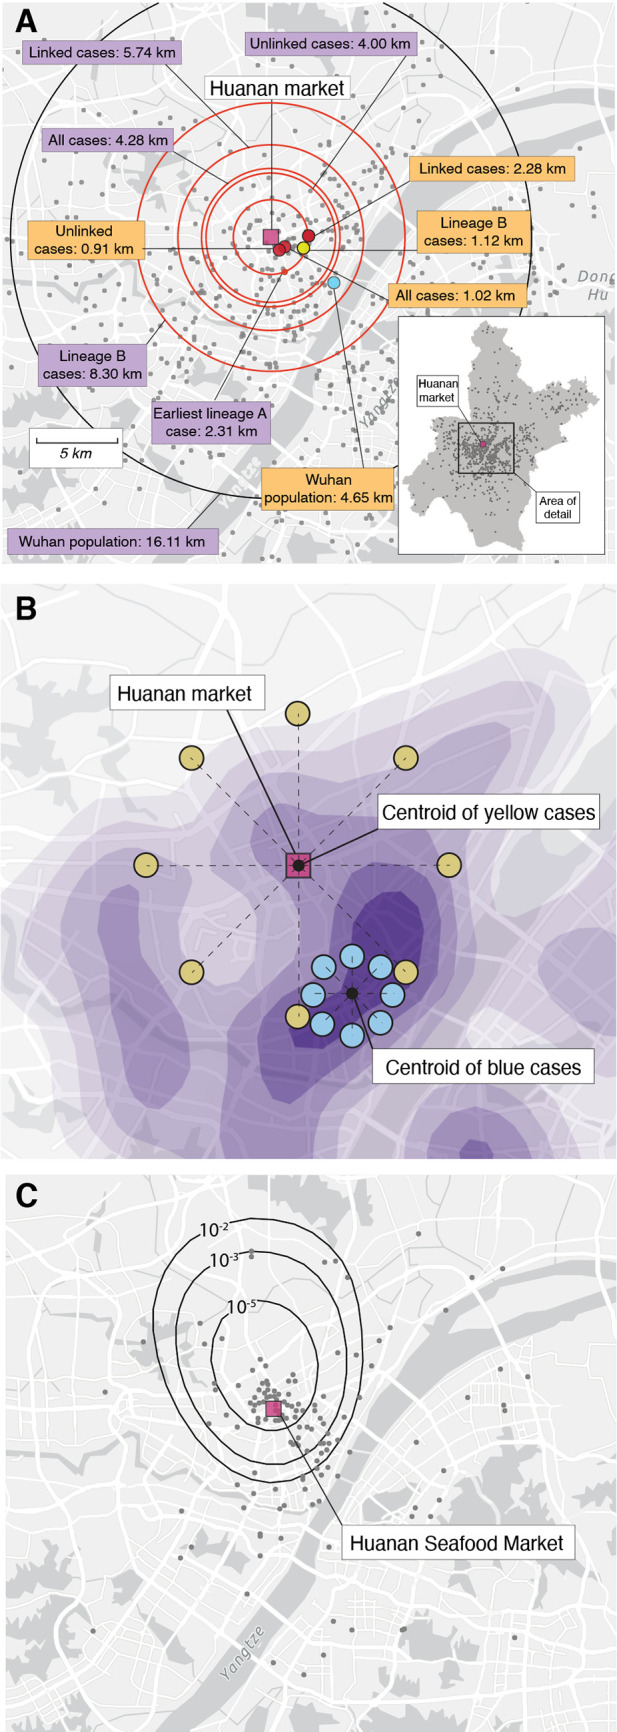
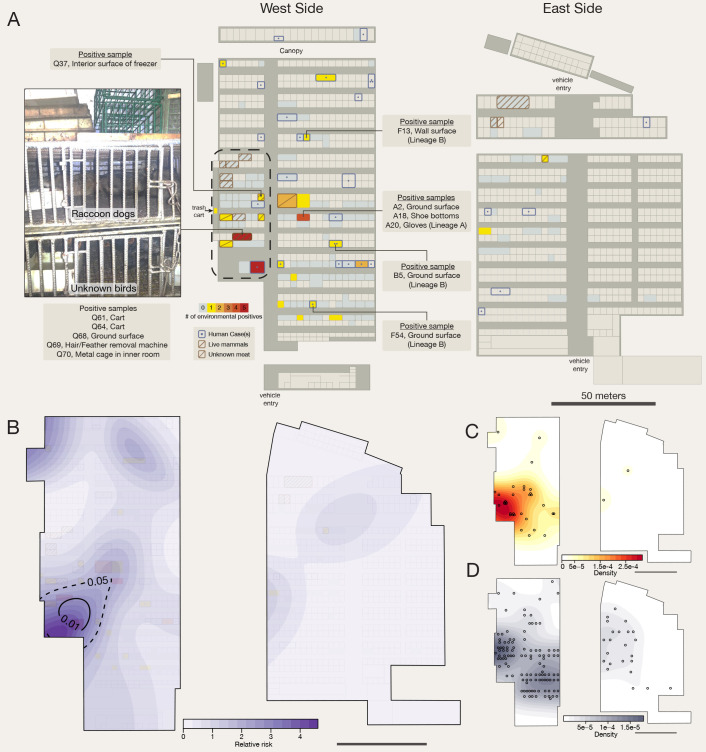
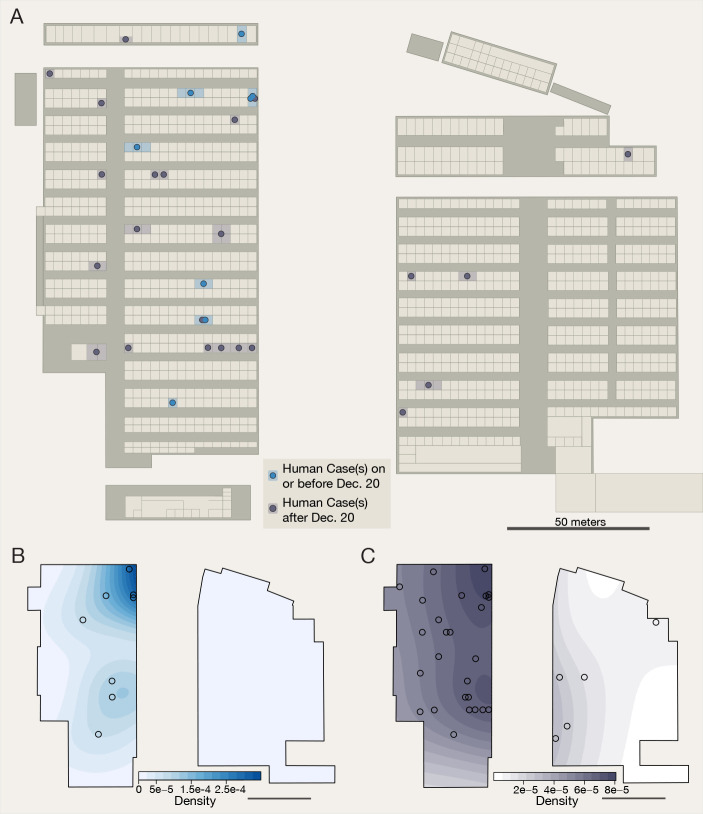
Understanding how severe acute respiratory syndrome coronavirus 2 (SARS-CoV-2) emerged in 2019 is critical to preventing future zoonotic outbreaks before they become the next pandemic. The Huanan Seafood Wholesale Market in Wuhan, China, was identified as a likely source of cases in early reports, but later this conclusion became controversial. We show here that the earliest known COVID-19 cases from December 2019, including those without reported direct links, were geographically centered on this market. We report that live SARS-CoV-2-susceptible mammals were sold at the market in late 2019 and that within the market, SARS-CoV-2-positive environmental samples were spatially associated with vendors selling live mammals. Although there is insufficient evidence to define upstream events, and exact circumstances remain obscure, our analyses indicate that the emergence of SARS-CoV-2 occurred through the live wildlife trade in China and show that the Huanan market was the epicenter of the COVID-19 pandemic.


Figures

Fig. 1.
Fig. 1.. Spatial patterns of COVID-19 cases in Wuhan in December 2019 and January-February 2020.
(A) Locations of the 155 cases we extracted from the WHO mission report ( 7 ). Inset: map of Wuhan with December 2019 case indicated with gray dots. (No cases are obscured by the inset.) In both the inset and the main panel the location of the Huanan market is indicated with a red square. (B) Probability density contours reconstructed by a kernel density estimate (KDE) using all 155 COVID-19 cases locations from December 2019. The highest density 50% contour marked is the area for which cases drawn from the probability distribution are as likely to lie inside as outside. Also shown are the highest density 25%, 10%, 5%, and 1% contours. Inset showing an expanded view and the highest density 1% probability density contour. (C) Probability density contours reconstructed using the 120 COVID-19 cases locations from December 2019 that were unlinked to the Huanan market. (D) Locations of 737 COVID-19 cases from Weibo data dating to January and February of 2020. (E) The same highest probability density contours (50% through 1%) for 737 COVID-19 case locations from Weibo data.
Fig. 2.
Fig. 2.. Spatial analyses.
(A) Inset: map of Wuhan, with gray dots indicating 1000 random samples from worldpop.com null distribution. Main panel: median distance between Huanan market and (1) worldpop.org null distribution shown with a black circle and (2) December cases shown by red circles (distance to Huanan market depicted in purple boxes). Center-point of Wuhan population density data shown by blue dot. Center-points of December case locations shown by red dots (‘all’, ‘linked’ and ‘unlinked’ cases); dark blue dot (lineage A cases); and yellow dot (lineage B cases). Distance from center-points to Huanan market depicted in orange boxes. (B) Schematic showing how cases can be near to, but not centered on, a specific location. We hypothesized that if the Huanan market epicenter of the pandemic then early cases should fall not just unexpectedly near to it but should also be unexpectedly centered on it (see Methods). The blue cases show how cases quite near the Huanan market could nevertheless not be centered on it. (C) Tolerance contours based on relative risk of COVID-19 cases in December, 2019 versus data from January-February 2020. The dots show the December case locations. The contours represent the probability of observing that density of December cases within the bounds of the given contour if the December cases had been drawn from the same spatial distribution as the January-February data.
Fig. 3.
Fig. 3.. Visitors to locations throughout Wuhan.
Number of social media check-ins in the Sina Visitor System from 2013-2014 as shared by ( 33 ). Number of visitors to individual markets throughout the city are shown in comparison to the Huanan market. Inset: the total number of check-ins to all individual locations across the city of Wuhan, grouped by category. Locations with more than 50 visitor check-ins are shown, and the locations which received more check-ins than the Huanan market in the same period are shown in red.
Fig. 4.
Fig. 4.. Map of the Huanan Wholesale Seafood Market.
(A) Aggregated environmental sampling and human case data from Huanan Market. Captions (left) describe the types of SARS-CoV-2 positive environmental samples obtained from known live animal vendors and (center) from stalls with samples with known virus lineage. Lineage is unknown unless noted; sequencing data has not been released for some samples and many samples were PCR-positive but not sequenced. Image (left) of raccoon dogs in a metal cage, on top of caged birds, taken in business with five positive environmental samples (photo credit: E.C.H.). Rectangle with dashed outline is used to denote the ‘wildlife’ section of the market. (B) Relative risk analysis of positive environmental samples. Tolerance contours enclose regions with statistically significant elevation in density of positive environmental samples relative to the distribution of sampled stalls. (C) Distribution of positive environmental samples. Sample locations (centroid of corresponding business) and quantity are shown as black circles. (D) Control distribution for relative risk analysis. All businesses investigated with environmental sampling are shown as black circles (one per business, whether or not a positive sample was found). See table S12 for details on stalls that were SARS-CoV-2-negative.
Fig. 5.
Fig. 5.. Location and timing of human cases in Huanan market.
(A) Outline colors correspond to the timing of the first known case in each business. Individual case timing is denoted by marker color and shown within the outlined business. (B) Distribution of known cases on or before December 20th, 2019. Locations of each case are shown as a black circle. (C) Distribution of all known human cases in Huanan Market. See table S11 for details on SARS-CoV-2 positive human cases with the Huanan market.

Comment in

Similar articles

Cited by

References

    1. Sina Finance, “Wuhan pneumonia of unknown cause cases isolated, test results to be announced ASAP” (Sina Finance, 2019); https://finance.sina.cn/2019-12-31/detail-iihnzahk1074832.d.html?from=wap.
    1. Wuhan Municipal Health Commission, “Wuhan Municipal Health Commission’s briefing on the current situation of pneumonia in our city” (Wuham Municipal Health Commission, 2019); https://web.archive.org/web/20200131202951/http:/wjw.wuhan.gov.cn/front/....
    1. World Health Organization, “COVID-19 – China” (WHO, 2020); https://www.who.int/emergencies/disease-outbreak-news/item/2020-DON229.
    1. The Novel Coronavirus Pneumonia Emergency Response Epidemiology Team , The epidemiological characteristics of an outbreak of 2019 novel coronavirus diseases (COVID-19) – China, 2020. China CDC Wkly 2, 113–122 (2020). 10.46234/ccdcw2020.032 - DOI - PMC - PubMed
    1. Worobey M., Dissecting the early COVID-19 cases in Wuhan. Science 374, 1202–1204 (2021). 10.1126/science.abm4454 - DOI - PubMed