. 2022 Sep 15;132(18):e159527.
doi: 10.1172/JCI159527.

CST6 suppresses osteolytic bone disease in multiple myeloma by blocking osteoclast differentiation

Affiliations

CST6 suppresses osteolytic bone disease in multiple myeloma by blocking osteoclast differentiation

Dongzheng Gai et al. J Clin Invest. .

Abstract

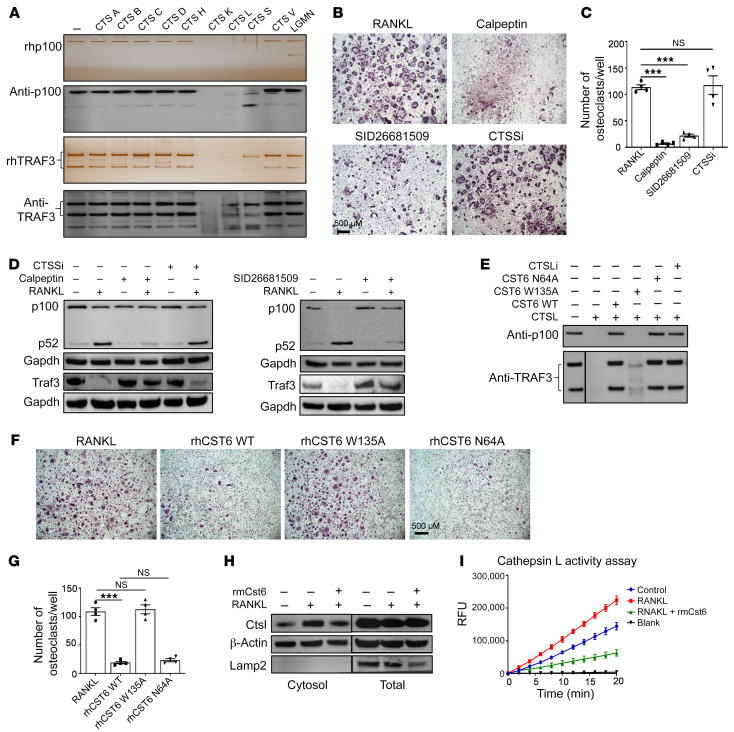
Osteolytic bone disease is a hallmark of multiple myeloma (MM). A significant fraction (~20%) of MM patients do not develop osteolytic lesions (OLs). The molecular basis for the absence of bone disease in MM is not understood. We combined PET-CT and gene expression profiling (GEP) of purified BM CD138+ MM cells from 512 newly diagnosed MM patients to reveal that elevated expression of cystatin M/E (CST6) was significantly associated with the absence of OL in MM. An enzyme-linked immunosorbent assay revealed a strong correlation between CST6 levels in BM serum/plasma and CST6 mRNA expression. Both recombinant CST6 protein and BM serum from patients with high CST6 significantly inhibited the activity of the osteoclast-specific protease cathepsin K and blocked osteoclast differentiation and function. Recombinant CST6 inhibited bone destruction in ex vivo and in vivo myeloma models. Single-cell RNA-Seq showed that CST6 attenuates polarization of monocytes to osteoclast precursors. Furthermore, CST6 protein blocks osteoclast differentiation by suppressing cathepsin-mediated cleavage of NF-κB/p100 and TRAF3 following RANKL stimulation. Secretion by MM cells of CST6, an inhibitor of osteoclast differentiation and function, suppresses osteolytic bone disease in MM and probably other diseases associated with osteoclast-mediated bone loss.

Keywords: Bone Biology; Bone disease; Cancer; Hematology; Osteoclast/osteoblast biology.


Figures

Figure 1
Figure 1. High expression of CST6 is linked to the absence of bone lesions in MM.
(A) Workflow of the study. BMMC, BM mononuclear cells. (B) Heatmap showing that 54 genes were significantly differentially expressed in MM cells from patients with no (n = 178) or 1 or more focal lesions (n = 334) on PET-CT (P < 0.0001). Shown are 17 genes with elevated levels of expression in MM cells from patients with no lesions on PET-CT and ranked from top to bottom by significance; and 37 genes with significantly upregulated expression in tumor cells with 1 or more lesions on PET-CT and ranked from bottom to top by significance. Gene symbols are listed on the right. (C) Affymetrix MAS5.0 normalized mRNA expression signal is indicated on the y axis. Expression level of CST6 in each sample is indicated by the height of the bar. Samples are ordered from the lowest to highest level of expression of CST6 from left to right on the x axis. P value was obtained using 2-tailed, unpaired Student’s t test. (D) Dot plot shows the correlation between CST6 mRNA in purified MM tumor cells and BM serum CST6 levels. The level of expression of CST6 mRNA was quantified by microarray analysis, and CST6 protein was measured by ELISA in 75 NDMM patients. Each spot indicates the relative relation of CST6 mRNA and protein expression levels for a patient. There was a significant correlation between the level of CST6 mRNA in MM cells and the level of CST6 protein in MM BM serum/plasma (r = 0.60, P < 0.0001). P value was obtained by Pearson’s correlation and a linear regression analysis.
Figure 2
Figure 2. CST6 protein inhibits bone destruction in 5TGM1-C57BL/KaLwRij MM mice.
(A) Schematic model for the MM mouse study. 5TGM1 murine MM cells were injected into 8-week-old C57BL/KaLwRij female mice via tail vein. rmCst6 protein was administered on day 5 after tumor inoculation. (B) Reconstructed μCT images of tibia sagittal sections show bone lytic lesions and trabecular architecture. (C) Bar plots present the number of bone lytic lesions on the right medial tibia surface and the trabecular bone parameters: BV/TV, Tb.N, Tb.Th, Tb.Sp, BMD. (D) TRAP staining shows osteoclasts (indicated with arrows) in tibiae derived from control C57BL/KaLwRij mice without injection of MM cells and C57BL/KaLwRij mice injected with 5TGM1 MM cells with or without rmCst6 treatment. Scale bar: 100 μm. (E) Bar plots represented histomorphometric analyses of TRAP-stained number of osteoclast per bone perimeter (N.Oc/B.Pm) and osteoclast surface per bone surface (Oc.S/BS). (F and G) Bar plots demonstrated serum levels of the bone-resorption marker CTX-1 and the bone-formation marker PINP detected by ELISA. (H) Tumor burden was assessed by measuring serum levels of IgG2b (mg/mL) by ELISA. Data are represented as mean ± SEM (n = 6 mice/group) and were analyzed by 1-way ANOVA with Tukey’s multiple comparisons (C and EH). *P < 0.05; **P < 0.01; ***P < 0.001.
Figure 3
Figure 3. CST6 protein inhibits osteoclast differentiation and function.
(A) Human OCPs were induced to differentiate into osteoclasts by addition of M-CSF and RANKL. 200 ng/mL rhCST6, 4 μg/mL anti-CST6 antibody, or nonspecific mouse IgG was added to the culture media (upper panels). BM serum from healthy donors and MM patients was added to the culture media with indicated CST6 concentrations (lower panels). On day 7, half of these wells in each group were stained with TRAP solution and the remaining wells were quantified resorption areas. Culture media containing high CST6 protein (final concentration 200 ng/mL) from patient 5 (P5) showed significant decreased TRAP+ osteoclasts and bone resorption, while culture media containing low CST6 protein from a healthy donor and patient 1 (P1) with low levels of CST6 did not show these effects. Anti-CST6 antibody or nonspecific mouse IgG (4 μg/mL) was also added to the culture media during human osteoclast differentiation. The CST6 level in each BM serum was determined by ELISA, as described in Supplemental Table 1. Control is represented for RANKL only and was the same as in Supplemental Figure 5 (n = 3). Scale bars: 500 μm. (B) Bar plots present quantifications of TRAP+ osteoclasts and bone-resorption areas. Numbers in parentheses represent CST6 concentrations in patient serum detected by ELISA. Data are represented as mean ± SEM and were analyzed by 2-way ANOVA (B). *P < 0.05, **P < 0.01, ***P < 0.001.
Figure 4
Figure 4. CST6 protein inhibits MM cell–induced bone resorption and CTSK activity.
(A) Ex vivo organ culture assay was utilized to examine the effect of Cst6 protein on MM-induced bone lesions on calvarias. H&E sections of the parietal bone region showing osteoclastic bone-resorption areas (black arrows) (n = 3). Scale bar: 100 μm. (B) Silver nitrate staining of calvariae showed the areas with light transparency reflecting bone-resorption areas (n = 3). Scale bar: 200 μm. (C) Bar plots show the ratio of lytic bone area number to bone surface (left panel) and the percentage of resorption area (right panel) in each group. (D) CTSK activity was measured by the Cathepsin K Drug Discovery Kit (Enzo). The y axis represents the CTSK activity expressed as relative fluorescence units (RFU); the x axis shows time points for treatment with CST6 proteins at different doses (n = 3). Data are represented as mean ± SEM. *P < 0.05; **P < 0.01; ***P < 0.001. Statistical analysis was performed using 2-tailed, unpaired Student’s t test (C).
Figure 5
Figure 5. CST6 protein suppresses bone-resorptive activity of mature osteoclasts.
(A) TRAP staining shows mature osteoclasts on bone slices (n = 3). Scale bar: 200 μm. (B) After a 3-day culture period, osteoclasts were removed from bone slices, resorption pits were visualized under the SEM, and resorption pit area was quantified (n = 3). Scale bar: 100 μm. (C) Bar plots show the quantification of TRAP+ osteoclasts and the bone-resorption area. Data are represented as mean ± SEM. **P < 0.01; ***P < 0.001. Statistical analysis was performed using 1-way ANOVA with Tukey’s multiple comparisons (C).
Figure 6
Figure 6. scRNA-Seq reveals that CST6 protein prevents osteoclast differentiation.
(A) Experimental workflow for scRNA-Seq on BM mononuclear cells. 5TGM1-GFP+ MM cells were injected into 8-week-old C57BL/KaLwRij female mice via tail i.v. Hind limbs were extracted, and BM mononuclear cells from individual mice were sorted out by depleting 5TGM1-GFP+ MM cells. (B) Uniform Manifold Approximation and Projection (UMAP) plot of BM mononuclear cells derived from healthy controls (n = 3) and MM-bearing mice treated with PBS (n = 3) or rmCst6 protein (n = 3). (C) Bar plots show the proportion of various cell types in BM mononuclear cells of healthy control and MM-bearing mice treated with PBS or rmCst6 protein. (D) UMAP plots of BM macrophages from healthy control (n = 3) and MM-bearing mice treated with PBS (n = 3) or rmCst6 protein (n = 3). (E) UMAP plots show expression patterns of marker genes for all clusters collected from 3 groups of mice. (F) KEGG pathway analyses show most dysregulated signaling pathways in the cluster M0. (G) KEGG pathway analyses show most dysregulated signaling pathways in the cluster M4.
Figure 7
Figure 7. CST6 protein selectively inhibits the noncanonical NF-κB signaling pathway induced by RANKL.
(A) Mouse OCP (OCP) cells preincubated with 200 ng/mL rmCst6 for 30 minutes were treated with RANKL for indicated times. Western blot shows the expression of Iκbα, p-p65, p65, p-Erk, Erk, p-p38, p38, p-Akt, and Akt (n = 3). (B) OCPs preincubated with 200 ng/mL rmCst6 for 30 minutes were treated with RANKL for 8 hours. Western blots show the expression of p100/p52 and Traf3 (n = 3). (C) Heatmap shows 1796 differentially expressed genes (DEGs) between OCPs (control) and OCPs treated with RANKL without or with rmCst6 for 48 hours. (n = 3). (D) A schematic model for osteoclast differentiation and CST6 functions. Red-labeled genes were significantly downregulated by CST6 protein and are shown in E. (E) Heatmap shows osteoclast differentiation–associated genes in OCPs (control) and OCPs treated with RANKL without or with rmCst6 for 48 hours. (F) Western blot shows the expression of c-fos, Nfatc-1, and CTSK after treatment with rmCst6 at indicated time points in the presence of RANKL (n = 3). See complete unedited blots in the supplemental material.
Figure 8
Figure 8. CST6 protein suppresses CTSL-induced proteolytic cleavages of p100 and TRAF3 during osteoclastogenesis.
(A) Western blots and silver stain show cleaved p100 and TRAF3 proteins (n = 3). (B) TRAP staining shows osteoclastogenesis suppressed by CTSL inhibitors. Scale bar: 500 μm. (C) Bar plots show quantification of TRAP+ osteoclasts (n = 3). (D) OCPs preincubated with 10 μM CTSL inhibitors and CTSS inhibitor for 30 minutes were treated with RANKL for 8 hours. Western blots show the expression of p100, p52, and Traf3 (n = 3). (E) 20 ng CTSL protein premixed with 20 ng WT or mutant CST6 protein was loaded with recombinant p100 protein and TRAF3 protein in vitro for 30 minutes. Western blots detected the cleaved p100 and TRAF3 proteins (n = 3). CTSL inhibitor (CTSLi) was used as a positive control. (F) TRAP staining shows osteoclasts treated with 200 ng/mL WT or mutant rhCST6 (n = 3). Scale bar: 500 μm. (G) Bar plots show quantification of TRAP+ osteoclasts. (H) Western blots detected increased cytosolic CTSL protein after RANKL induction (n = 3). (I) CTSL enzymatic activity assay detected CTSL activity from cytosolic protein. The y axis represents the CTSL activity expressed as relative fluorescence units; the x axis shows time points treated with Cst6 proteins and different controls (n = 3). Lanes were run on the same gel, but were noncontiguous (E and H). Data are represented as mean ± SEM and were analyzed by 1-way ANOVA with Tukey’s multiple comparisons (C and G). ***P < 0.001. See complete unedited blots in the supplemental material.
Figure 9
Figure 9. Internalized CST6 protein suppresses CTSL activity in macrophages.
(A) Macrophages were treated with AF488-labeled rmCst6 for 8 hours and then were costained with CTSL and LysoTracker. Confocal microscope showed the localization of CST6, CTSL, and lysosome (n = 3). Scale bar: 10 μm. Original magnification, ×100 (far right panels). (B) CTSL enzyme activity assay detected CTSL activity from total protein after treatment with rmCst6. The y axis represents the CTSL activity expressed as relative fluorescence units; the x axis shows time points of treatment with Cst6 proteins and different controls (n = 3).

References

    1. Roodman GD. Pathogenesis of myeloma bone disease. Leukemia. 2009;23(3):435–41. doi: 10.1038/leu.2008.336. - DOI - PubMed
    1. Tian E, et al. The role of the Wnt signaling antagonist DKK1 in the development of osteolytic lesions in multiple myeloma. N Engl J Med. 2003;349(26):2483–2494. doi: 10.1056/NEJMoa030847. - DOI - PubMed
    1. Spencer GJ, et al. Wnt signalling in osteoblasts regulates expression of the receptor activator of NFkappaB ligand and inhibits osteoclastogenesis in vitro. J Cell Sci. 2006;119(7):1283–1296. doi: 10.1242/jcs.02883. - DOI - PubMed
    1. Qiang Y-W, et al. Myeloma-derived Dickkopf-1 disrupts Wnt-regulated osteoprotegerin and RANKL production by osteoblasts: a potential mechanism underlying osteolytic bone lesions in multiple myeloma. Blood. 2008;112(1):196–207. doi: 10.1182/blood-2008-01-132134. - DOI - PMC - PubMed
    1. Colditz J, et al. Postnatal skeletal deletion of Dickkopf-1 increases bone formation and bone volume in male and female mice, despite increased sclerostin expression. J Bone Miner Res. 2018;33(9):1698–1707. doi: 10.1002/jbmr.3463. - DOI - PubMed

Publication types

MeSH terms

LinkOut - more resources