. 2022 Aug 2;119(31):e2204407119.
doi: 10.1073/pnas.2204407119. Epub 2022 Jul 26.

Monitoring glycolytic dynamics in single cells using a fluorescent biosensor for fructose 1,6-bisphosphate

Affiliations

Monitoring glycolytic dynamics in single cells using a fluorescent biosensor for fructose 1,6-bisphosphate

John N Koberstein et al. Proc Natl Acad Sci U S A. .

Abstract

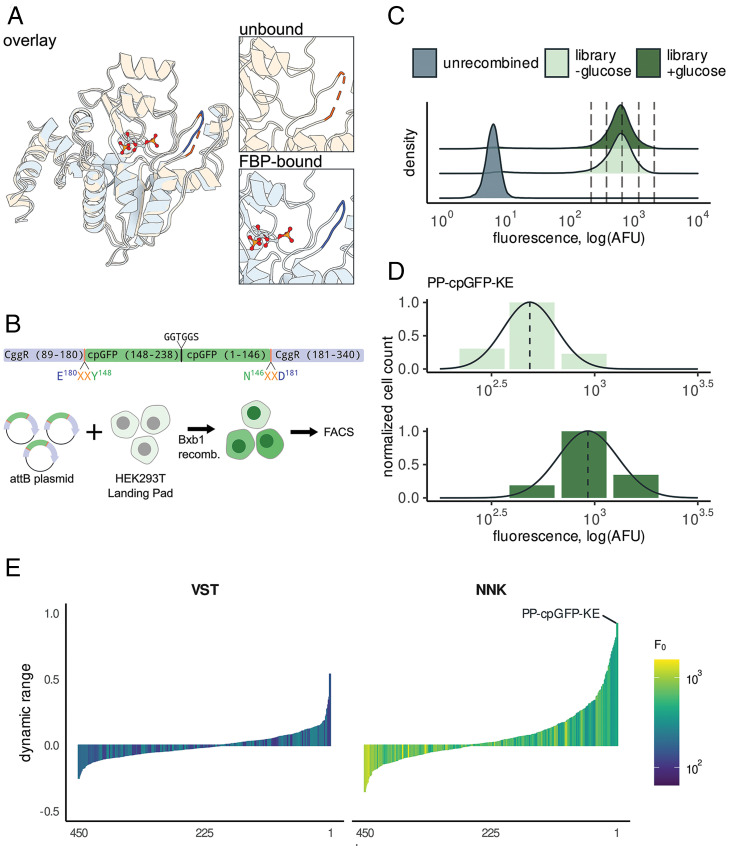
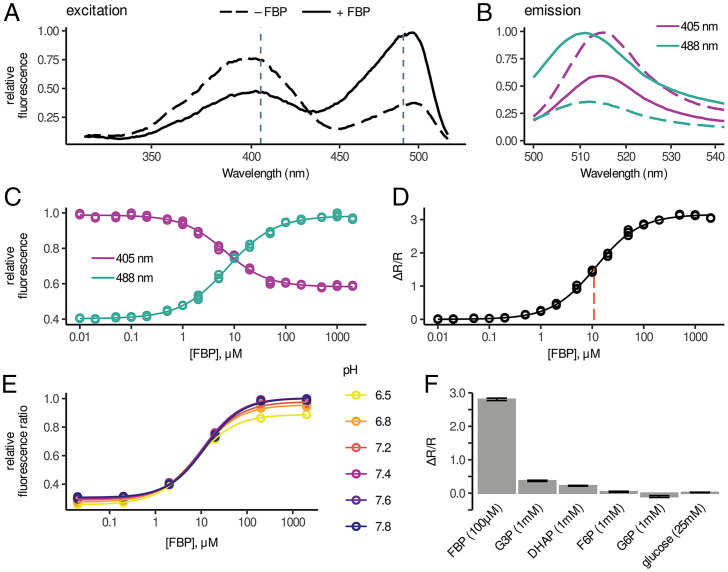
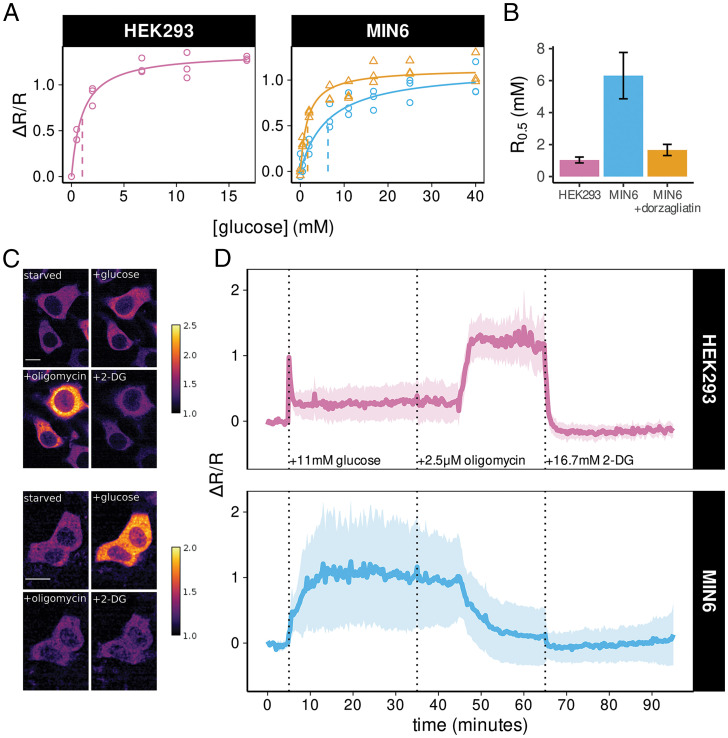
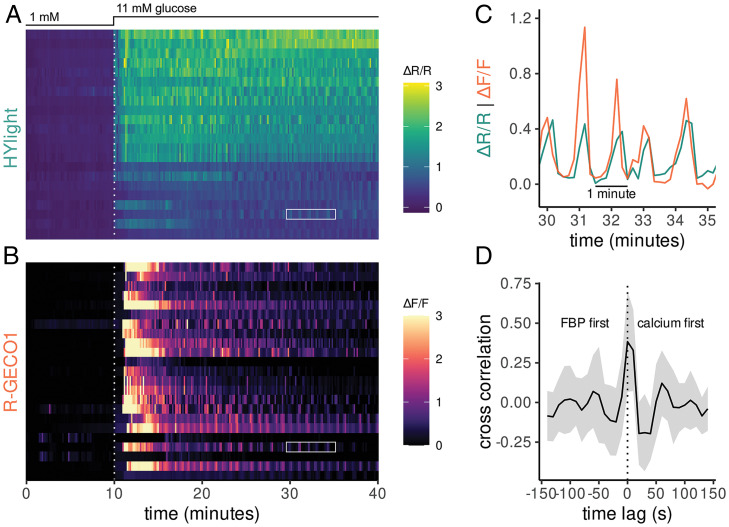
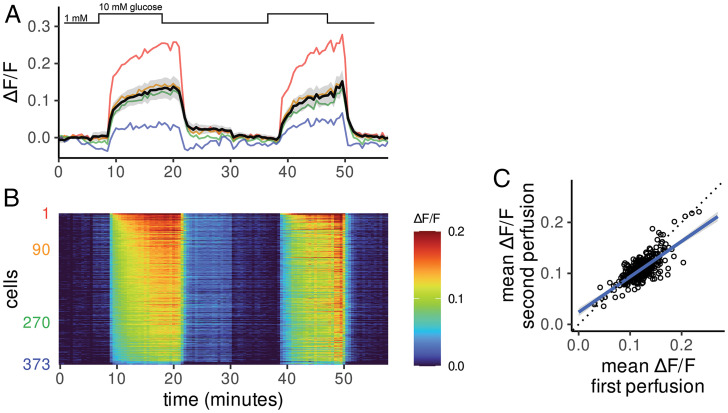
Cellular metabolism is regulated over space and time to ensure that energy production is efficiently matched with consumption. Fluorescent biosensors are useful tools for studying metabolism as they enable real-time detection of metabolite abundance with single-cell resolution. For monitoring glycolysis, the intermediate fructose 1,6-bisphosphate (FBP) is a particularly informative signal as its concentration is strongly correlated with flux through the whole pathway. Using GFP insertion into the ligand-binding domain of the Bacillus subtilis transcriptional regulator CggR, we developed a fluorescent biosensor for FBP termed HYlight. We demonstrate that HYlight can reliably report the real-time dynamics of glycolysis in living cells and tissues, driven by various metabolic or pharmacological perturbations, alone or in combination with other physiologically relevant signals. Using this sensor, we uncovered previously unknown aspects of β-cell glycolytic heterogeneity and dynamics.

Keywords: fructose 1,6-bisphosphate; glycolysis; β-cells.


Conflict of interest statement

Competing interest statement: P.J.S.S. and J.A. were coauthors on a 2018 conference report.

Figures

Fig. 1.
Fig. 1.
Discovery of a high dynamic-range FBP biosensor by sort-seq assay. (A) Structural comparison of CggR in apo state (PDB ID code 2OKG, orange) vs. FBP bound (PDB ID code 3BXF, blue) reveals a loop (residues 177 to 183) that undergoes a disorder-to-order transition upon binding FBP (6). (B) A library of linker variants were assayed for function in HEK293T Landing Pad cells. Circularly permuted GFP was inserted into CggR at residue 180 with two flanking linker amino acids on either side. Linker amino acids were encoded by the degenerate codon VST, which translates to a limited set of 8 amino acids, or by the fully degenerate codon NNK, which includes all 20 amino acids. The library was placed into an attB plasmid that enables genomic recombination into the HEK293T Landing Pad genome by the Bxb1 recombinase. (C) Fluorescence distributions of the CggR-180-NNK library expressed in HEK293T cells exposed to 0 mM or 25 mM glucose. Dotted lines indicate the bins used for sort-seq. (D) The number of cells sorted into each bin is indicated by bar height along with the maximum-likelihood density estimates for the variant with the highest dynamic range, CggR-180-PP-cpGFP-KE (HYlight). (E) Dynamic-range (ΔF/F) estimates for all variants after screening libraries with linker residues substituted with amino acids encoded by a limited set using VST codons (Left) or fully degenerate NNK codons (Right). See also SI Appendix, Fig. S1.
Fig. 2.
Fig. 2.
In vitro characterization of HYlight. (A) Excitation spectra from HYlight in the presence (solid) and absence (dashed) of 1 mM FBP. (B) Emission spectra from HYlight in the presence and absence of 1 mM FBP. Dashed lines indicate excitation set at 405 nm while solid lines indicate excitation set at 488 nm. (C) Normalized HYlight emission induced by excitation at 405 nm (purple) or 488 nm (cyan) as a function of FBP concentration. (D) Relative change of the fluorescence ratio (ΔR/R) resulting from 488- and 405-nm excitation as a function of [FBP]. (E) Fluorescence ratio as a function of pH across FBP concentrations. (F) Relative HYlight fluorescence ratio for FBP compared to other glycolytic metabolites. See also SI Appendix, Fig. S2.
Fig. 3.
Fig. 3.
HYlight imaging reveals differences in metabolic phenotype between HEK293 and MIN6 cells. (A) HYlight fluorescence ratio as a function of glucose concentration follows Michaelis–Menten kinetics. Differences in the magnitude of maximal change and R0.5 are observed between HEK293 (purple), MIN6 (blue), and MIN6 cells treated with dorzagliatin (orange). Each point represents the median fluorescence ratio across cells measured by flow cytometry relative to cells incubated in 0 mM glucose. Lines indicate fitted Michaelis–Menten equation with R0.5 shown as a vertical dashed line. (B) Comparison of R0.5 estimates ± SE for HEK293 (1.0 ± 0.24 mM), MIN6 (6.4 ± 1.6mM), and MIN6 cells treated with 10 µM dorzagliatin (1.28 ± 0.22 mM). (C) Example of fluorescence ratiometric images in HEK293 cells (Upper) and MIN6 cells (Lower) after 1 h of glucose starvation and following addition of 11 mM glucose, 2.5 μM oligomycin, and 16.7 mM 2-DG. The scale bars in the photomicrographs represent 10 microns. (D) Quantification of the change in fluorescence ratio (ΔR/R) for HEK293 cells (Upper, n = 67 cells over 3 separate experiments) and MIN6 cells (Lower, n = 222 cells over 3 separate experiments) following the metabolic perturbations shown in C. ΔR/R was normalized to the glucose-starved state at the beginning of each experiment. Solid line represents the mean across cells while shaded ribbon represents the mean ± SD. In MIN6 cells, oscillations around the mean contribute to the increased cell-to-cell variability in fluorescence ratio over time. See also SI Appendix, Fig. S3.
Fig. 4.
Fig. 4.
Multiplexed fluorescence imaging of HYlight and R-GECO uncovers temporal relationships between FBP and Ca2+ in MIN6 cells. (A) HYlight fluorescence ratio measured in MIN6 cells following an increase from 1 to 11 mM glucose. (B) R-GECO fluorescence measured in the same cells as A revealed a delayed increase in Ca2+ relative to FBP. (C) The HYlight fluorescence ratio and R-GECO fluorescence for a single cell indicated by white boxes in A and B. Oscillations in both signals occur synchronously. (D) The cross-correlation of R-GECO and HYlight signal following glucose stimulation (t = 20 to 40 min) averaged over all cells with a shaded ribbon representing the mean ± the SD. The maximum cross-correlation occurs in simultaneous frames or at a one-frame (15 s) lag with the R-GECO signal preceding HYlight.
Fig. 5.
Fig. 5.
HYlight uncovers heterogeneity among β-cells in response to glucose. (A) β-Cells within an isolated islet imaged with repeated cycling between 1 and 10 mM glucose. The solid black line and the gray-shaded region represent the mean ± SD, respectively. Four traces from example cells are shown as colored lines corresponding to the maximum (red) and minimum (blue) glucose-stimulated fluorescence change along with two cells exhibiting intermediates responses (orange and green). (B) Heatmap of fluorescence changes (ΔF/F represented by color) where each row represents a single cell quantified over time. Cells are ordered from numerical ranks on the y axis. (C) The mean change in fluorescence ratio during the first and second exposure to 10 mM glucose is heterogeneous across cells but consistent within individual cells over time (R = 0.75). The blue line represents a linear regression fit, while dotted black indicates the unity line.

References

    1. Harden A., Young W., The alcoholic ferment of yeast-juice. Proc. Royal Soc. B 77, 405–420 (1906).
    1. Bley Folly B., et al. , Assessment of the interaction between the flux-signaling metabolite fructose-1,6-bisphosphate and the bacterial transcription factors CggR and Cra. Mol. Microbiol. 109, 278–290 (2018). - PubMed
    1. Kochanowski K., et al. , Functioning of a metabolic flux sensor in Escherichia coli. Proc. Natl. Acad. Sci. U.S.A. 110, 1130–1135 (2013). - PMC - PubMed
    1. Monteiro F., et al. , Measuring glycolytic flux in single yeast cells with an orthogonal synthetic biosensor. Mol. Syst. Biol. 15, e9071 (2019). - PMC - PubMed
    1. Tanner L. B., et al. , Four key steps control glycolytic flux in mammalian cells. Cell Syst. 7, 49–62.e8 (2018). - PMC - PubMed

Publication types

LinkOut - more resources