. 2022 Aug 2;119(31):e2107942119.
doi: 10.1073/pnas.2107942119. Epub 2022 Jul 26.

Ca2+ imaging of self and other in medial prefrontal cortex during social dominance interactions in a tube test

Affiliations

Ca2+ imaging of self and other in medial prefrontal cortex during social dominance interactions in a tube test

Nuria Garcia-Font et al. Proc Natl Acad Sci U S A. .

Abstract

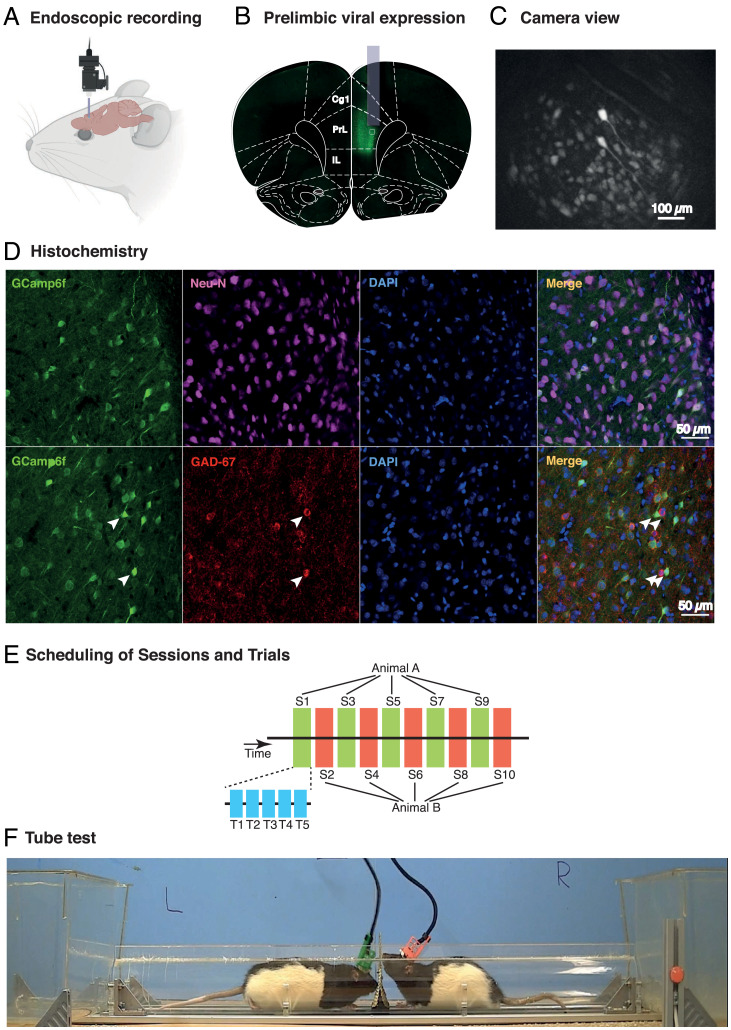
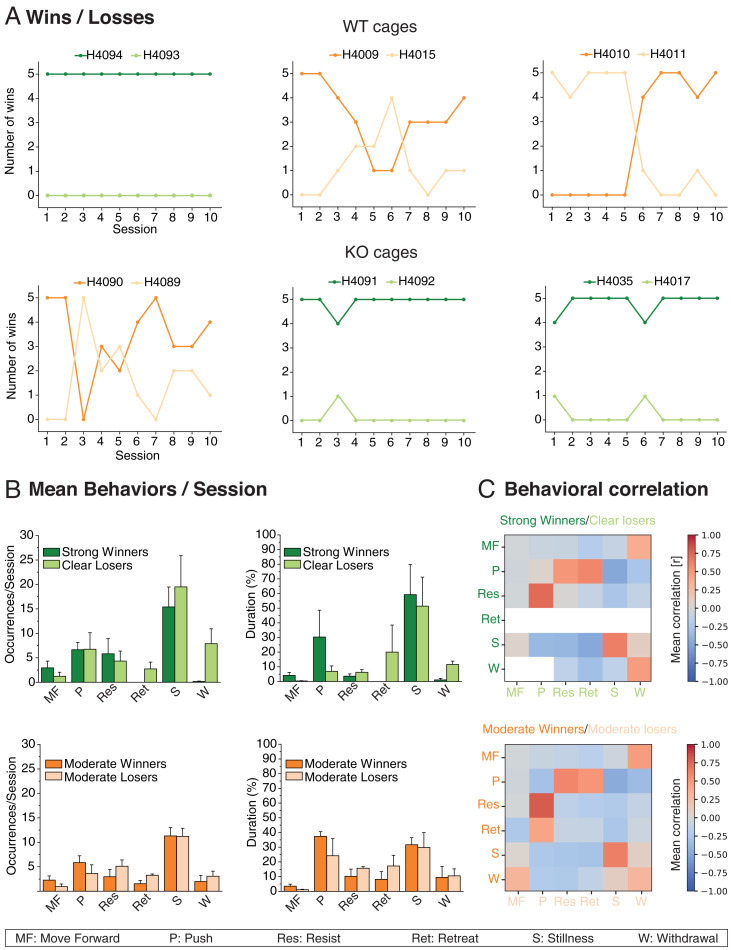
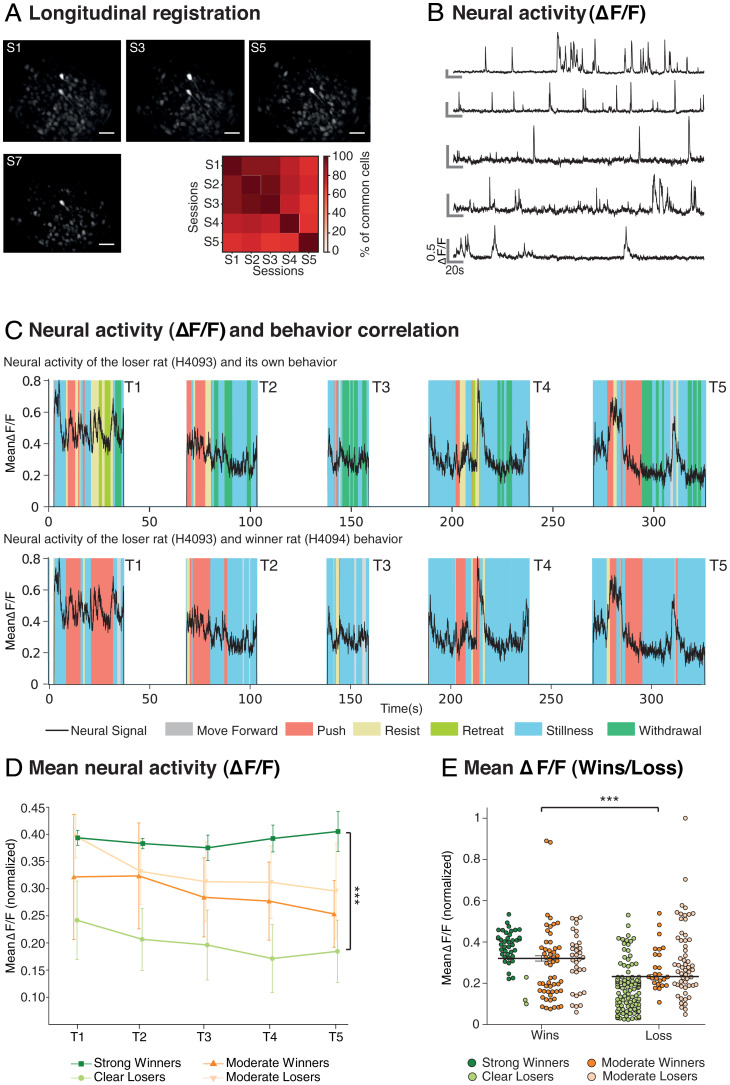
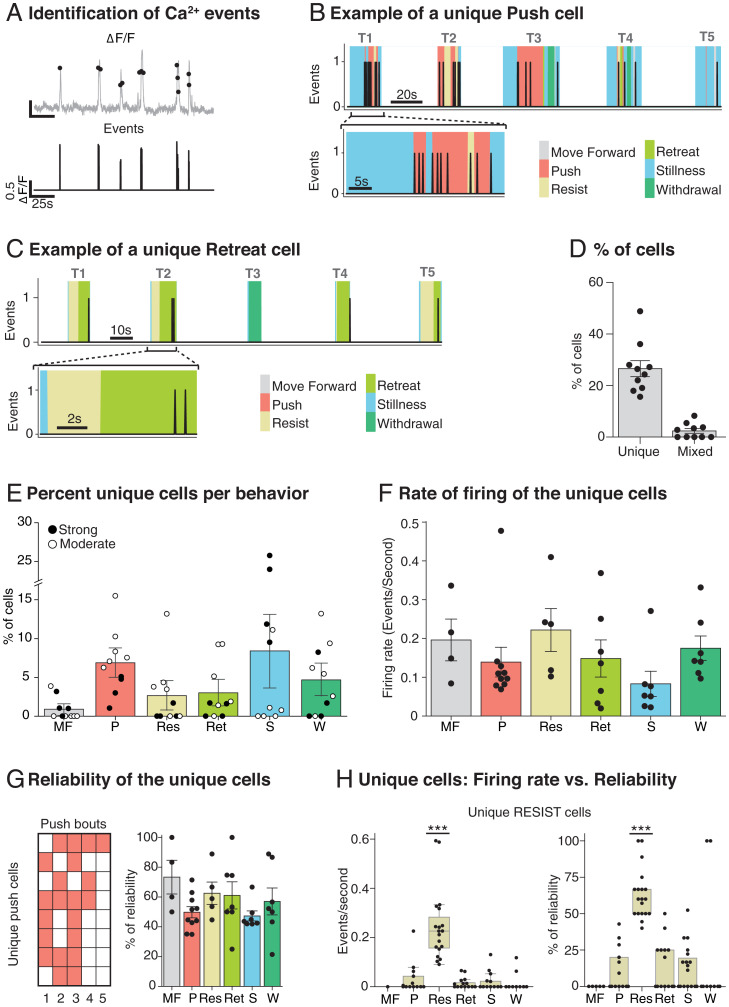
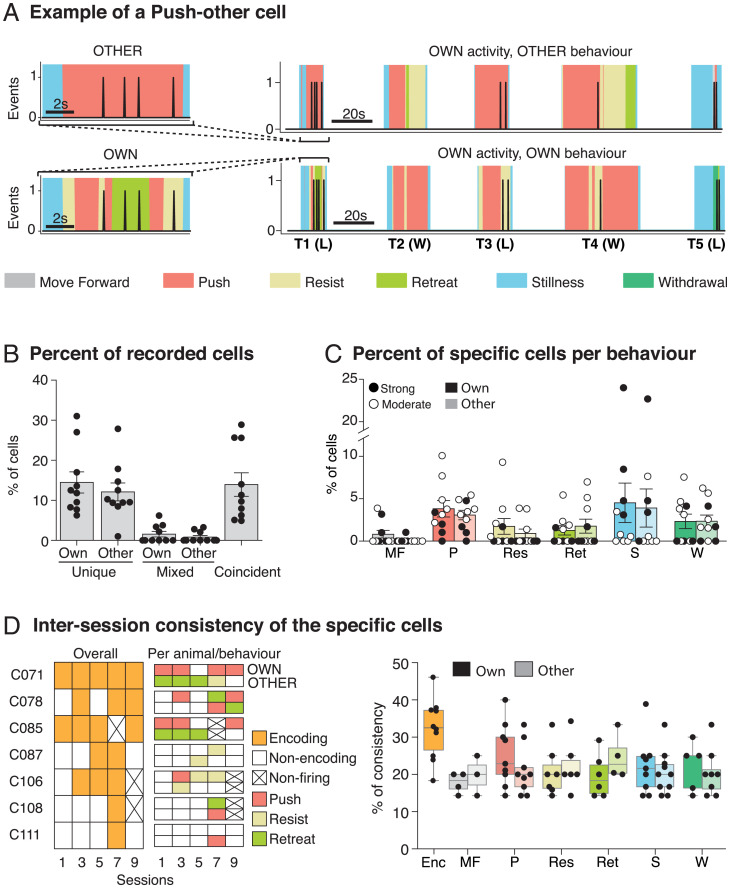
The study of social dominance interactions between animals offers a window onto the decision-making involved in establishing dominance hierarchies and an opportunity to examine changes in social behavior observed in certain neurogenetic disorders. Competitive social interactions, such as in the widely used tube test, reflect this decision-making. Previous studies have focused on the different patterns of behavior seen in the dominant and submissive animal, neural correlates of effortful behavior believed to mediate the outcome of such encounters, and interbrain correlations of neural activity. Using a rigorous mutual information criterion, we now report that neural responses recorded with endoscopic calcium imaging in the prelimbic zone of the medial prefrontal cortex show unique correlations to specific dominance-related behaviors. Interanimal analyses revealed cell/behavior correlations that are primarily with an animal's own behavior or with the other animal's behavior, or the coincident behavior of both animals (such as pushing by one and resisting by the other). The comparison of unique and coincident cells helps to disentangle cell firing that reflects an animal's own or the other's specific behavior from situations reflecting conjoint action. These correlates point to a more cognitive rather than a solely behavioral dimension of social interactions that needs to be considered in the design of neurobiological studies of social behavior. These could prove useful in studies of disorders affecting social recognition and social engagement, and the treatment of disorders of social interaction.

Keywords: endoscopic imaging; prefrontal cortex; rodents; social dominance; tube test.


Conflict of interest statement

The authors declare no competing interest.

Figures

Fig. 1.
Fig. 1.
Calcium imaging in rats during social dominance interactions in the tube test. (A) Cartoon depicting detachable miniature endoscope (Inscopix) that is placed daily into a head-mounted baseplate cemented to the skull. (B) Photomicrograph of viral expression of GCamp6f colocalized on a coronal section from Paxinos and Watson brain atlas at the AP location of the prelimbic zone (PrL) of mPFC, together with superimposed image of typical location of a GRIN lens. (C) Representative camera view of PrL neurons during a behavioral session (Scale bar, 100 μm. based on the size of the sensor provided by Inscopix (1050x650μm equivalent to 1280x800pixels). (D) Higher-power images of GCamp6f expression in single cells (Left), Neu-N staining (Left Middle Top) and GAD-67 (Left Middle Bottom), DAPI (Right Middle), and exemplar superpositions (Right). (Scale bar, 50 μm.) (E) Recordings were taken from the two animals on alternate sessions in the tube test experiments consisting of five trials per session. With only one camera, recordings were taken from odd-numbered sessions for one animal and even-numbered sessions for the other. (F) Two Lister-hooded male rats in the tube test, each wearing the iHELMET that serves to protect the endoscopic from physical interaction with the other animal (18).
Fig. 2.
Fig. 2.
Behavioral analysis. (A) Timeline across 10 sessions of the six pairs of animals—three WT and three FXS. Note the strong dominance in three pairs of animals but a more varied and moderate pattern of dominance in the other three pairs. (B) Number of occurrences of behaviors per five trial sessions over 10 sessions averaged for the three strongly dominant cages (Top, green) and the three more moderate dominance cages (Bottom, orange). Note predominance of periods of STILLNESS, that RETREAT and WITHDRAWAL were not seen in the strongly dominant animals, and that there was a more uniform pattern across winners and losers in the case of moderate dominance. (C) Correlation matrix showing probability of behavior of animal A as a function of the cooccurrence of different behaviors in animal B (and vice versa). Note high PUSH/RESIST correlations, and absence of RETREAT and WITHDRAWAL in strongly dominant animals. Means ±1 SEM.
Fig. 3.
Fig. 3.
Neural activity in identified regions of interest. (A) Mean Longitudinal registration of the animals across five sessions (S1 to S5, n = 11) and exemplar of longitudinal registration of ROIs with respect to maximal fluorescence in individual animals within each session (Inscopix) across four sessions. ROIs are hereafter referred to as “cells.” Note the decline of likelihood of longitudinal registration across multiple sessions (Scale bar, 100 μm.). (B) Neural activity (ΔF/F) of an exemplar series of five individual cells showing the typical sharp rise time of luminance and slower decay time. These two parameters are conflated in any computation of mean neural activity. (C) Mean neural activity on each of five trials of a daily session aligned to an animal’s own behavior (H4093, Top) or to the observed behavior of the other animal (H4094, Bottom). Note the striking peak during PUSH and RESIST” (respectively), and sometimes during STILLNESS, as outlined in the text. Respective behaviors are color coded beneath the two images. (D) Normalized mean neural activity (ΔF/F) averaged across all cells and each of the five daily trials, categorized with respect to whether the animals were strongly dominant/clearly submissive or were displaying more moderate dominance (n = 11, ns = 2, 3, 3, and 3, respectively). A difference in mean neural activity is shown as a function of the strength of dominance. (E) Normalized mean neural activity (ΔF/F) averaged across all winning and losing trials. Note that it confirms that the mean ΔF/F is related to the strength of the dominance status (n = 11). (***P < 0.0001). Means ±1 SEM.
Fig. 4.
Fig. 4.
Identification of Ca2+ events and their correlation with behavior. (A) Event identification software takes the smoothed ΔF/F time signal (Top, gray); it identifies discrete events that cross a predefined threshold (Top, black dots) and time stamps these events (Bottom). (B) Exemplar of a unique PUSH cell activity during one session (Top) and in one expanded trial (Bottom). All the behaviors are represented with different colors. Note that the activity of the cell clearly overlaps with the PUSH behavior. (C) Exemplar of the distinct category of a unique RETREAT cell activity during one session (Top) and in one expanded trial (Bottom). (D) Percentage of recorded cells classified as unique (26.6% ± 3.1, n = 10) and mixed (2.4 % ±0.9, n = 10). (E) Percentages of cells classified as unique for one behavior. Note that the moderate animals (white dots) have more cells per behavior, except for STILLNESS (n = 10). (F) Rate of firing of the unique cells. Note that, despite STILLNESS being the most frequent behavior and having the highest number of specific cells, its mean firing rate is low. (G) Reliability of the unique cells inside a session. (H) Firing rate vs. reliability plots of the unique-RESIST cells across all the behaviors. Each session was treated independently with cells pooled across sessions. Note that the values are clearly higher for the behavior that they are encoding, which illustrates a complementary way of establishing the correct behavior classification of these cells (***P < 0.0001, n = 19). Means ±1 SEM.
Fig. 5.
Fig. 5.
Identification of Ca2+ events and their correlation with the behavior of the other animal. (A) Exemplar of a PUSH-other cell activity across one session compared to the other animal behavior (Top Right) and the own animal behavior (Bottom Right) and expanded trials (Left) that show that the cell is active only when the other animal pushes (Top). Note that the imaged animal (H4089) is the winner (W) in T2 and T4 and is the loser (L) in T1, T3, and T5, since this rat is a moderate loser. (B) Percentages of recorded cells classified as specific for own, other, and coincident behaviors (n = 10). (C) Percentages of cells per behavior distinguishing between own and other behavior. Note that the percentages are quite similar between own and other and that the moderate dominance animals have more specific cells per behavior, except for STILLNESS (n = 10). (D) Consistency of the specific cells across sessions. (Left, ’Per session. Example of a single rat’) The overall consistency of seven exemplar cells from a single animal across five sessions (S1, S3, S5, S7 and S9) and the specific encoding per animal (OWN and OTHER) and behavior. (Right, ’Per behavior’) The overall consistency and the consistency per behavior. Note that the consistency of the encoding cells (30%, orange) and the consistency per behavior (20%, various colors) are much lower than the reliability values in Fig. 4 (n = 10). Means ±1 SEM.

Similar articles

Cited by

References

    1. Ricceri L., Moles A., Crawley J., Behavioral phenotyping of mouse models of neurodevelopmental disorders: Relevant social behavior patterns across the life span. Behav. Brain Res. 176, 40–52 (2007). - PubMed
    1. Crawley J. N., What’s Wrong with My Mouse? Behavioral Phenotyping of Transgenic and Knockout Mice (Wiley, Hoboken, NJ, ed. 2, 2006).
    1. Lindzey G., Winston H., Manosevitz M., Social dominance in inbred mouse strains. Nature 191, 474–476 (1961). - PubMed
    1. Fan Z., et al. , Using the tube test to measure social hierarchy in mice. Nat. Protoc. 14, 819–831 (2019). - PubMed
    1. Wang F., et al. , Bidirectional control of social hierarchy by synaptic efficacy in medial prefrontal cortex. Science 334, 693–697 (2011). - PubMed

Publication types

LinkOut - more resources