. 2022 Aug 4;126(30):4915-4930.
doi: 10.1021/acs.jpca.2c02017. Epub 2022 Jul 26.

Tracking Energy Transfer across a Platinum Center

Affiliations

Tracking Energy Transfer across a Platinum Center

Tammy X Leong et al. J Phys Chem A. .

Abstract

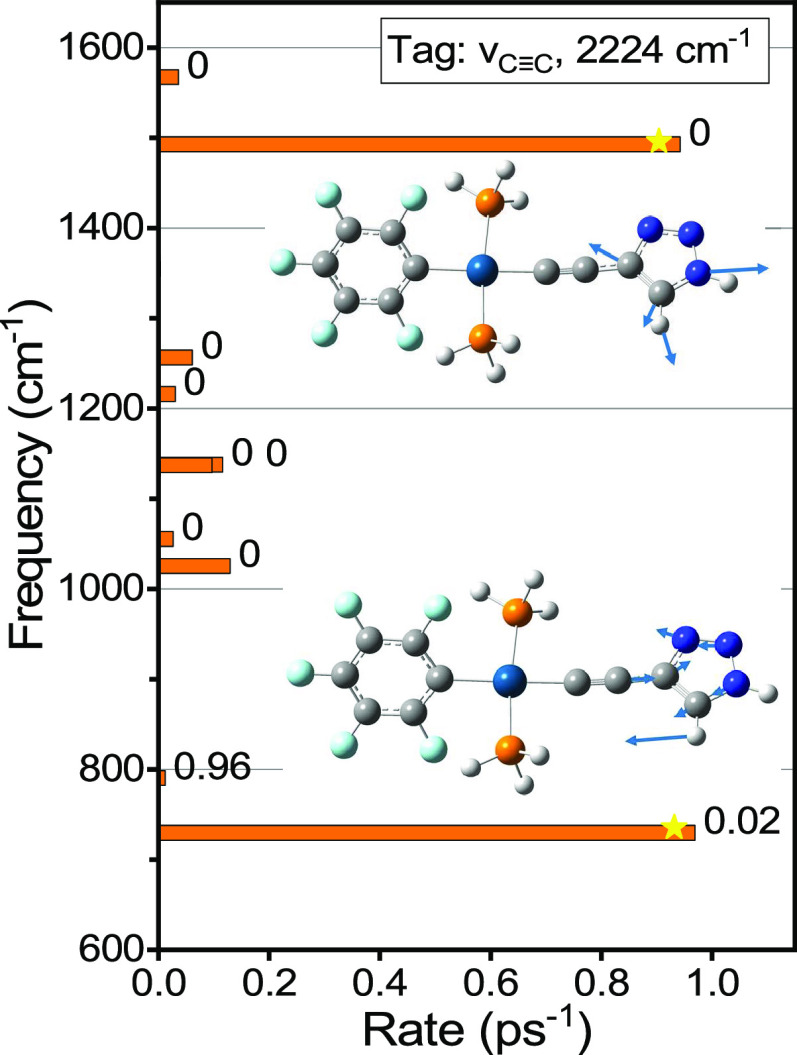
Rigid, conjugated alkyne bridges serve as important components in various transition-metal complexes used for energy conversion, charge separation, sensing, and molecular electronics. Alkyne stretching modes have potential for modulating charge separation in donor-bridge-acceptor compounds. Understanding the rules of energy relaxation and energy transfer across the metal center in such compounds can help optimize their electron transfer switching properties. We used relaxation-assisted two-dimensional infrared spectroscopy to track energy transfer across metal centers in platinum complexes featuring a triazole-terminated alkyne ligand of two or six carbons, a perfluorophenyl ligand, and two tri(p-tolyl)phosphine ligands. Comprehensive analyses of waiting-time dynamics for numerous cross and diagonal peaks were performed, focusing on coherent oscillation, energy transfer, and cooling parameters. These observables augmented with density functional theory computations of vibrational frequencies and anharmonic force constants enabled identification of different functional groups of the compounds. Computations of vibrational relaxation pathways and mode couplings were performed, and two regimes of intramolecular energy redistribution are described. One involves energy transfer between ligands via high-frequency modes; the transfer is efficient only if the modes involved are delocalized over both ligands. The energy transport pathways between the ligands are identified. Another regime involves redistribution via low-frequency delocalized modes, which does not lead to interligand energy transport.


Conflict of interest statement

The authors declare no competing financial interest.

Figures

Chart 1
Chart 1. Structures of C2 (n = 1) and C6 (n = 3)
Figure 1
Figure 1
Solvent-subtracted infrared absorption spectra of compounds C2 and C6 in CDCl3. The spectrum of C6 was scaled by a factor of ca. 1.2 to match that of C2.
Figure 2
Figure 2
DFT-computed uncorrected line spectra for C6 (A) and frequency-corrected line spectra for C6 (B) and C2 (C). The modes associated with F5Ph-, Cn-Tri, and Tol moieties are shown in red, blue, and green, respectively. Experimental linear absorption spectra for C6 (A, B) and C2 (C) in CDCl3 are shown with gray lines. Theoretical spectra of C2 (C) and C6 (B) obtained from applying a Lorentzian line shape with a full width at half maximum of 8.1 cm–1 are shown with orange lines. The Y-axes report the DFT-computed IR intensities (km/mole) for the line spectra. The experimental FTIR spectra in panels B and C (gray lines) were normalized to visually match the theoretical spectra.
Figure 3
Figure 3
(A) 2DIR magnitude spectrum of C2 at T = 2.7 ps (see Figure S4 for C6). The magenta boxes show the integration windows for obtaining the waiting-time traces in panels (B–F). (B–F) Waiting-time traces for indicated cross peaks for C2 (blue lines) and C6 (green lines). The traces were fitted with an asymmetric double sigmoidal function (cyan lines for C2 and red for C6, see Experimental Details). Tmax values are shown in the graphs with matching colors.
Figure 4
Figure 4
(A) 2DIR magnitude spectrum of C6 at T = 2.0 ps (see Figure S5 for C2). The magenta boxes show the integration windows for obtaining the waiting-time traces in panels (B–D). (B–D) Waiting-time traces for indicated cross peaks for C2 (blue lines) and C6 (green lines). The traces were fitted with an asymmetric double sigmoidal function (cyan lines for C2 and red lines for C6, see Experimental Details). Tmax values are shown in the graphs with matching colors.
Figure 5
Figure 5
Scaled waiting-time traces for indicated diagonal and cross peaks for C6 (see Figure S6 for C2). (A) Results of individual fits of T-traces of diagonal peaks (red lines) are shown in Table 4. The insets in A and B show 2DIR spectra measured at 2.3 ps with color-matching boxes indicating the cross-peak integration regions. (B) 1600/1600 and 1600/1570 peaks were fitted globally with a double-exponential decay function (red lines) resulting in t1 = 1.06 ± 0.06 ps and t2 = 27 ± 2 ps and amplitudes of the fast component of 55% for 1600/1600 and 45% 1600/1570.
Figure 6
Figure 6
Waiting-time dependence of the indicated cross peaks for C6. The inset shows the 2DIR spectrum measured at 4.3 ps with color-matching boxes indicating the cross-peak integration regions. Thin red lines show fits of the traces with a function y = y0 + A1 × exp(−T/T1) + A2 × exp(−T/T2) × cos(2πT/T0 + φ). The fit resulted in the oscillation period, T0, of 0.78 ± 0.02 ps for both cross peaks involving the 1460 and 1500 cm–1 peaks and of 1.6 ± 0.1 ps for the peak at 1435/1460. The oscillation damping time, T2, was 0.8 ± 0.1 ps for the 1460/1500 and 1500/1460 peaks and 1.2 ± 0.3 ps for the peak at 1435/1460. The overall decay time, T1, is about 10 ps for all three cross peaks. A complete list of fit parameters is given in Table 5.
Figure 7
Figure 7
(A) Scaled waiting-time traces for indicated cross peaks for C6. The traces were fitted globally with an exponential decay function (red lines), see results in Table 6. The 1435/1500 cross peak was also fitted with an asymmetric double sigmoidal function (cyan, see Table 5). (B) Exponential decay times measured are summarized for each diagonal and cross peak, also reported in Tables 4–6. The vertical and horizontal lines are color coded to indicate FTIR contributions originated from different ligands, F5Ph (red), Tri (blue), and Tol (green).
Figure 8
Figure 8
Rates of dominant relaxation channels of νC≡C computed for C2F (see Figure S7 for C6F). The displacements of the strongly contributing normal modes (labeled with stars) are shown as insets. Delocalization factors, χ, are shown for each normal mode to the right of its rate bar. Note that χ(νC≡C) < 10–4.
Figure 9
Figure 9
Delocalization factor, χ, for all normal modes below 1650 cm–1 in C2F (see Figure S8 for C6F). Three pairs of significantly delocalized high-frequency modes are shown with red circles. Most high-frequency modes (>400 cm–1) are localized at either F5Ph (χ ∼ 1) or C2-Tri (χ ∼ 0) ligands. Low-frequency modes (<400 cm–1) are mostly delocalized across the Pt center.
Figure 10
Figure 10
Mode frequency of delocalized pairs (A) 1354 and 1362 cm–1, (B) 729 and 790 cm–1, and (C) frequencies around 360 cm–1 as a function of the mass scaling factor for the C and F atoms of the F5Ph moiety. Vertical red lines show the frequency jump (2β) of the observed modes.
Figure 11
Figure 11
Displacements for delocalized normal modes at (A) 1355 cm–1, (B) 1362 cm–1, (C) 394 cm–1, (D) 359 cm–1, (E) 790 cm–1, and (F) 575.5 cm–1.
Figure 12
Figure 12
Rates of dominant relaxation channels in C2F for two delocalized modes (A) 1361 cm–1 and (B) 1354 cm–1 and one mode localized at the C2-Tri ligand, (C) 1256 cm–1. The values on the right of each bar represent the mode delocalization factor, χ.
Figure 13
Figure 13
(A) Contributions of different groups of modes to the νC≡C/1500(F5Ph) cross peak computed for C2F. The groups are formed based on the frequency (>15, >400, 220–400, or 15–220 cm–1) and delocalization factor, χ (all, >0.96, or < 0.1). (B) Waiting-time population traces for high-frequency modes of F5Ph (χ > 0.96) and the mode at 575.5 cm–1 (χ = 0.51). 10-fold normalized population trace for 1362 mode is also shown by a black dashed line. (C) Cross-peak contributions of the modes shown in panel B. The overall contributions of all F5Ph modes (χ > 0.96) of frequencies >700 cm–1 (green) and >400 cm–1 (black) are shown with dashed lines.
Figure 14
Figure 14
(A) Contributions of different groups of modes to the νC≡C/1500(F5Ph) cross peak computed for C6F. The groups are formed based on the frequency (>15, >400, 220–400, or 15–220 cm–1) and delocalization factor, χ (all or > 0.94). (B) Waiting-time population traces for high-frequency modes of F5Ph (χ > 0.94) contributing the most to the cross peak.

References

    1. Dembinski R.; Bartik T.; Bartik B.; Jaeger M.; Gladysz J. A. Toward Metal-Capped One-Dimensional Carbon Allotropes: Wirelike C6–C20 Polyynediyl Chains That Span Two Redox-Active (η5-C5Me5)Re (NO)(PPh3) Endgroups. J. Am. Chem. Soc. 2000, 122, 810–822. 10.1021/ja992747z. - DOI
    1. Zheng Q.; Bohling J. C.; Peters T. B.; Frisch A. C.; Hampel F.; Gladysz J. A. A Synthetic Breakthrough into an Unanticipated Stability Regime: A Series of Isolable Complexes in which C6, C8, C10, C12, C16, C20, C24, and C28 Polyynediyl Chains Span Two Platinum Atoms. Chem. – Eur. J. 2006, 12, 6486–6505. 10.1002/chem.200600615. - DOI - PubMed
    1. Gauthier S.; Weisbach N.; Bhuvanesh N.; Gladysz J. A. “Click” Chemistry in Metal Coordination Spheres: Copper(I)-Catalyzed 3+2 Cycloadditions of Benzyl Azide and Platinum Polyynyl Complexes trans-(C6F5)(p-tol3P)2Pt(C≡C)nH (n = 2–6). Organometallics 2009, 28, 5597–5599. 10.1021/om900680q. - DOI
    1. Zheng Q.; Schneider J. F.; Amini H.; Hampel F.; Gladysz J. A. Wire like diplatinum, triplatinum, and tetraplatinum complexes featuring X[PtC≡CC≡CC≡CC≡C]mPtX segments; iterative syntheses and functionalization for measurements of single molecule properties. Dalton Trans. 2019, 48, 5800–5816. 10.1039/c9dt00870e. - DOI - PubMed
    1. Weisbach N.; Kuhn H.; Amini H.; Ehnbom A.; Hampel F.; Reibenspies J. H.; Hall M. B.; Gladysz J. A. Triisopropylsilyl (TIPS) Alkynes as Building Blocks for Syntheses of Platinum Triisopropylsilylpolyynyl and Diplatinum Polyynediyl Complexes. Organometallics 2019, 38, 3294–3310. 10.1021/acs.organomet.9b00368. - DOI