. 2022 Jul 26;13(1):4327.
doi: 10.1038/s41467-022-31963-4.

Targeting de novo lipogenesis and the Lands cycle induces ferroptosis in KRAS-mutant lung cancer

Affiliations

Targeting de novo lipogenesis and the Lands cycle induces ferroptosis in KRAS-mutant lung cancer

Caterina Bartolacci et al. Nat Commun. .

Erratum in

Abstract

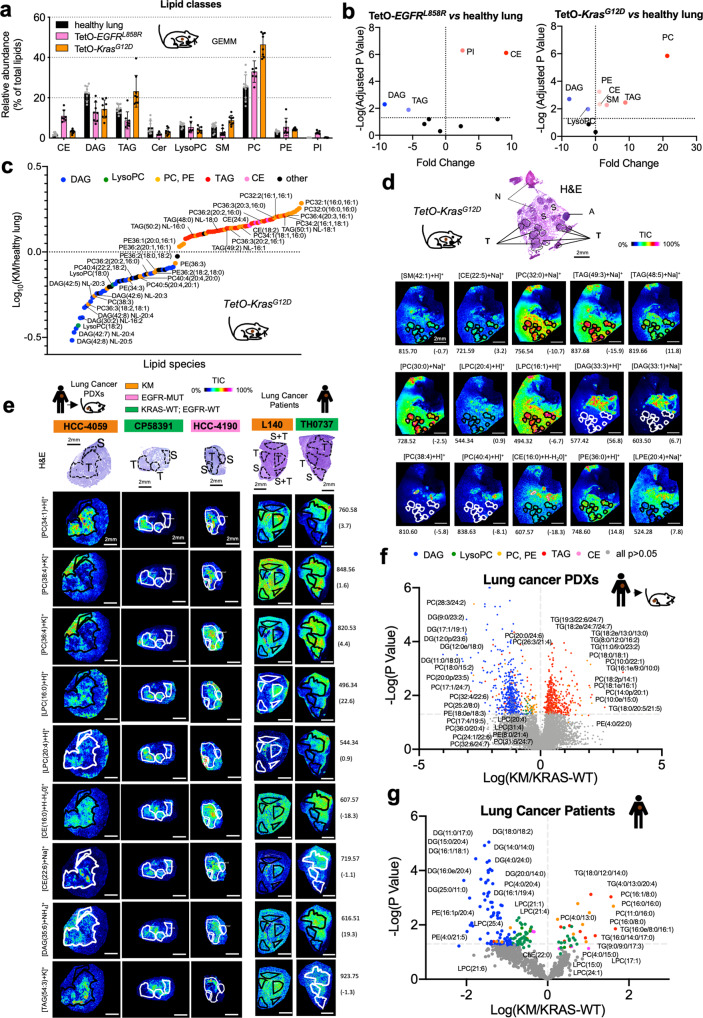
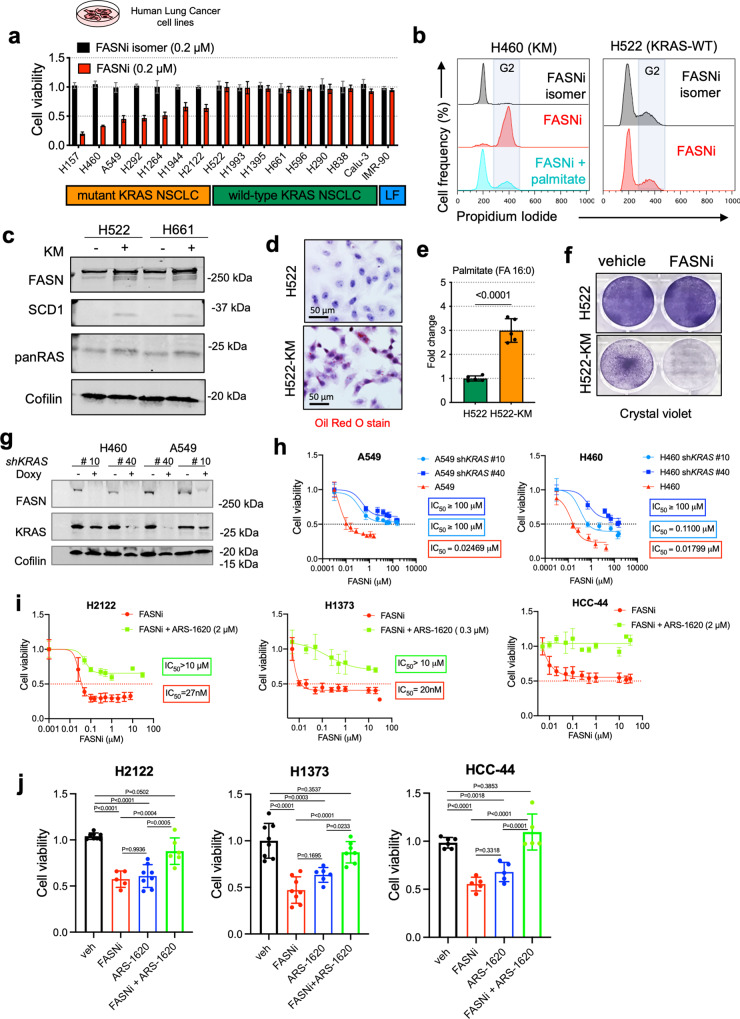
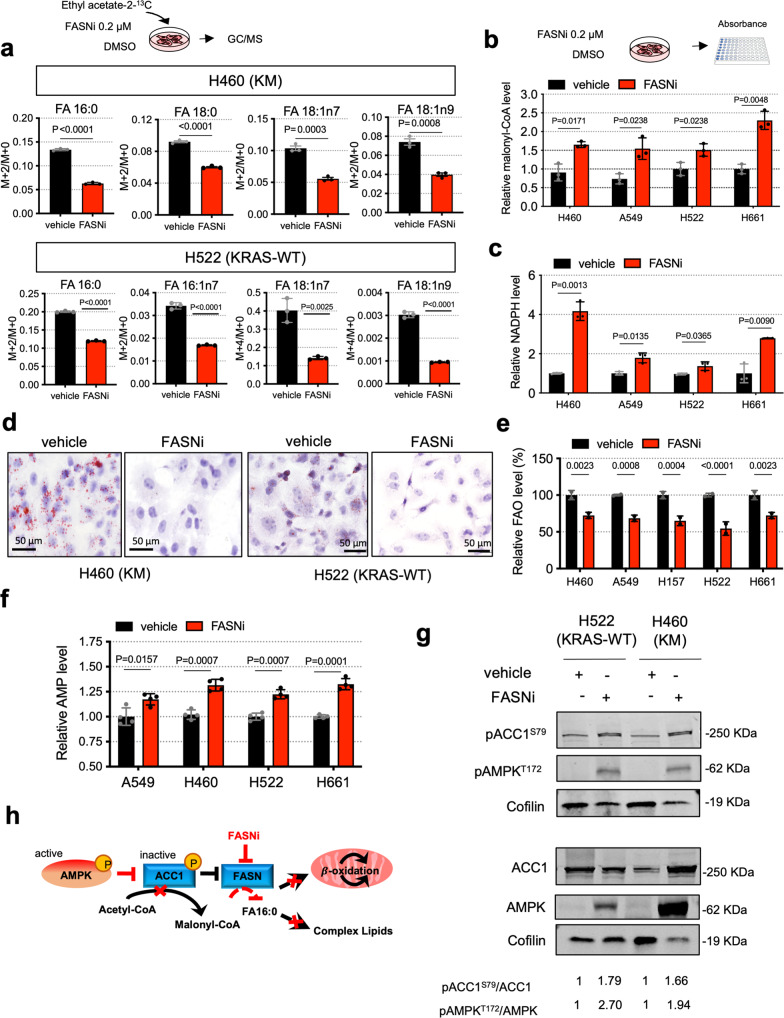
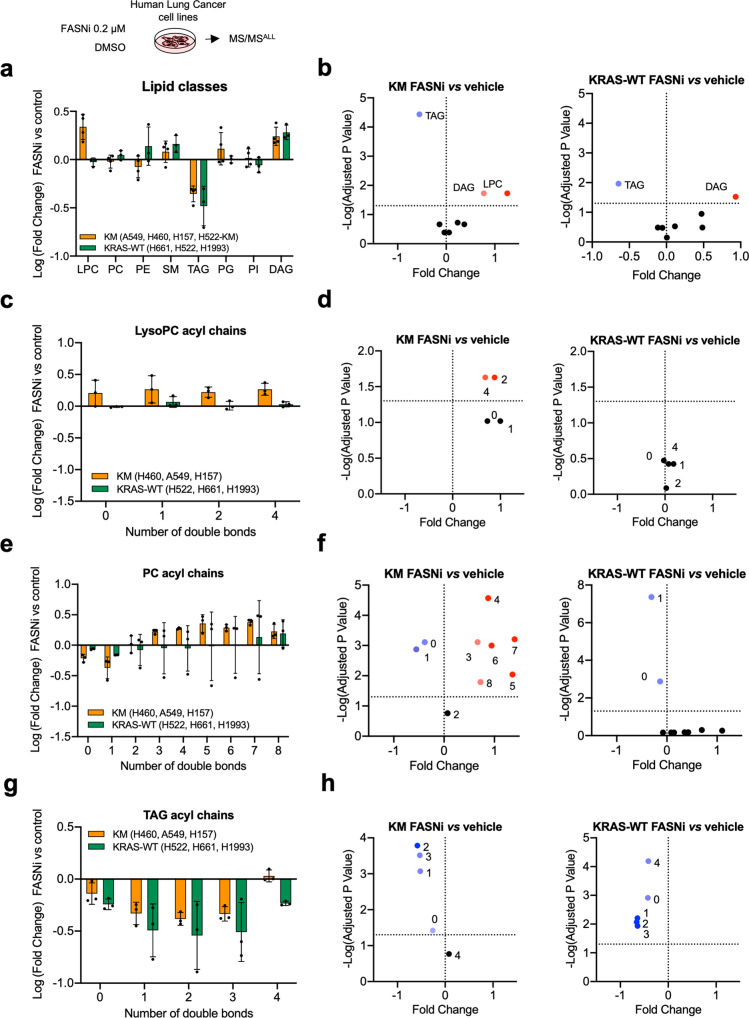
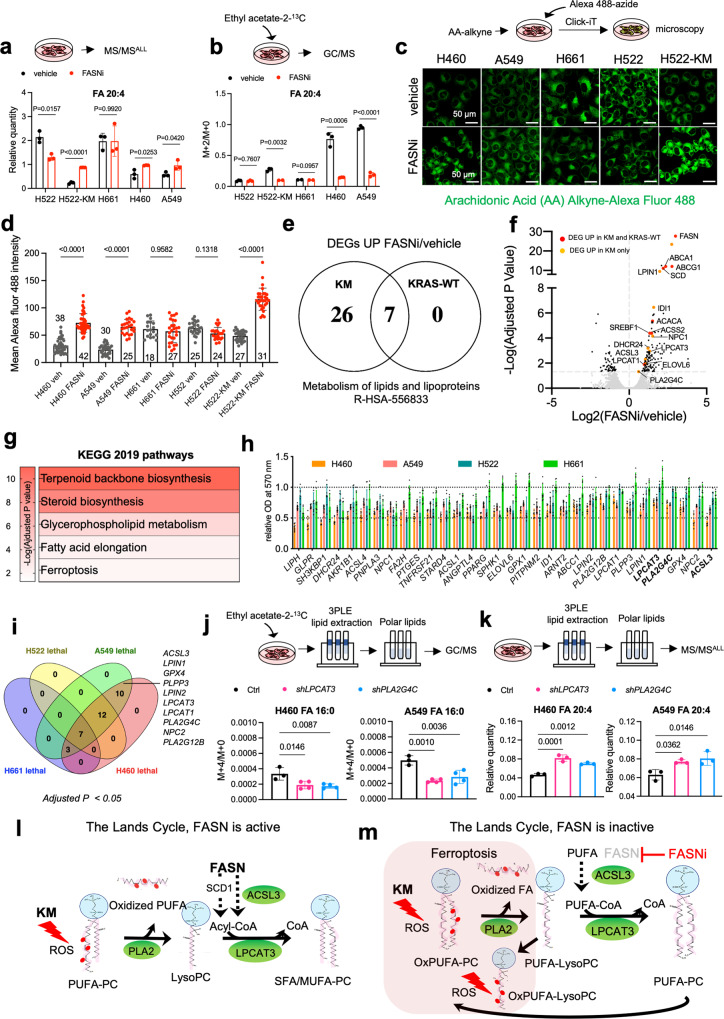
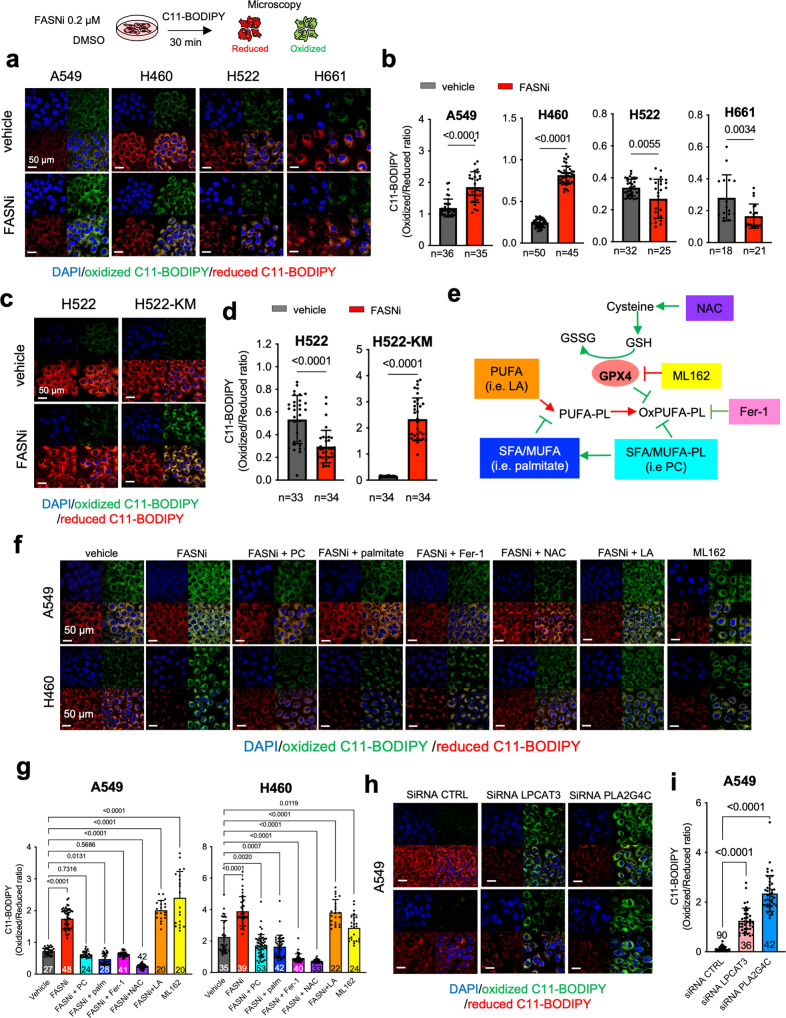
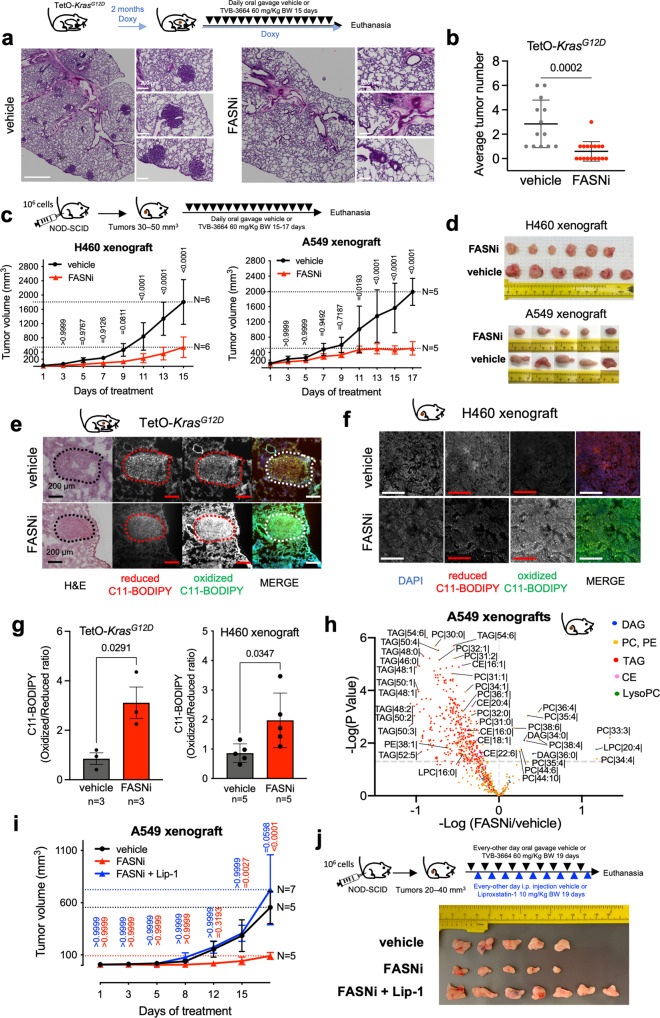
Mutant KRAS (KM), the most common oncogene in lung cancer (LC), regulates fatty acid (FA) metabolism. However, the role of FA in LC tumorigenesis is still not sufficiently characterized. Here, we show that KMLC has a specific lipid profile, with high triacylglycerides and phosphatidylcholines (PC). We demonstrate that FASN, the rate-limiting enzyme in FA synthesis, while being dispensable in EGFR-mutant or wild-type KRAS LC, is required for the viability of KMLC cells. Integrating lipidomic, transcriptomic and functional analyses, we demonstrate that FASN provides saturated and monounsaturated FA to the Lands cycle, the process remodeling oxidized phospholipids, such as PC. Accordingly, blocking either FASN or the Lands cycle in KMLC, promotes ferroptosis, a reactive oxygen species (ROS)- and iron-dependent cell death, characterized by the intracellular accumulation of oxidation-prone PC. Our work indicates that KM dictates a dependency on newly synthesized FA to escape ferroptosis, establishing a targetable vulnerability in KMLC.


Conflict of interest statement

G.K. is CEO and Chief Scientific Officer at Sagimet Biosciences where TVB-3664 has been developed. The other authors declare no competing interests.

Figures

Fig. 1
Fig. 1. KMLC has a unique lipidome.
a, b MS/MS Lipidomic analysis of murine TetO-KrasG12D tumors (n = 4), TetO-EGFRL858R (n = 3) and unaffected healthy lung (n = 3). Each dot indicates a lung/tumor section. Data are expressed as mean ± SD. PC, phosphatidylcholines; TAG, triglycerides; PE, phosphatidylethanolamines; CE, cholesteryl-esters; PI, phosphatidylinositols; DAG, diacylglycerides; SM, sphingomyelins; Cer, ceramides; LysoPC, lysophosphatidylcholines. Volcano plots in b show the lipid classes that are differentially represented for each comparison. The adjusted p-value and difference were calculated using multiple two-tailed t-tests with alpha = 0.05 followed by Benjamini, Krieger and Yekutieli FDR. c MS/MS and d MALDI imaging analyses showing lipid differentially represented in TetO-KrasG12D tumors as compared to unaffected heathy lung. e Representative pictures of MALDI imaging analysis of lung cancer patient-derived xenografts (PDXs) and primary human lung cancer specimens of the indicated genotype. In d and e rainbow scale represents % ion intensity normalized against the total ion count (TIC). Corresponding H&E and histological annotation are shown. T, tumor; S, stroma; S + T, stroma and tumor mix; N, necrotic area; A, artifact. In (d) and (e) observed m/z and mass error (ppm) values are indicated for each lipid species. Refer to Supplementary Data 1–4 for the complete tentative MALDI lipid annotation and relative quantification. f, g HPLC-MS/MS analysis of lung cancer PDXs and primary human lung cancer specimens of the indicated genotype. Volcano plots show lipid species identified by HPLC-MS/MS differentially represented in KM versus KRAS-WT samples (PDXs, KM n = 5 and KRAS-WT n = 4; lung cancer patients, n = 3/group). p-values were calculated using multiple two-tailed t-tests followed by Benjamini, Krieger, and Yekutieli FDR.
Fig. 2
Fig. 2. KM is required to induce dependency on FASN.
a Viability assay of human LC-derived cell lines (n = 2 biological independent experiments). Cell line, genotype and treatments are indicated. LF: lung fibroblasts. b Cell cycle analysis of H460 and H522 cells, as representative examples of KM and KRAS-WT LC cells, treated as indicated. Cell populations indicate singlets in the FL2-W/FL2-A gate. Refer to Supplementary Fig. 11 for a representative gating strategy. c Representative immunoblots of FASN, SCD1 and pan-RAS in H522 and H661 cells transduced as indicated (n = 2 independent experiments). d Oil red O staining, relative steady-state quantification of palmitate (FA 16:0) (e) and crystal violet assay (f) of H522 and H522-KM cells treated as indicated. g Immunoblot of FASN and KRAS in H460 and A549 cells transduced with doxy-inducible shRNAs targeting KRAS. h MTT viability assay of H460 and A549 cells treated with FASNi before and after induction of KRAS knock-down (n = 2 biological independent experiments). i, j MTT viability assays of H2122, H1373, and HCC-44 cells (KRASG12C mutant) treated with FASNi alone or in combination with the KRASG12C inhibitor ARS-1620 (n = 2 biological independent experiments). Data are expressed as mean ± SD. In e Student t-test with. In j one-way ANOVA followed by Tukey’s multiple comparison test.
Fig. 3
Fig. 3. FASNi inhibits fatty acid synthesis and ß-oxidation in both KM and KRAS-WT cells.
a GC/MS quantification of newly synthesized FA in H460 and H522 cells after overnight ethyl acetate-2-13C labeling, treated as indicated. Either M + 2/M + 0 or M + 4/M + 0 ratio is reported. Palmitate, FA 16:0; palmitoleate, FA 16:1n7; vaccenate, FA 18:1n7; oleate, FA 18:1n9 (n = 3 independent experiments). b, c Relative quantification of malonyl-CoA and NAPH of vehicle- and FASNi-treated LC cells (n = 3 independent experiments). d Oil red O staining for lipid droplets in H460 and H522 cells. e, f Relative quantification of FA ß-oxidation (FAO) and AMP in the indicated cells treated with vehicle or FASNi (n = 3 and n = 4 biologically independent samples). g Immunoblot of phospho-Ser79-ACC1 (pACC1S79), ACC1, FASN, phosphor-Thr172-AMPK (pAMPKT172) and AMPK. h Schematic of the AMPK/ACC1/FASN axis. FASNi inhibits the synthesis of palmitate (FA 16:0) thereby blocking the synthesis of complex lipids and ß-oxidation (FAO). These events trigger the activation of AMPK, which in turn phosphorylates and deactivates ACC1. ACC1 phosphorylation blocks the synthesis of malonyl-CoA (the substrate for FA 16:0 synthesis) potentiating the inhibitory effects of FASNi. Bars express mean ± SD. Statistical analyses were done using two-tailed unpaired Student’s t-test.
Fig. 4
Fig. 4. FASNi induces accumulation of PUFA-PC and PUFA-LysoPC in KMLC.
a Variation of the lipid classes identified by MS/MS in KM and KRAS-WT LC cells. Bars represent Log (fold-change) of FASNi treatment over vehicle control (n = 3 biologically independent cell lines/group). b Volcano plots of multiple two-tailed t-tests followed by Benjamini, Krieger, and Yekutieli FDR representing the significant changes in lipid classes for the indicated comparisons (cutoff adj p < 0.05). ch Relative double bond quantification in the indicated lipid classes (n = 3 biologically independent cell lines/group) and volcano plots showing the correspondent multiple two-tailed t-tests followed by Benjamini, Krieger, and Yekutieli FDR (cutoff adj p < 0.05). Bars express mean ± SD.
Fig. 5
Fig. 5. FASN and the Lands cycle limit PUFA content of phospholipids of KMLC.
Quantification of total (a) and newly synthetized (b) arachidonic acid (FA 20:4) in the PL fraction of the indicated cell lines (n = 3 biologically independent samples). Tracer incorporation was measured after 7-h incubation with ethyl acetate-1,2 13C2. c, d Incorporation of arachidonic acid (AA) alkyne in the indicated cell lines treated as indicated, and its quantification. n = 20–42 cells over 2 biologically independent samples. e Venn Diagram of the “metabolism of lipids and lipoproteins” (R-HSA-556833) genes upregulated in KM (H460, A549) and KRAS-WT (H661, H522) LC cells treated with FASNi. f, g Gene expression volcano plot and top KEGG pathways specifically upregulated in KMLC cells upon FASNi treatment. h, i Cell viability after siRNA-mediated knockdown of the indicated genes (n = 2 biologically independent experiments). Venn diagram summarizes lethal genes specific for KMLC cells (H460 and A549, Dunnett’s multiple comparison test with cutoff adj p < 0.05). j, k Quantification of newly synthetized- palmitate (FA 16:0) and total arachidonic acid (FA 20:4) in the PL fraction of indicated cell lines after shRNA-mediated knockdown of lysophosphatidylcholine acyltransferase 3 (LPCAT3) and phospholipase A2 group IV C (PLA2G4C) (n = 4 and n = 3 biological independent samples). l, m Working model explaining the role of FASN in the regulation of the Lands cycle in KMLC. FASN is active: KM induces ROS that oxidize the PUFA acyl chain on PC. PLA2 removes the oxidized fatty acid (FA) on PC synthetizing a LysoPC. FASN and SCD1 produce saturated FA (SFA) and MUFA, respectively. SFA/MUFA are transferred to CoA by ACSL3. These acyl-CoAs are used by LPCAT3 to re-acylate the LysoPC forming again PC. Inhibition of FASN (m) causes the depletion of SFA/MUFA and uptake of exogenous PUFA for the re-acylation of LysoPC. This process increases the amount of PUFA-PC and PUFA-LysoPC, which are oxidized under oxidative stress (oxPUFA-PC and oxPUFA-LysoPC). Accumulation of these lipid species leads to cell death via ferroptosis. Bars represent mean ± SD. In a, b, d, j, k Statistical analyses were done using two-tailed unpaired Student’s t-test. In f p-values were generated using one-way ANOVA and adjusted for multiple comparisons using a Benjamini–Hochberg correction (FDR). In h statistical analysis was performed using one-way ANOVA followed by Dunnett’s multiple comparisons test.
Fig. 6
Fig. 6. FASN and the Lands cycle are required to deflect ferroptosis in KMLC.
ad C11-BODIPY staining in KM, KRAS-WT, and H522-KM LC cells. Oxidized and reduced C11-BODIPY are indicated in red and green, respectively. Bars indicate the relative C11-BODIPY oxidation (n, number of cells). e Schematic of the GPX4 axis of ferroptosis and some of its regulators. Red = pro-ferroptosis; Green = anti-ferroptosis. NAC, N-acetyl cysteine; GSH, glutathione; GSSG, glutathione disulfide; ML162, GPX4 inhibitor; Fer-1, ferrostatin-1; PUFA, Polyunsaturated fatty acids; OxPUFA, oxidized PUFA; PL, phospholipids; MUFA, monounsaturated fatty acids; SFA, saturated fatty acids; LA, linoleic acid; PC, phosphatidylcholine. f, g C11-BODIPY rescue experiments in the indicated cell lines and their quantification. h, i C11-BODIPY stain on A549 cell-line transfected with the indicated siRNAs (48 h post transfection) and their quantification. In g and i n of cells analyzed over two independent experiments are indicated in the graphs. Bars represent mean ± SD. In b and d two-tailed unpaired student t-test, in g multiple t-tests.
Fig. 7
Fig. 7. FASNi is effective in KMLC in vivo.
a, b Representative H&E pictures of the lungs of TetO-Kras mice treated as indicated and tumor number quantification. n = number of mice. c, d In vivo growth curves and post-resection pictures of H460 and A549 xenografts in NOD/SCID mice treated as indicated. eg Representative pictures of C11-BODIPY staining of the lungs of TetO-Kras and of H460 xenografts, and their quantification. Dotted circles in e indicate lung tumor identified via H&E staining. h Volcano plot showing lipid species identified by MS/MS differentially represented in FASNi versus vehicle (n = 5 mice/group). i In vivo growth curves and j post-resection pictures of A549 xenografts in NOD/SCID mice treated as indicated in the schematic. Color-coded statistics indicate comparisons to vehicle. Lip-1, Liproxstatin-1. In b, c, g, i data are represented as mean ± SD. In b, g unpaired two-tailed student t-test, in c, multiple t-tests followed by Benjamini–Hochberg FDR, in h generalized linear model followed by Benjamini–Hochberg FDR, and in i two-way ANOVA plus Sidak’s comparisons.

References

    1. Fisher GH, et al. Induction and apoptotic regression of lung adenocarcinomas by regulation of a K-Ras transgene in the presence and absence of tumor suppressor genes. Genes Dev. 2001;15:3249–3262. - PMC - PubMed
    1. Sunaga N, et al. Knockdown of oncogenic KRAS in non-small cell lung cancers suppresses tumor growth and sensitizes tumor cells to targeted therapy. Mol. Cancer Ther. 2011;10:336–346. - PMC - PubMed
    1. McCormick, F. Progress in targeting RAS with small molecule drugs. Biochem. J. 10.1042/BCJ20170441 (2019). - PubMed
    1. Canon, J. et al. The clinical KRAS(G12C) inhibitor AMG 510 drives anti-tumour immunity. Nature10.1038/s41586-019-1694-1 (2019). - PubMed
    1. Hallin, J. et al. The KRASG12C inhibitor MRTX849 provides insight toward therapeutic susceptibility of KRAS-mutant cancers in mouse models and patients. Cancer Discov. 10.1158/2159-8290.CD-19-1167 (2020). - PMC - PubMed

Publication types

MeSH terms

Substances