. 2022 Aug;23(8):1169-1182.
doi: 10.1038/s41590-022-01272-5. Epub 2022 Jul 26.

Lymph node homeostasis and adaptation to immune challenge resolved by fibroblast network mechanics

Affiliations

Lymph node homeostasis and adaptation to immune challenge resolved by fibroblast network mechanics

Harry L Horsnell et al. Nat Immunol. 2022 Aug.

Abstract

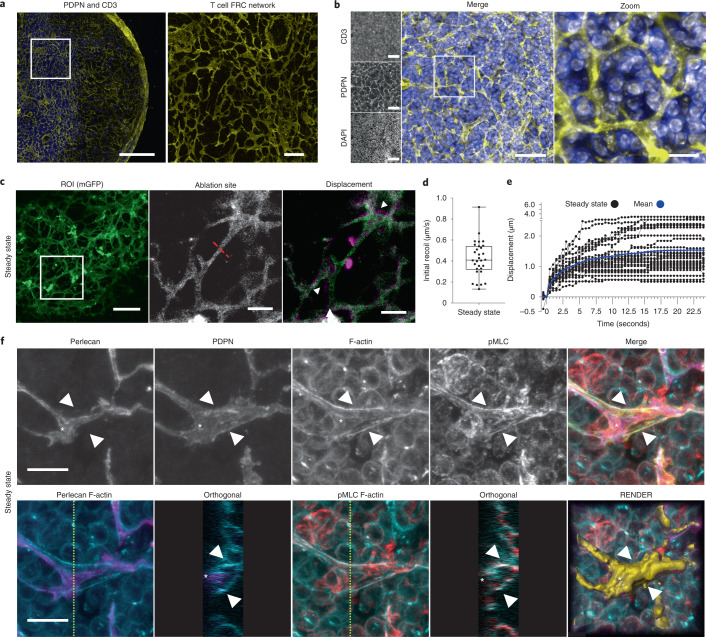
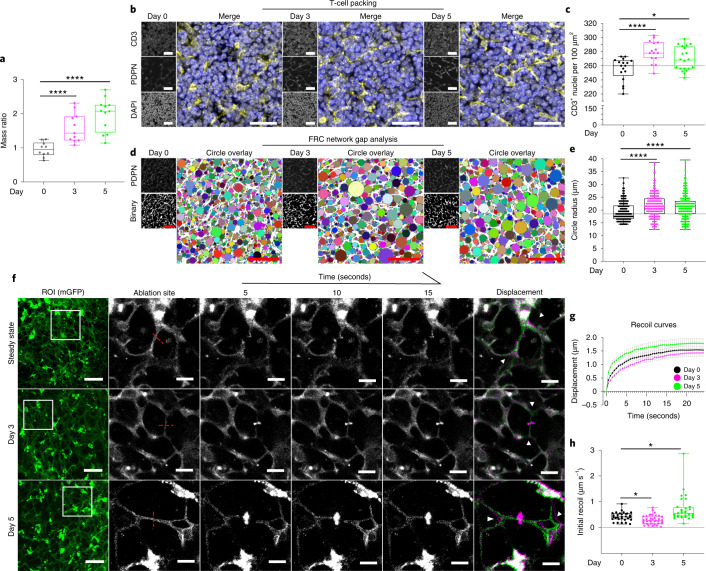
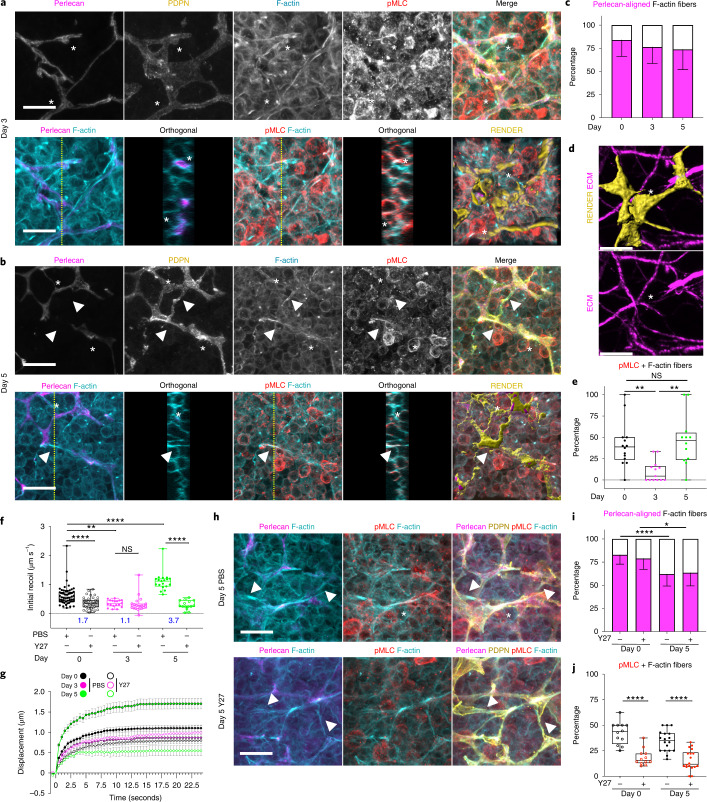
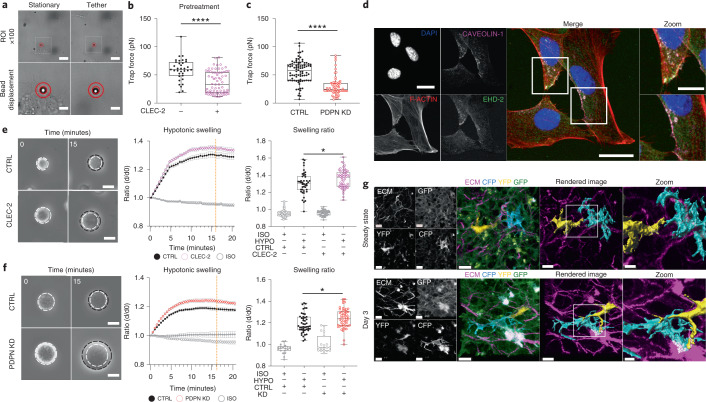
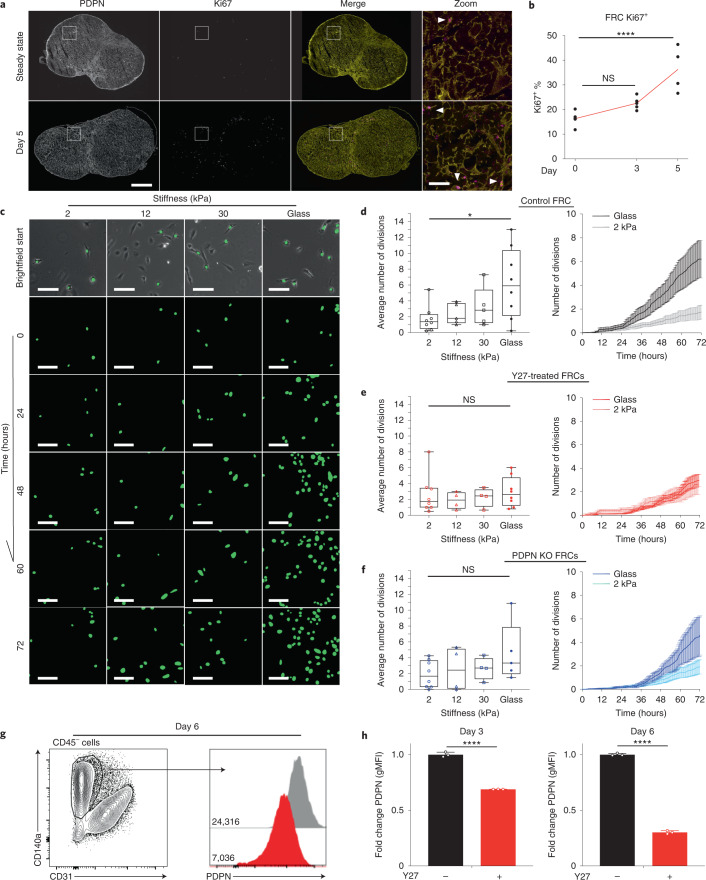
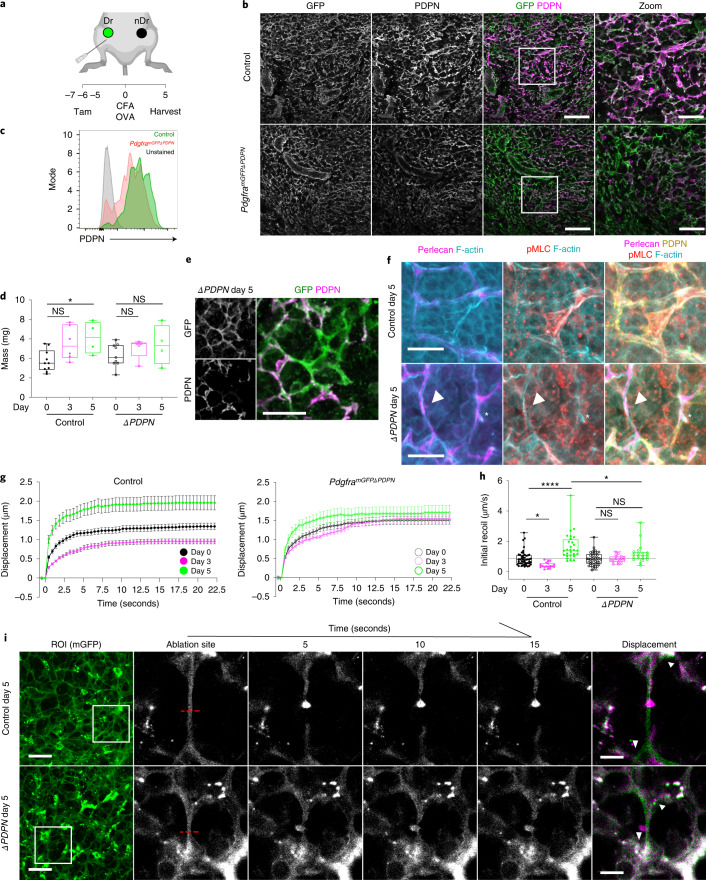
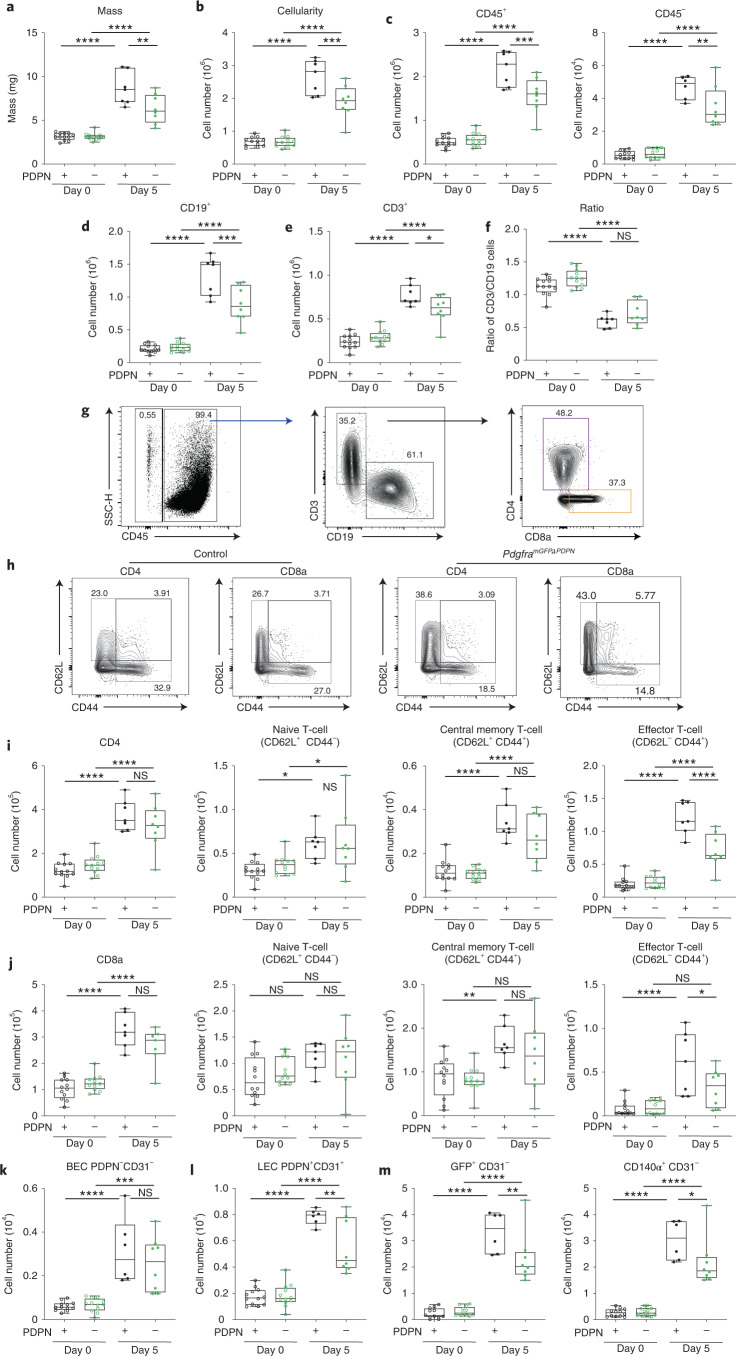
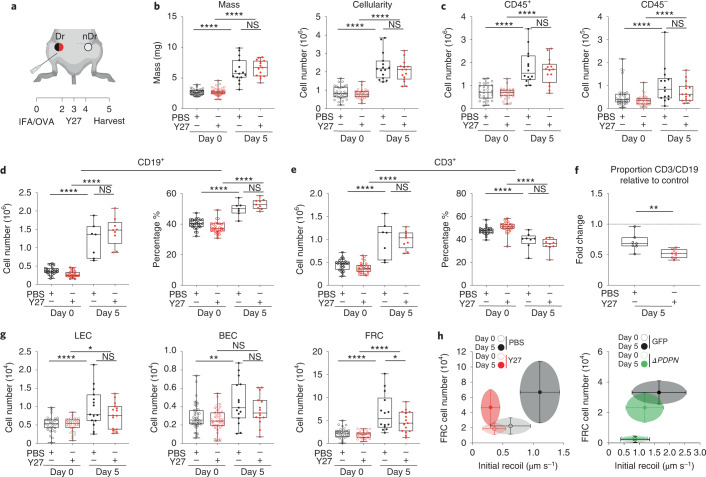
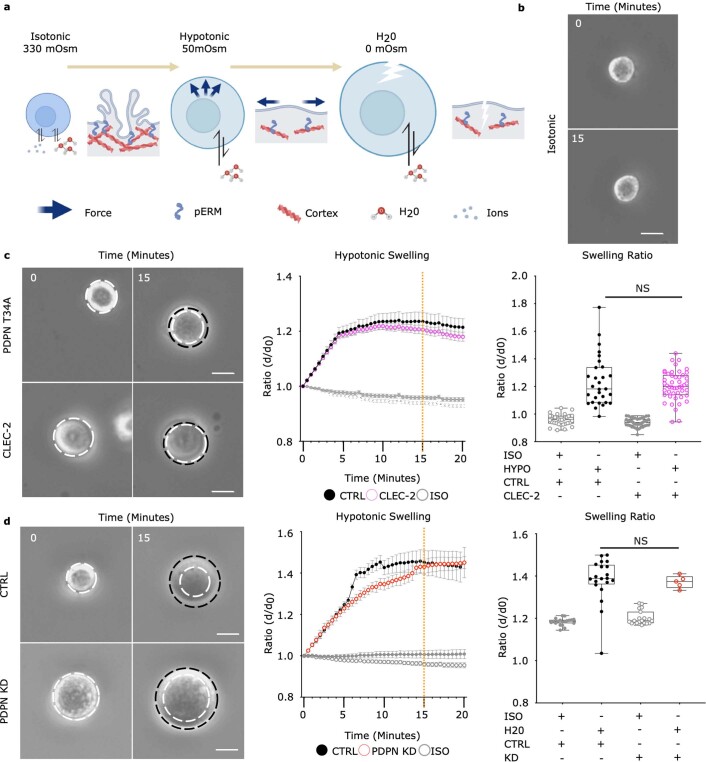
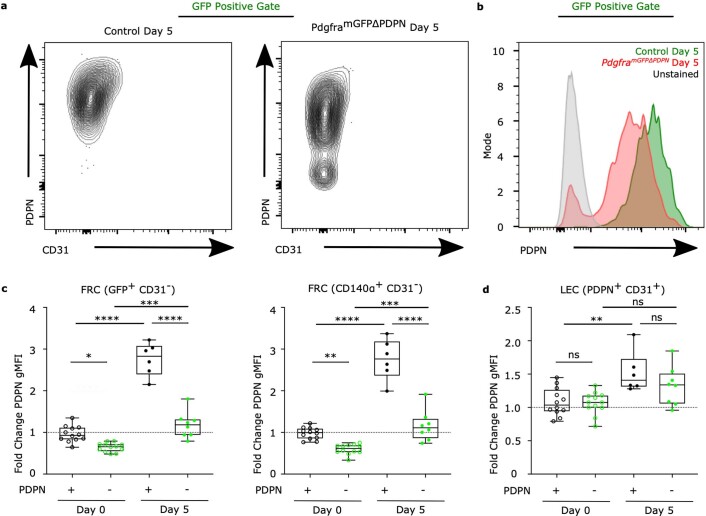
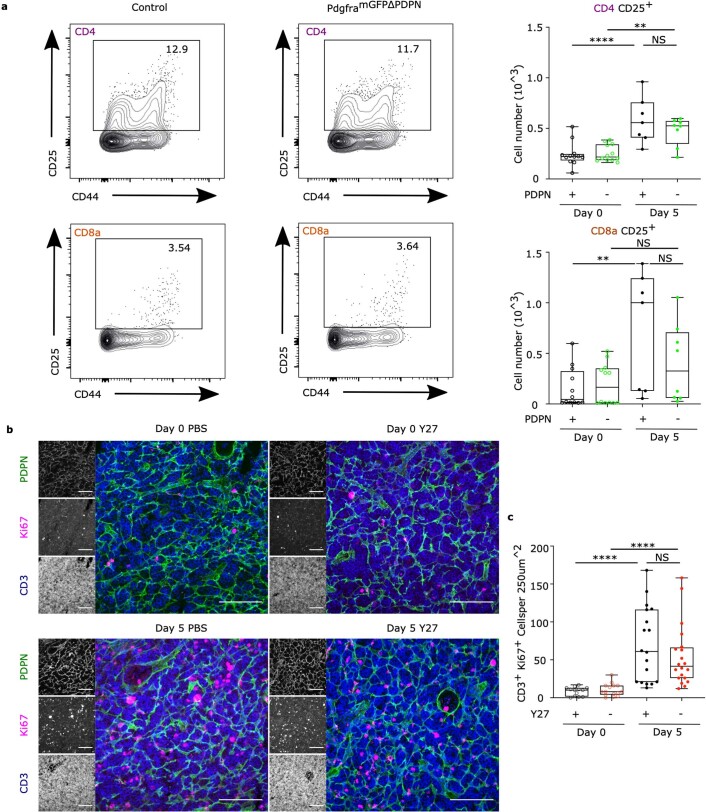
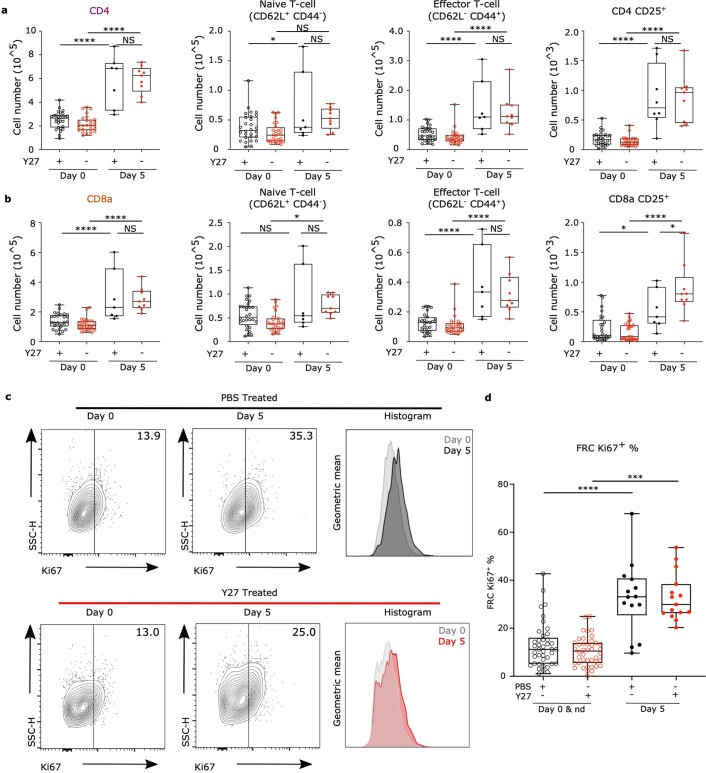
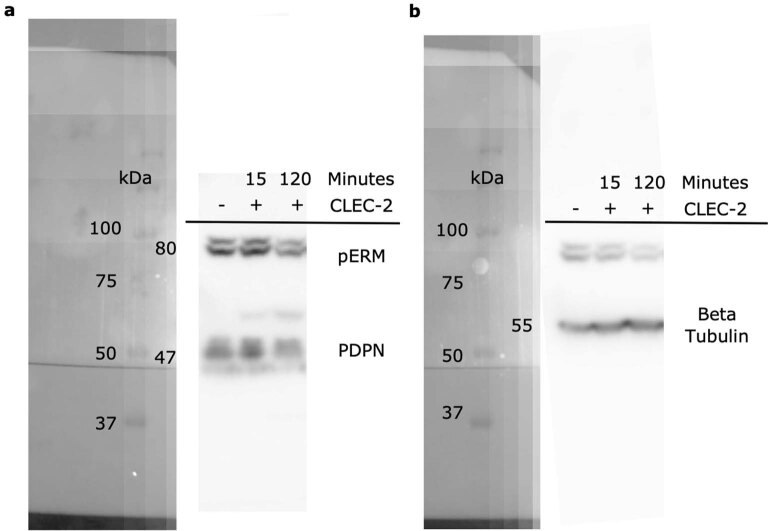
Emergent physical properties of tissues are not readily understood by reductionist studies of their constituent cells. Here, we show molecular signals controlling cellular, physical, and structural properties and collectively determine tissue mechanics of lymph nodes, an immunologically relevant adult tissue. Lymph nodes paradoxically maintain robust tissue architecture in homeostasis yet are continually poised for extensive expansion upon immune challenge. We find that in murine models of immune challenge, cytoskeletal mechanics of a cellular meshwork of fibroblasts determine tissue tension independently of extracellular matrix scaffolds. We determine that C-type lectin-like receptor 2 (CLEC-2)-podoplanin signaling regulates the cell surface mechanics of fibroblasts, providing a mechanically sensitive pathway to regulate lymph node remodeling. Perturbation of fibroblast mechanics through genetic deletion of podoplanin attenuates T cell activation. We find that increased tissue tension through the fibroblastic stromal meshwork is required to trigger the initiation of fibroblast proliferation and restore homeostatic cellular ratios and tissue structure through lymph node expansion.


Conflict of interest statement

The authors declare no competing interests.

Figures

Fig. 1
Fig. 1. The FRC network is under mechanical tension in steady-state LNs.
a, LN tile scan (left), paracortex (right) maximum z-projection of PDPN (FRCs, yellow), and CD3 (T cells, blue). Scale bars, 500 µm (left) and 25 µm (right). b, FRC network structure and T cell compaction in vibratome slices of PDPN (FRCs), CD3 (T cells), and DAPI (nuclei). Scale bars, 50 µm (left) and 10 µm (right). c, PDGFRα+mGFP+ (FRCs) ablation region of interest (ROI) (white box) (left) and cut site (red dotted line) (middle). Scale bars, 50 µm. Right: Recoil displacement (arrowheads) with pre- (green) and postcut (magenta) overlay (right). Scale bar, 10 µm. d, Initial recoil velocity (µm s−1). Each point represents an ablation. Box plot indicates median, interquartile range, and minimum/maximum. e, Individual recoil curves (black) compared to the mean (blue). d,e, n = 30 individual ablations over 10 LNs. f, Paracortical steady-state FRCs of perlecan (matrix; purple), PDPN (FRC; yellow), phalloidin (F-actin; blue), and pMLC (red). Asterisk and arrowheads indicate F-actin cables. Orthogonal views (yellow dotted line, yz axis, 10 μm depth). Representative image of three independent experiments. Scale bars, 10 µm. Source data
Fig. 2
Fig. 2. FRCs adapt to changing external forces throughout immune challenge.
a, LN mass change after IFA/OVA immunization. One-way analysis of variance (ANOVA) with Tukey’s multiple comparisons, ****P = 1.00 × 10⁻⁶. Each point represents one LN at day 0 (n = 10), day 3 (n = 11), and day 5 (n = 12). b, T cell packing in the LN during inflammation for PDPN (FRCs, yellow), CD3 (T cells, blue), and DAPI (nuclei, gray). Scale bars, 25 µm. c, Quantification of CD3+ T cell nuclei per 100 µm2. Box plot indicates median, interquartile range, and minimum/maximum. Dotted line represents median of day 0. One-way ANOVA with Tukey’s multiple comparisons, *P = 0.0362, ****P = 0.0003. n indicates individual image ROI on day 0 (n = 17), day 3 (n = 15), and day 5 (n = 20) from three independent LNs. d, FRC gap analysis during inflammation. PDPN (FRCs), binary, and circle overlay. Scale bars, 50 µm. e, Quantification of circle radius. Box plot indicates median, interquartile range, and minimum/maximum. Dotted line represents median of day 0. One-way ANOVA with Tukey’s multiple comparisons, ****P = 2.00 × 10⁻⁶. Each point represents a circle radius. n indicates individual image ROI on day 0 (n = 12), day 3 (n = 15), and day 5 (n = 15) from three independent LNs. f, Laser ablation of the FRC network throughout inflammation. PDGFRα+mGFP+ (FRCs) ablation ROI (white box) and cut site (red dotted line). Scale bars, 50 µm. Recoil displacement (arrowheads) with pre- (green) and postcut (magenta) overlay. Scale bars, 10 µm. g, Recoil curves of network displacement (μm) (mean ± standard error of the mean (s.e.m.)). h, Initial recoil velocity (μm s−1) after IFA/OVA immunization. Box plot indicates median, interquartile range, and minimum/maximum. Kruskal–Wallis test with Dunnett’s test, *P < 0.05. g,h, n indicates an ablation on day 0 (n = 30), day 3 (n = 37), and day 5 (n = 32) for three independent experiments. Source data
Fig. 3
Fig. 3. Actomyosin contractility sets FRC network tension in response to tissue expansion.
a,b, Actomyosin structure in FRCs day 3 (a) and day 5 (b) after IFA/OVA immunization for perlecan (matrix, magenta), PDPN (FRC, yellow), phalloidin (F-actin, cyan), and pMLC (red). Asterisks and arrowheads indicate F-actin cables with or without perlecan alignment. Orthogonal views (yellow dotted line, yz axis, 10 μm depth). Representative image of three independent experiments. Scale bars, 10 µm. c, Percentage of Fibers. Stacked bar plots with mean ± standard deviation (s.d.) error bars. d, Confetti-labeled FRCs (yellow) spanning space without (white asterisk) ECM (magenta). Scale bar, 5 µm. e, Percentage of Fibers. Box plot indicates median, interquartile range, and minimum/maximum. One-way ANOVA with Tukey’s multiple comparisons, **P < 0.01. c,e, n indicates image ROI on day 0 (n = 14), day 3 (n = 13), and day 5 (n = 12) from three mice. f, Initial recoil velocity (µm s−1) after IFA/OVA immunization, ± ROCK inhibition (Y27632). Resistive myosin forces (blue text indicates the ratio between PBS/Y27). Box plot indicates median, interquartile range, and minimum/maximum. Two-way ANOVA with Tukey’s multiple comparisons, ****P < 0.0001, **P = 0.001973. g, Recoil curves of network displacement (µm) (mean ± s.e.m.). f,g, n indicates an ablation on day 0 (n = 54), day 0 + Y27 (n = 43), day 3 (n = 18), day 3 + Y27 (n = 20), day 5 (n = 19), and day 5 + Y27 (n = 15) over three independent experiments. h, Actomyosin structure in FRCs day 5 after IFA/OVA immunization with or without ROCK inhibition (Y27632). Perlecan (matrix, magenta), PDPN (FRC, yellow), phalloidin (F-actin, cyan), and pMLC (red). Asterisks and arrowheads indicate F-actin cables with or without perlecan alignment. Representative image of three independent experiments. Scale bars, 10 µm. i, Percentage of Fibers. Stacked bar plots with mean ± s.d. error bars. Two-way ANOVA with Tukey’s multiple comparisons, ****P = 0.000577, *P = 0.03824. j, Percentage of Fibers. Box plot indicates median, interquartile range, and minimum/maximum. One-way ANOVA with Tukey’s multiple comparisons, ****P < 0.0001. i,j, n indicates image ROI on day 0 (n = 12), day 0 + Y27 (n = 12), day 5 (n = 18), and day 5 + Y27 (n = 18) from three mice. NS, not significant. Source data
Fig. 4
Fig. 4. CLEC-2/PDPN signaling controls intrinsic FRC mechanics for morphological adaption.
a, Optical tweezers generate membrane tethers of FRCs; scale bar (10 µm, top panels). Stationery (bottom left) and tether (bottom right) bead displacement (red circles). Scale bar, 2 µm (bottom panels). b, Trap force (pN µm−1) of FRCs pretreated with CLEC-2. Box plot indicates median, interquartile range, and minimum/maximum. Mann–Whitney test (two tailed), ****P = 1.00 × 10⁻⁶. n indicates cell for CLEC-2 (n = 35) and CLEC-2+ (n = 69) over five independent experiments. c, Trap force (pN µm−1) of PDPN short hairpin RNA (shRNA) knockdown (KD) FRC. Box plot indicates median, interquartile range, and minimum/maximum. Mann–Whitney test (two tailed), ****P = 1.00 × 10⁻⁶. n indicates cell for control (n = 86), PDPN KD (n = 64) over five independent experiments. d, Caveolae structures in FRCs for DAPI (blue), F-actin (red), Caveolin-1 (magenta), and EHD2 (green). Representative images of two independent experiments. Scale bars, 20 µm (zoom-ins (white box), 10 µm). e,f, Swelling of PDPN CTRL FRCs with or without pretreatment CLEC-2 (e) and PDPN shRNA KD FRCs (f). Initial size (left, white circle) after swelling (black circle). Scale bars, 25 µm. Change in diameter ratio (middle, mean ± s.e.m.). Diameter ratio (right) of control and CLEC-2-treated cells (e) or PDPN KD cells (f) at 15 min after swelling (orange dotted line). Box plot indicates median, interquartile range, and minimum/maximum. e, One-way ANOVA with Tukey’s multiple comparisons, *P = 0.0277. n indicates cell for CLEC-2 isotonic control (ISO) (n = 48), CLEC-2 hypotonic solution (HYPO) (n = 56), CLEC-2+ ISO (n = 55), and CLEC-2+ HYPO (n = 42) cells analyzed over five independent experiments. f, One-way ANOVA with Tukey’s multiple comparisons, *P = 0.0212. n indicates cell for control ISO (n = 19), control HYPO (n = 47), PDPN KD ISO (n = 19), and PDPN KD HYPO (n = 54) cells analyzed over five independent experiments. g, Individually labeled FRCs in vivo. Second harmonic (ECM, magenta), CFP (cyan), YFP (yellow), GFP (green). Representative images of three LNs over two independent experiments. Scale bars, 10 µm (zoomed-in region (white box), 5 µm). Source data
Fig. 5
Fig. 5. FRCs are mechanically sensitive in vitro.
a, LN tile scan of PDPN+ (yellow) and Ki67+ (magenta) cells. Scale bars, 500 µm (zoom-in T cell area (white box), 50 µm). Arrowheads mark PDPN+ Ki67+ FRCs. b, Flow cytometric analysis of Ki67+ percentage of FRCs after IFA/OVA immunization. Two-way ANOVA with Dunnett’s test, ****P = 1.00 × 10⁻⁶. n indicates LNs on day 0 (n = 5), day 3 (n = 5), and day 5 (n = 4). c, FRC GFP nuclei are tracked over 72 h on different polyacrylamide gel stiffnesses. Scale bar, 50 µm. df, Average number of divisions per cell in 72 h and over time on different substrate rigidities. d, Control FRCs. e, FRCs treated with ROCK inhibition (Y27632). f, PDPN KO FRCs. Box plot indicates median, interquartile range, and minimum/maximum. One-way ANOVA with Tukey’s multiple comparisons, *P = 0.0298. n indicates image ROI for 2 kPa (n = 8), 12 kPa (n ≥ 4), 30 kPa (n ≥ 4), and glass (n ≥ 5) over three independent experiments. Division curves compare glass and 2 kPa (mean ± s.e.m.). g, Flow gating and PDPN histograms geometric mean fluorescent intensity (gMFI) of isolated primary FRCs after ROCK inhibition (Y27632). h, Fold change in gMFI of PDPN on FRCs following ROCK inhibition (Y27632). Mann–Whitney test (two tailed), ****P < 0.0001. n = 3 LNs. Source data
Fig. 6
Fig. 6. Deletion of PDPN in vivo attenuates mechanical adaptation of the FRC network in response to immune challenge.
a, Tamoxifen and immunization strategy for PdgframGFPΔPDPN mice. Draining LNs (Dr) and non-draining LNs (nDr). b, LN paracortex maximum z-projection. GFP (PdgframGFP, green), PDPN (FRCs, magenta). Scale bars, 50 µm (zoom, 30 µm). c, Representative histograms of surface protein expression for PDPN in control and PdgframGFPΔPDPN steady-state LNs. d, LN mass after CFA/OVA immunization. Box plot indicates median, interquartile range, and minimum/maximum. Two-way ANOVA with Dunnett’s test, *P = 0.030. n indicates LNs on day 0 (n = 10), day 0ΔPDPN (n = 9), day 3 (n = 6), day 3ΔPDPN (n = 5), day 5 (n = 4), and day 5ΔPDPN (n = 4). e, Representative image of GFP+ (green), PDPN (magenta) FRC cell body in day 5 after immunization in PdgframGFPΔPDPN LNs from two independent experiments. Scale bar, 25 µm. f, Representative images of actomyosin and ECM structures within control and PdgframGFPΔPDPN FRCs 5 days after immunization. Arrowheads and asterisks mark PDPN and PDPN+ FRCs respectively; perlecan (magenta), PDPN (yellow), F-actin (cyan), and pMLC (red). Scale bars, 10 µm. g, Recoil curves of network displacement (µm) (mean ± SEM) for control and PdgframGFPΔPDPN mice. h, Initial recoil velocity (µm s−1) after CFA/OVA immunization in control and PdgframGFPΔPDPN mice. Box plot indicates median, interquartile range, and minimum/maximum. Two-way ANOVA with Sidak’s multiple comparisons, *P < 0.05, ****P = 1.00E^−6. Each point represents an ablation. i, Laser ablation of the FRC network throughout inflammation in control and PdgframGFPΔPDPN mice. PDGFRα+mGFP+ (FRCs) ablation ROI (white box) and cut site (red dotted line). Scale bars, 50 µm. Recoil displacement (arrowheads) with pre- (green) and postcut (magenta) overlay. Scale bars, 10 µm. gi, n indicates ablation at day 0 (n = 48), day 0ΔPDPN (n = 44), day 3 (n = 18), day 3ΔPDPN (n = 18), day 5 (n = 28), and day 5ΔPDPN (n = 21) over three independent experiments. Source data
Fig. 7
Fig. 7. Loss of FRC mechanical sensitivity constrains effector T cell populations in vivo.
a, LN mass. b, Cellularity. Box plots indicate median, interquartile range, and minimum/maximum. One-way ANOVA with Tukey’s multiple comparisons, ****P = 1.00 × 10⁻⁶, ***P = 0.000567, **P = 0.002087. n indicates LNs at day 0 (n = 12), day 0ΔPDPN (n = 12), day 5 (n ≥ 6), and day 5ΔPDPN(n = 8) over two independent experiments. ce, CD45+, CD45, CD19+ and CD3+ cell numbers. Box plots indicate median, interquartile range, and minimum/maximum. One-way ANOVA with Tukey’s multiple comparisons, ****P = 1.00 × 10⁻⁶, ***P < 0.001, **P = 0.00989, *P = 0.027535. f, Ratio of CD19+ and CD3+ cell numbers. Box plots indicate median, interquartile range, and minimum/maximum. One-way ANOVA with Tukey’s multiple comparisons, ****P = 1.00 × 10⁻⁶. Each point represents one LN. g, Flow cytometric gating. Representative dot plots and percentages of CD45+, CD45, CD19+, CD3+ and CD3+ CD4+ and CD3+ CD8+ subpopulations. h, Representative flow cytometric gating comparing control and PdgframGFPΔPDPN CD3+ CD4+, CD3+ CD8+ subpopulations. i,j, CD3+ CD4+ and CD3+ CD8+ subpopulation cell numbers. Box plots indicate median, interquartile range, and minimum/maximum. One-way ANOVA with Tukey’s multiple comparisons, ****P = 1.00 × 10⁻⁶, **P = 0.0058, *P < 0.05. Each point represents one LN. km, Stromal cell numbers for blood endothelial cells (BECs) (k), lymphatic endothelial cells (LECs) (l), and GFP+ and CD140α+ FRCs (m). Box plots indicate median, interquartile range, and minimum/maximum. One-way ANOVA with Tukey’s multiple comparisons, ****P = 1.00 × 10⁻⁶, **P = 0.0043, *P < 0.05. Source data
Fig. 8
Fig. 8. Mechanical tension gates FRC proliferation in vivo.
a, Schematic of immunization and Y27 treatment timeline. Draining LNs (Dr) and non-draining LNs (nDr). b, LN mass and cellularity. Box plots indicate median, interquartile range, and minimum/maximum. One-way ANOVA with Tukey’s multiple comparisons, ****P = 1.00 × 10⁻⁶. n indicates LNs on day 0 (n ≥ 28), day 0Y27 (n ≥ 28), day 5 (n ≥ 7), and day 5Y27(n ≥ 9) over two independent experiments. c, CD45+ and CD45 cell numbers. Box plots indicate median, interquartile range, and minimum/maximum. One-way ANOVA with Tukey’s multiple comparisons, ****P = 1.00 × 10⁻⁶. d,e, CD19+ and CD3+ cell numbers and percentages of live. One-way ANOVA with Tukey’s multiple comparisons, ****P = 1.00 × 10⁻⁶. f, Ratio of the percentage of CD19+ and CD3+ compared to day 0 steady state. Box plots indicate median, interquartile range, and minimum/maximum. Dotted line marks control. Mann–Whitney test (two tailed), **P = 0.0033. g, Total number of LECs (left), BECs (middle), and FRCs (right) after IFA/OVA immunization, ± ROCK inhibition (Y27632). Box plot indicates median, interquartile range, and minimum/maximum. One-way ANOVA with Tukey’s multiple comparisons, ****P = 1.00 × 10⁻⁶, **P = 0.0016, *P < 0.05. h, Scatter plots of FRC numbers against initial recoil velocity. Each dot represents the mean ± s.d. for both Y27 (Figs. 8g and 3f) and ΔPDPN (Figs. 7m and 6h) cell number and initial recoil velocity. Source data
Extended Data Fig. 1
Extended Data Fig. 1. Flow cytometry of PDGFRαmGFP fibroblasts, ex vivo laser ablation and immunization.
a-b) Flow cytometric gating strategy and representative dot plots and percentages of a) CD45 stroma cells and b) subpopulations. Fibroblastic reticular cells (FRC, PDPN+CD31), blood endothelial cells (BEC, PDPNCD31+), lymphatic endothelial cells (LEC, PDPN+CD31+). Red arrow shows GFP+ FRCs c) Representative gating of GFP+ Fibroblasts. d) A membrane-targeted GFP molecule is driven under the PDGFRα promoter. e) LN nodes were embedded in low melt agarose and sliced at 200 μm thickness before being secured by cover glass for imaging. f) IFA/OVA is used as model immunization with inguinal draining (dr) and non-draining (nDr) lymph nodes (LNs) harvested day 3 or day 5 post immunization (right). This figure supports Figs. 1–2.
Extended Data Fig. 2
Extended Data Fig. 2. Analysis of ECM structures at Day 3 and Day 5 post-immunization.
a) 2nd Harmonic (magenta) signals visualize the ECM network in vibratome sections of lymph nodes. Scale bar, 15 μm. b) Quantification of ECM fiber thickness between day 3 and day 5 samples. Violin indicates plot indicates median and minimum/maximum. One-way ANOVA with Tukey’s multiple comparisons, ****p = 1.00E^−6. n = 75 individual fiber ROI for all groups from 3 independent LNs. This figure supports Fig. 3. Source data
Extended Data Fig. 3
Extended Data Fig. 3. Y27 treatment of lymph node slices reduce tension in the FRC network.
a-c) Recoil curves show displacement over time (mean ± SEM) (top panel). Individual recoil curves of control (middle) and Y27 treated LNs (bottom). n = individual ablation where Day 0 (n = 54), Day 0 + Y27 (n = 43), Day 3 (n = 18), Day 3 + Y27 (n = 20), Day 5 (n = 19), Day 5 + Y27 (n = 15) over 3 independent experiments. d) Membrane GFP visualizes the FRC network in the ex vivo lymph node slice. Y27 treatment has no effect on the FRC network connectivity. Scale bar, 50 μm. This figure supports Fig. 3. Source data
Extended Data Fig. 4
Extended Data Fig. 4. Induction of PDPN mutants in PDPN KO fibroblastic reticular cell line.
a) Schema of exogenous PDPN mutants and interaction with CLEC-2. Green arrow denotes active signaling by PDPN leading to actomyosin contractility, red arrow indicates inhibition of PDPN signaling and reduction in actomyosin contractility. b) Trap force measurements of FRCs expressing PDPN mutants after pre-treatment of CLEC-2. Box plot indicates median, interquartile range and minimum/maximum. One-way ANOVA with Tukey’s multiple comparisons, ****p = 1.00E^−6. n = individual cells where CLEC-2- PDPN CTRL (n = 41), CLEC-2+ PDPN CTRL (n = 57), CLEC-2- T34A (n = 18), CLEC-2+ T34A (n = 22), CLEC-2- S167A-S171A (n = 32), CLEC-2+ S167A-S171A (n = 33) analyzed over 5 independent experiments. c) Trap force measurements of PDPN CRISPR KO FRCs treated with CTRL or CLEC-2 supernatant. Box plot indicates median, interquartile range and minimum/maximum. One-way ANOVA with Tukey’s multiple comparisons. n = individual cells where PDPN KO (n = 20), CTRL SUP+ PDPN KO (n = 5), CLEC-2+ SUP PDPN KO (n = 7) over 2 independent experiments. d) Fold induction of exogenous PDPN, based on PDPN staining geometric mean, for each PDPN mutant cell line treated with or without doxycycline. PDPN CTRL (left), PDPN T34A (middle) and PDPN DSS (right). Mean ±SD error bars, N = 6. e) Trap force measurements of CTRL and CD44 (purple) KO FRCs. Box plot indicates median, interquartile range and minimum/maximum. Mann–Whitney test (two-tailed). n = individual cells where CTRL (n = 48) and CD44 KO (n = 10). f) Representative immunoblot of pERM in CTRL FRCs after treatment with CLEC-2. n = 2 independent experiments. g) Schema and equation to calculate trap force (Ft) from displacement. This figure supports Fig. 4. Source data
Extended Data Fig. 5
Extended Data Fig. 5. Membrane access of fibroblastic reticular cells is increased through the CLEC-2/PDPN signaling axis.
a) Schematic of osmotic shock experiment, inducing swelling by altering osmolarity. b) Representative stills of FRC in isotonic control media. Scale bar, 25 μm. c-d) Time course of c) PDPN T34A FRCs with or without CLEC-2 treatment in hypotonic conditions, and d) time course of PDPN CTRL vs PDPN shRNA KD FRCs in extreme hypotonic conditions (H20). Stills (left) show swelling of cells in hypotonic media. White dotted circle marks initial size before swelling and is compared to swelling at t = 20 (black dotted circle). Scale bar, 25 μm. Change in diameter ratio over time (middle, mean ± SEM). Swelling ratio comparisons between control and c) CLEC-2 treatment or d) PDPN shRNA KD FRCs at 15 min post swelling (orange dotted line, right). Box plot indicates median, interquartile range and minimum/maximum. One-way ANOVA with Tukey’s multiple comparisons. c) n = individual cells where CLEC-2- ISO (n = 42), CLEC-2- HYPO (n = 47), CLEC-2+ ISO (n = 34), CLEC-2+ HYPO (n = 29) analyzed over 5 independent experiments. d) n = individual cells where Control ISO (n = 19), Control H20 (n = 20), PDPN KD ISO (n = 19), PDPN KD H20 (n = 5) analyzed over 5 independent experiments. This figure supports Fig. 4. Source data
Extended Data Fig. 6
Extended Data Fig. 6. Flow cytometry of PdgframGFPΔPDPN fibroblasts.
a) Example PDPN contour plots for GFP+ FRCs from control and PdgframGFPΔPDPN LNs. b) Representative histograms of surface protein expression for PDPN in control and PdgframGFPΔPDPN LNs 5 Days post CFA/OVA. c) Fold change in PDPN expression (gMFI) in FRCs (GFP+ CD31, CD140a+ CD31). Box plot indicates median, interquartile range and minimum/maximum. One-way ANOVA with Tukey’s multiple comparisons. ****p = 1.00E^−6, ***p = 0.000143, 0.0004, **p = 0.0084, *p = 0.0145. d) Fold change in PDPN expression (gMFI) for LECs (PDPN+ CD31+). Box plot indicates median, interquartile range and minimum/maximum. One-way ANOVA with Tukey’s multiple comparisons. **p = 0.0033. c, d) n = individual LNs where (n = 12), Day 0ΔPDPN (n = 12), Day 5 (n = 6), Day 5ΔPDPN(n = 8) over 2 independent experiments. This figure supports Figs. 6, 7. Source data
Extended Data Fig. 7
Extended Data Fig. 7. Flow cytometry T-cell gating strategy.
a) Example dot plots and percentages of CD45+, CD45, CD19+, CD3+ populations and FMOs. b) Example dot plots and percentages of CD3+ CD4+ subpopulations and FMOs. c) Example dot plots and percentages of CD3+ CD8a+ subpopulations and FMOs. This figure supports Fig. 7.
Extended Data Fig. 8
Extended Data Fig. 8. T-cell activation and proliferation is not altered by PDPN deletion or Y27 treatment.
a) Representative flow cytometric gating and cell number comparing control and PdgframGFPΔPDPN CD3+ CD4+ CD25+, CD3+ CD8+ CD25+ population. Box plot indicates median, interquartile range and minimum/maximum. One-way ANOVA with Tukey’s multiple comparisons, ****p = 1.00E^−6, **p = 0.0046, 0.0063. n = individual LNs where Day 0 (n = 12), Day 0ΔPDPN (n = 12), Day 5 (n = 7), Day 5ΔPDPN(n = 8) over 2 independent experiments. b) Representative images of Ki67+ CD3+ staining of PBS or Y27 treated lymph nodes. Scale bar, 100 μm. c) Quantification of Ki67+ CD3+ T cells per area. Box plot indicates median, interquartile range and minimum/maximum. One-way ANOVA with Tukey’s multiple comparisons, ****p = 1.00E^−6. n = individual image ROIs where Day 0 (n = 13), Day 0 + Y27 (n = 15), Day 5 (n = 18), Day 5 + Y27 (n = 20) from 3 independent LNs. This figure supports Figs. 7 and 8. Source data
Extended Data Fig. 9
Extended Data Fig. 9. Flow cytometry gating strategy and Ki67 measurements.
a-b) CD3+ CD4+ and CD3+ CD8+ subpopulation cell numbers + /- ROCK inhibition (Y27632). Box plot indicates median, interquartile range and minimum/maximum. One-way ANOVA with Tukey’s multiple comparisons, ****p = 1.00E^−6, *p = 0.0387, 0.0117, 0.0201, 0.0226. n = individual LNs where Day 0 (n = 28), Day 0Y27 (n = 28), Day 5 (n = 7), Day 5Y27(n = 9) over 2 independent experiments. c) Example of Ki67+ FRCs cell plots and histogram of Ki67 geometric mean, comparing immunization and Y27 treatments. d) Quantification of Ki67+ FRCs. Box plot indicates median, interquartile range and minimum/maximum. One-way ANOVA with Tukey’s multiple comparisons. ****p = 1.00E^−6, ***p = 1.00E^−5. n = individual LNs where Day 0 (n = 28), Day 0Y27 (n = 29), Day 5 (n = 14), Day 5Y27(n = 15) over 5 independent experiments. This figure supports Fig. 8. Source data
Extended Data Fig. 10
Extended Data Fig. 10. Immunoblot of pERM in CTRL FRCs after treatment with CLEC2.
a) Immunoblot and ladder (kDa) for pERM and PDPN. b) Immunoblot and ladder (kDa) for beta-Tubulin.

Comment in

  • Mechanics drive lymph node expansion.
    Alapan Y, Thomas SN. Alapan Y, et al. Nat Immunol. 2022 Aug;23(8):1139-1141. doi: 10.1038/s41590-022-01277-0. Nat Immunol. 2022. PMID: 35882935 No abstract available.

References

    1. Petridou NI, Spiró Z, Heisenberg CP. Multiscale force sensing in development. Nat. Cell Biol. 2017;19:581–588. doi: 10.1038/ncb3524. - DOI - PubMed
    1. Wyatt T, Baum B, Charras G. A question of time: tissue adaptation to mechanical forces. Curr. Opin. Cell Biol. 2016;38:68–73. doi: 10.1016/j.ceb.2016.02.012. - DOI - PubMed
    1. Acton SE, et al. Dendritic cells control fibroblastic reticular network tension and lymph node expansion. Nature. 2014;514:498–502. doi: 10.1038/nature13814. - DOI - PMC - PubMed
    1. Astarita JL, et al. The CLEC-2-podoplanin axis controls the contractility of fibroblastic reticular cells and lymph node microarchitecture. Nat. Immunol. 2015;16:75–84. doi: 10.1038/ni.3035. - DOI - PMC - PubMed
    1. Yang C-Y, et al. Trapping of naive lymphocytes triggers rapid growth and remodeling of the fibroblast network in reactive murine lymph nodes. Proc. Natl Acad. Sci. U. S. A. 2014;111:E109–E118. - PMC - PubMed

Publication types

Substances