. 2022 Jul 26;12(1):12746.
doi: 10.1038/s41598-022-17098-y.

Label-free viability assay using in-line holographic video microscopy

Affiliations

Label-free viability assay using in-line holographic video microscopy

Rostislav Boltyanskiy et al. Sci Rep. .

Abstract

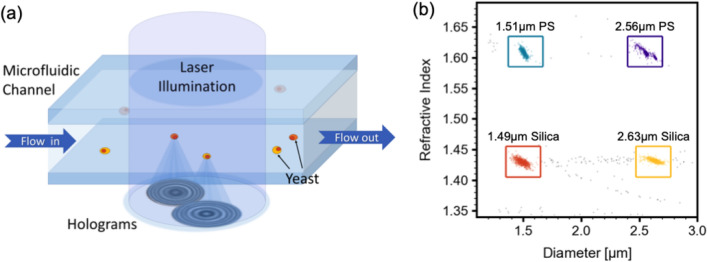
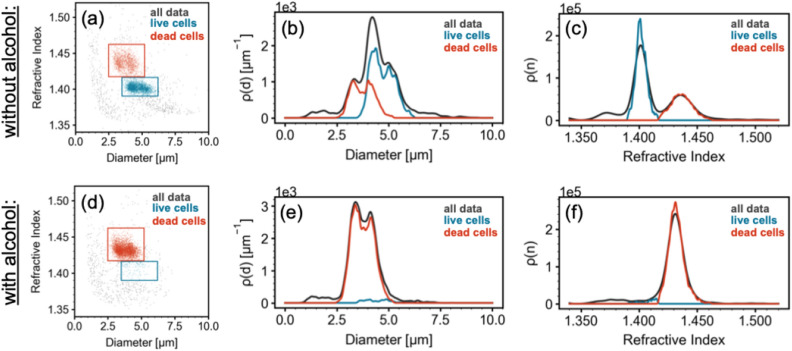
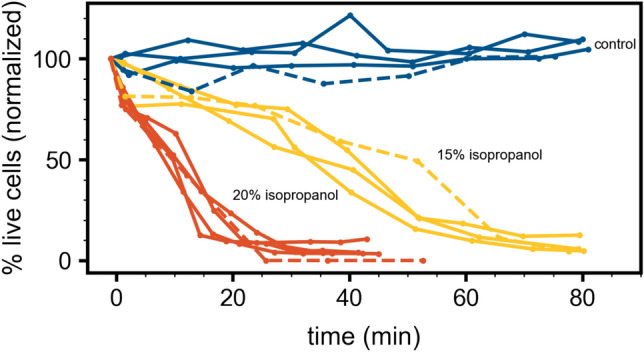
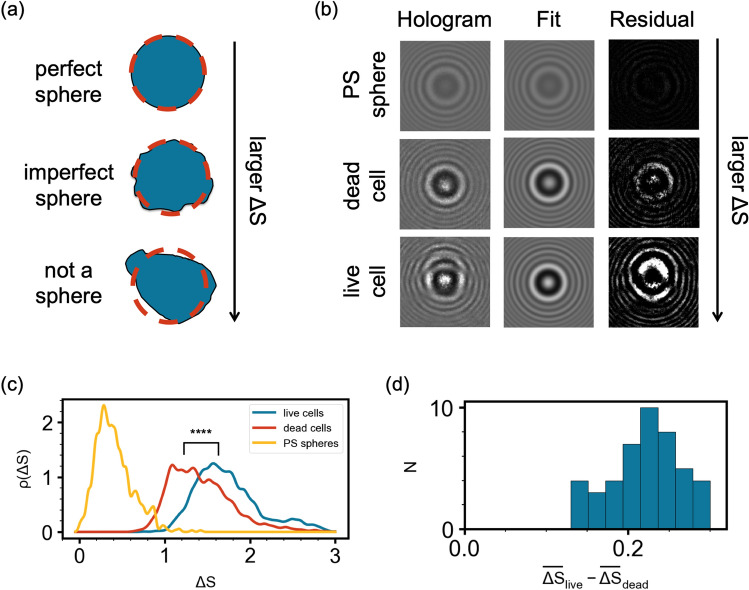
Total holographic characterization (THC) is presented here as an efficient, automated, label-free method of accurately identifying cell viability. THC is a single-particle characterization technology that determines the size and index of refraction of individual particles using the Lorenz-Mie theory of light scattering. Although assessment of cell viability is a challenge in many applications, including biologics manufacturing, traditional approaches often include unreliable labeling with dyes and/or time consuming methods of manually counting cells. In this work we measured the viability of Saccharomyces cerevisiae yeast in the presence of various concentrations of isopropanol as a function of time. All THC measurements were performed in the native environment of the sample with no dilution or addition of labels. Holographic measurements were made with an in-line holographic microscope using a 40[Formula: see text] objective lens with plane wave illumination. We compared our results with THC to manual counting of living and dead cells as distinguished with trypan blue dye. Our findings demonstrate that THC can effectively distinguish living and dead yeast cells by the index of refraction of individual cells.


Conflict of interest statement

All of the authors are employed by Spheryx, Inc. the manufacturer of xSight and xCells which were used to perform the research reported in this publication.

Figures

Figure 1
Figure 1
(a) A schematic of holographic video microscopy: as cells flow through a microfluidic chip, they are illuminated by a laser beam. Light scattered by the particles interferes with the incident light, forming holograms which are recorded on a camera. (b) A scatter plot of size on the horizontal axis and refractive index on vertical axis for 4 species of particles: 1.51μm diameter polystyrene spheres (in cyan), 2.56μm diameter polystyrene spheres (in violet), 1.49μm diameter silica spheres (in orange), 2.63μm diameter silica spheres (in yellow). Each point on the plot represents a single particle detected with THC during measurement. The colored boxed are user-defined regions of interest. Particles outside of the 4 user-defined boxes are colored gray.
Figure 2
Figure 2
(a) A scatter plot of size on the horizontal axis and refractive index on vertical axis for a yeast sample before the addition of alcohol. Each point on the plot represents a single particle that flowed through the viewing region of the microfluidic chip during THC analysis. The colored boxed are user-defined regions of interest. The points colored in orange represent dead yeast cells and the points colored in cyan represent live yeast cells. Particles outside of the user-defined boxes are colored gray. (b) Density distributions of particle size for the sample shown in (a). The orange, cyan and gray curves represents the size density distributions of dead cells, live cells, and all particles respectively. The area under each curve for a given size range represents the number of particles (of the species represented by that curve) in that size range. The peak of each curve shows the most common size of each particle type. (c) Density distributions of particle refractive index for the sample shown in (a). The coloring is the same as in (b). The area under each curve for a given refractive index range represents the number of particles (of the species represented by that curve) in that refractive index range. The peak of each curve shows the most common refractive index of each particle type. (d)–(f) Scatter plot, size density plot, and refractive index density plot as in (a)–(c) but for a yeast sample that was exposed to 15% isopropanol by volume for 71 min.
Figure 3
Figure 3
The horizontal axis represents time after the addition of alcohol. The vertical axis represented the percentage of live cells normalized by the initial time point before alcohol was added. All solid curves are measurements with THC and all dashed curves are staining measurements with trypan blue. The blue curves represent results from the control samples with no alcohol. The yellow curves represent results from samples with 15% isopropanol by volume. The orange curves represent results from the samples with 20% isopropanol by volume.
Figure 4
Figure 4
Typical results of a trypan blue exclusion assay. (a) A grid cell showing a mix of live and dead yeast cells. Live cells do not absorb the dye and appear light gray. They are identified with blue arrows. Dead cells are permeable to the dye and appear dark blue/gray. They are identified with orange arrows (b) A grid cell showing cells with an inconclusive viability status based on the trypan blue exclusion assay. Those with an inconclusive status are circumscribed by gray circles.
Figure 5
Figure 5
(a) Schematic of particles with increasing deviation from symmetry top to bottom. The orange dotted circle represents the estimated sphere that most closely approximates the given particle. (b) Holograms, fits to Lorenz–Mie theory, and residuals (left to right, respectively) of a polystyrene sphere, a dead yeast cell, and a live yeast cell (top to bottom, respectively). (c) Probability density distributions of deviation from symmetry, ΔS, of 1.54μm polystyrene spheres (in yellow), dead yeast cells (in orange), and live yeast cells (in cyan). (d) A histogram of differences between the means of ΔS of live and dead yeast cells for 45 sample measurements.

References

    1. Parapouli M, Vasileiadis A, Afendra A-S, Hatziloukas E. Saccharomyces cerevisiae and its industrial applications. AIMS Microbiol. 2020;6:1–32. doi: 10.3934/microbiol.2020001. - DOI - PMC - PubMed
    1. Botstein D, Fink GR. Yeast: An experimental organism for 21st century biology. Genetics. 2011;189:695–704. doi: 10.1534/genetics.111.130765. - DOI - PMC - PubMed
    1. Duina AA, Keeney JB, Miller ME. Budding yeast for budding geneticists: A primer on the saccharomyces cerevisiae model system. Genetics. 2014;197:33–48. doi: 10.1534/genetics.114.163188. - DOI - PMC - PubMed
    1. Guaragnella N, et al. The expanding role of yeast in cancer research and diagnosis: insights into the function of the oncosuppressors p53 and brca1/2. FEMS Yeast Res. 2014;14:2–16. doi: 10.1111/1567-1364.12094. - DOI - PubMed
    1. Pray L. LH Hartwell’s yeast: A model organism for studying somatic mutations and cancer. Nat. Educ. 2008;1:183.

Publication types

Substances

LinkOut - more resources