. 2022 Jul 27;20(1):235.
doi: 10.1186/s12916-022-02434-w.

Severe inflammation in new-borns induces long-term cognitive impairment by activation of IL-1β/KCC2 signaling during early development

Affiliations

Severe inflammation in new-borns induces long-term cognitive impairment by activation of IL-1β/KCC2 signaling during early development

Donghang Zhang et al. BMC Med. .

Abstract

Background: Neonatal sepsis can induce long-term cognitive impairment in adolescence or adulthood, but the underlying molecular mechanism is not fully understood. The expression of K+-Cl- co-transporter 2 (KCC2) plays a pivotal role in the GABAergic shift from depolarizing to hyperpolarizing during early postnatal development. In this study, we aimed to determine whether neonatal severe inflammation-induced cognitive impairment was associated with the expression of KCC2 during early development.

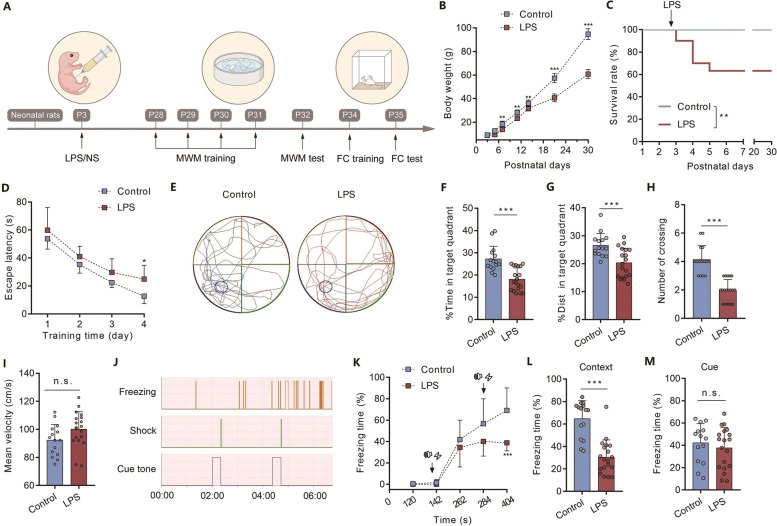
Methods: Neonatal severe inflammation was established by intraperitoneal injection of high dose lipopolysaccharide (LPS, 1 mg kg-1) in postnatal day 3 (P3) rats. The Morris water maze task and fear conditioning test were used to investigate long-term cognitive functions. ELISA, RT-PCR and Western blotting were used to examine the expression levels of proinflammatory cytokines and KCC2. Perforated patch-clamping recordings were used to determine the GABAergic shift.

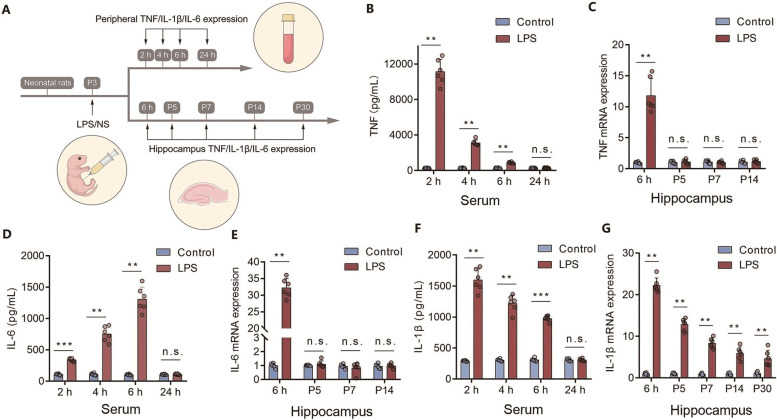
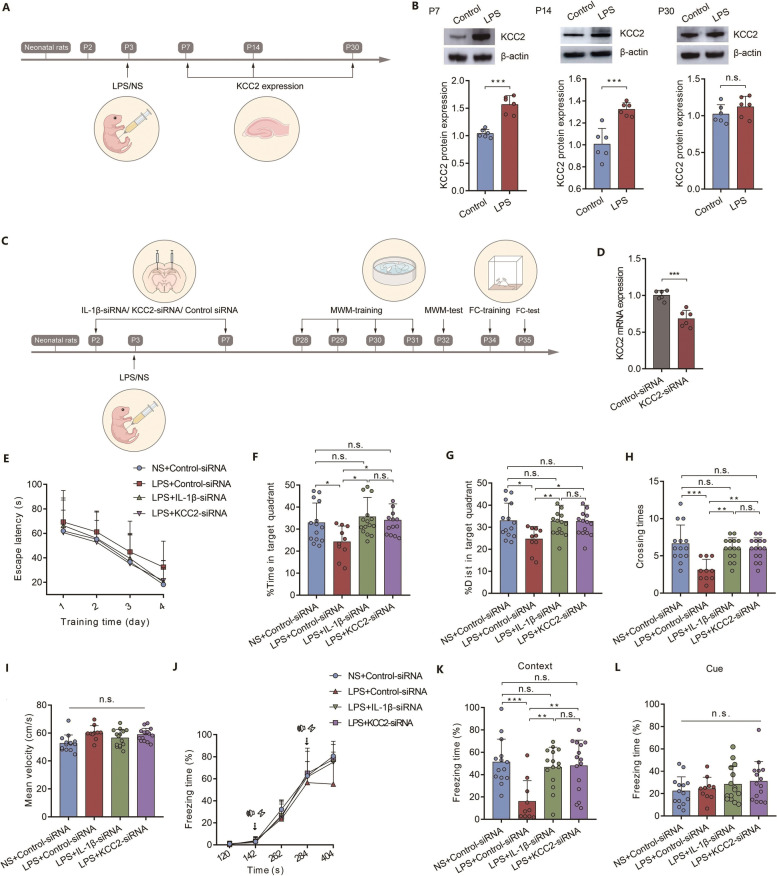
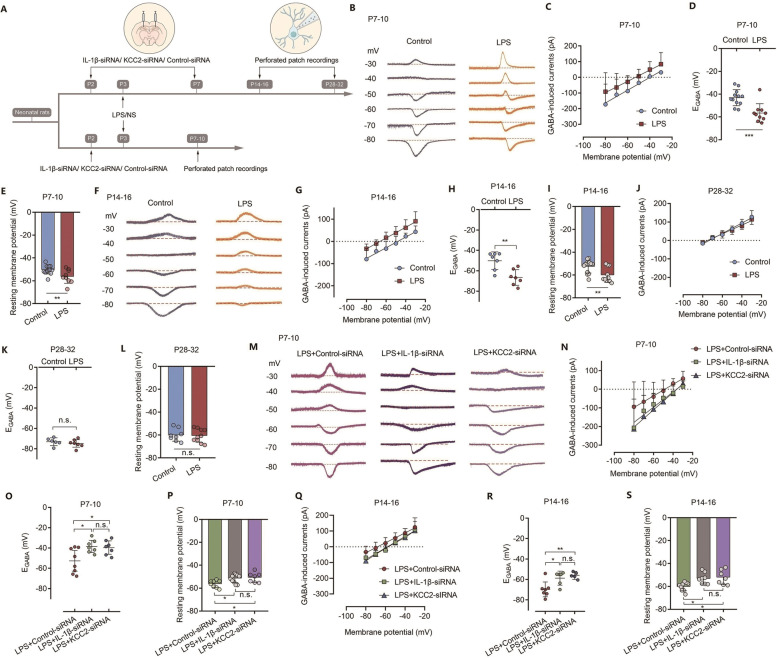
Results: Neonatal severe inflammation led to long-term cognitive impairment in rats. Meanwhile, sustained elevation of interleukin-1 beta (IL-1β) levels was found in the hippocampus until P30 after LPS injection. Elevated expression of KCC2 and hyperpolarized GABA reversal potential (EGABA) were observed in CA1 hippocampal pyramidal neurons from the P7-P10 and P14-P16 rats after LPS injection. Specific knockdown of IL-1β mRNA expression rescued the elevated expression of KCC2 and the hyperpolarized EGABA at P7-P10 and P14-P16. Accordingly, specific knockdown of IL-1β or KCC2 expression improved the cognitive impairment induced by neonatal severe inflammation.

Conclusions: Sustained elevation of IL-1β in the hippocampus may induce cognitive impairment by upregulation of KCC2 during early development.

Keywords: Cognitive impairment; GABAergic shift; IL-1β; KCC2; Neonatal inflammation; Sepsis.


Conflict of interest statement

The authors declare that they have no competing interests.

Figures

Fig. 1
Fig. 1
Neonatal severe inflammation leads to long-lasting cognitive impairment in adolescent rats. (A) Schematic illustrating the chronological order used for the establishment of the inflammation model and cognitive testing. Five litters were used in this cohort of experiment. (B) The development of body weight in rats (n = 8). (C) The survival curve of rats. (D) Learning curve for the escape latency. (E) Representative traces for the MWM test. (F) The time spent in the target quadrant (n = 15–19). (G) Distance spent in the target quadrant (n = 15–19). (H) Number of platform crossings (n = 15–19). (I) Mean velocity during the spatial probe test (n = 15–19). (J) The experimental protocol for FC. (K) The freezing time of rats during FC training. (L) The freezing time of rats in the context FC test (n = 15–19). (M) The freezing time of rats in the cued FC test (n = 15–19). LPS: lipopolysaccharide; NS: normal saline; MWM: Morris water maze; FC: fear conditioning; Panels B, D, and K were compared by two-way ANOVA with repeated measures followed by a Bonferroni post hoc test; Panel C was compared by log-rank test; Panels F, G, H, I, L, and M were compared by unpaired two-tailed Student’s t test; * P < 0.05, ** P < 0.01, and *** P < 0.001, n.s.: no significance; Error bars indicate SD
Fig. 2
Fig. 2
Neonatal severe inflammation induces sustained elevation of IL-1β in the rat hippocampus. (A) Schematic illustrating the chronological order used for the proinflammatory cytokine test after neonatal inflammation. Fourteen litters were used in this cohort of experiment. (B, D, F) ELISA results showing the protein levels of TNF (B), IL-6 (D), and IL-1β (F) in peripheral blood serum at 2 h (n = 6), 4 h (n = 6), 6 h (n = 6), and 24 h (n = 6). (C, E, G) PCR results showing the mRNA levels of hippocampal TNF (C) and IL-6 (E) at 6 h after LPS injection (n = 6), P5 (n = 6), P7 (n = 6), and P14 (n = 6), and IL-1β after LPS injection (G) at 6 h (n = 6), P5 (n = 6), P7 (n = 6), P14 (n = 6), and P30 (n = 6). LPS: Lipopolysaccharide, NS: Normal saline, Panels B, C, D, E, F, and G were compared by unpaired two-tailed Student’s t test or Mann–Whitney U test; ** P < 0.01 and *** P < 0.001, n.s.: no significance; Error bars indicate SD
Fig. 3
Fig. 3
Sustained elevation of hippocampal IL-1β levels contributes to long-term cognitive impairment after neonatal severe inflammation. (A) Schematic illustrating the chronological order used for siRNA delivery, LPS administration and cognitive testing. Eight litters were used in this cohort of experiment. (B) PCR results showing the knockdown efficiency of IL-1β-siRNA (n = 6). (C) Learning curve for the escape latency. (D) Time spent in the target quadrant (n = 15–24). (E) Distance spent in the target quadrant (n = 15–24). (F) Number of platform crossings (n = 15–24). (G) Mean velocity during the spatial probe test (n = 15–24). (H) The freezing time of rats in FC training. (I) The freezing time of rats in the context FC test (n = 15–24). (J) The freezing time of rats in the cued FC test (n = 15–24). LPS: lipopolysaccharide; NS: normal saline; MWM: Morris water maze; FC: fear conditioning; Panel B was compared by unpaired two-tailed Student’s t test; Panels C and H were compared by two-way ANOVA with repeated measures followed by a Bonferroni post hoc test; Panels D, E, F, G, I, and J were compared by one-way ANOVA with repeated measures followed by a Tukey post hoc test; ** P < 0.01 and *** P < 0.001, n.s.: no significance; Error bars indicate SD
Fig. 4
Fig. 4
KCC2 mediates the effects of IL-1β on neonatal severe inflammation-induced cognitive impairment. (A) Schematic illustrating the chronological order used for the establishment of the inflammation model and KCC2 level testing. Five litters were used in this cohort of experiment. (B) The protein levels of KCC2 in P7 (left panel, n = 6), P14 (middle panel, n = 6), and P30 (right panel, n = 6) rats after LPS injection. (C) Schematic illustrating the chronological order used for siRNA injection, establishment of the inflammation model, and cognitive testing. Nine litters were used in this cohort of experiment. (D) The knockdown efficiency of KCC2-siRNA by PCR (n = 6). (E) Learning curve for the escape latency. (F) Time spent in the target quadrant (n = 10–15). (G) Distance spent in the target quadrant (n = 10–15). (H) Number of platform crossings (n = 10–15). (I) Mean velocity during the spatial probe test (n = 10–15). (J) The freezing time of rats during FC training. (K) The freezing time of rats in the context FC test (n = 10–15). (L) The freezing time of rats in the cued FC test (n = 10–15). LPS: lipopolysaccharide; NS: normal saline; MWM: Morris water maze; FC: fear conditioning; Panels B and D were compared by unpaired two-tailed Student’s t test; Panels F, G, H, I, K and L were compared by one-way ANOVA with repeated measures followed by a Tukey post hoc test; * P < 0.05, ** P < 0.01, and *** P < 0.001, n.s.: no significance; Error bars indicate SD
Fig. 5
Fig. 5
EGABA is hyperpolarized in CA1 pyramidal neurons of rats after neonatal severe inflammation. (A) Schematic illustrating the chronological order used for siRNA delivery, LPS administration and perforated patch recordings. Fifteen litters were used in this cohort of experiment. (B) Representative traces of GABA-induced currents to the holding potential from –80 to –30 mV in 10 mV increments of hippocampal neurons at P7-P10. (C) Current–voltage (I-V) curve of GABA-induced currents recorded at different holding potentials from − 80 to − 30 mV in 10 mV increments of pyramidal neurons at P7-P10. (D) EGABA values per cell obtained from all I-V curves indicating a hyperpolarizing shift in septic rats at P7-P10 (n = 10–12 cells from 4–5 rats). (E) RMP values showing a hyperpolarizing shift in septic rats at P7-10 (n = 9–14 cells from 5–6 rats). (F) Representative traces of GABA-induced currents to the holding potential from –80 to –30 mV in 10 mV increments of hippocampal neurons at P14-P16. (G) Current–voltage (I-V) curve of GABA-induced currents recorded at different holding potentials from − 80 to − 30 mV in 10 mV increments of pyramidal neurons at P14. (H) EGABA values per cell obtained from all I-V curves indicating a hyperpolarizing shift in septic rats at P14-P16 (n = 7 cells from 3–4 rats). (I) RMP values showing a hyperpolarizing shift in septic rats at P14-P16 (n = 10–13 cells from 4–5 rats). (J) Current–voltage (I-V) curve of spontaneous GABA-induced currents recorded at different holding potentials from − 80 to − 30 mV in 10 mV increments of pyramidal neurons at P28-P32. (K) EGABA values per cell obtained from all I-V curves indicating a hyperpolarizing shift in septic rats at P28-32 (n = 6–7 cells from 3–4 rats). (L) RMP values showing a hyperpolarizing shift in septic rats at P28-P32 (n = 8–10 cells from 4–5 rats). (M) Representative traces of GABA-induced currents to the holding potential from − 80 to − 30 mV in 10 mV increments of hippocampal neurons at P7-P10 after siRNA injection. (N) Current–voltage (I-V) curve of GABA-induced currents recorded at different holding potentials from − 80 to − 30 mV in 10 mV increments of pyramidal neurons at P7-P10 after siRNA injection. (O) EGABA values per cell obtained from all I-V curves at P7-P10 after siRNA injection (n = 7–8 cells from 3–4 rats). (P) RMP values at P7-P10 after siRNA injection (n = 7–11 cells from 4–5 rats). (Q) Current–voltage (I-V) curve of GABA-induced currents recorded at different holding potentials from − 80 to − 30 mV in 10 mV increments of pyramidal neurons at P14-P16 after siRNA injection. (R) EGABA values per cell obtained from all I-V curves at P14-P16 after siRNA injection (n = 5–7 cells from 3–4 rats). (S) RMP values at P14-P16 after siRNA injection (n = 7–9 cells from 3–4 rats). LPS: lipopolysaccharide; NS: normal saline; EGABA: GABA reversal potential; Panels D, E, H, I, K, and L were compared by unpaired two-tailed Student’s t test; Panels O, P, R, and S were compared by one-way ANOVA with repeated measures followed by a Tukey post hoc test; * P < 0.05, ** P < 0.01, and *** P < 0.001, n.s.: no significance; Error bars indicate SD

References

    1. Singer M, Deutschman CS, Seymour CW, Shankar-Hari M, Annane D, Bauer M, Bellomo R, Bernard GR, Chiche JD, Coopersmith CM, et al. The Third International Consensus Definitions for Sepsis and Septic Shock (Sepsis-3) JAMA. 2016;315(8):801–810. doi: 10.1001/jama.2016.0287. - DOI - PMC - PubMed
    1. Edmond K, Zaidi A. New approaches to preventing, diagnosing, and treating neonatal sepsis. PLoS Med. 2010;7(3):e1000213. - PMC - PubMed
    1. Wardlaw T, You D, Hug L, Amouzou A, Newby H. UNICEF Report: enormous progress in child survival but greater focus on newborns urgently needed. Reprod Health. 2014;11:82. - PMC - PubMed
    1. Markwart R, Saito H, Harder T, Tomczyk S, Cassini A, Fleischmann-Struzek C, Reichert F, Eckmanns T, Allegranzi B. Epidemiology and burden of sepsis acquired in hospitals and intensive care units: a systematic review and meta-analysis. Intensive Care Med. 2020;46(8):1536–1551. - PMC - PubMed
    1. Lawn JE, Cousens S, Zupan J. 4 million neonatal deaths: when? Where? Why? Lancet. 2005;365(9462):891–900. - PubMed

Publication types