

Effects of the Probiotic, Lactobacillus delbrueckii subsp. bulgaricus, as a Substitute for Antibiotics on the Gastrointestinal Tract Microbiota and Metabolomics Profile of Female Growing-Finishing Pigs
- PMID: 35883325
- PMCID: PMC9311557
- DOI: 10.3390/ani12141778
Effects of the Probiotic, Lactobacillus delbrueckii subsp. bulgaricus, as a Substitute for Antibiotics on the Gastrointestinal Tract Microbiota and Metabolomics Profile of Female Growing-Finishing Pigs
Abstract
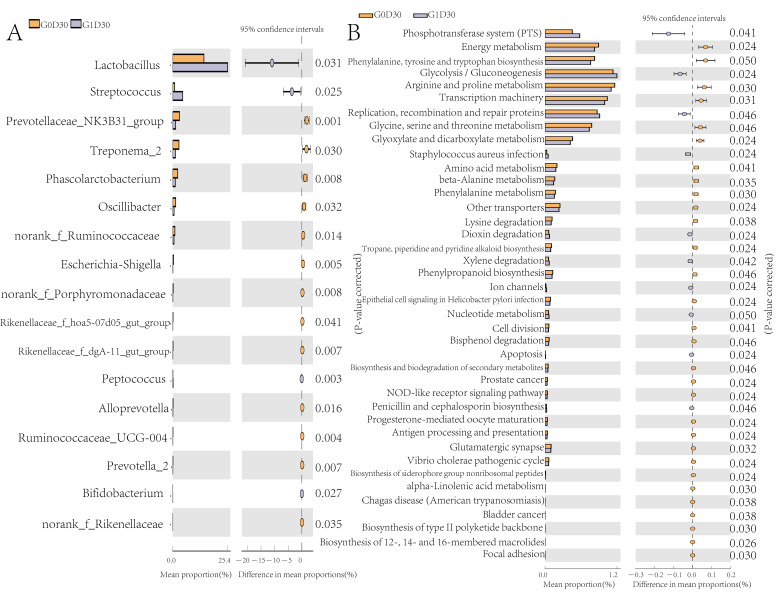
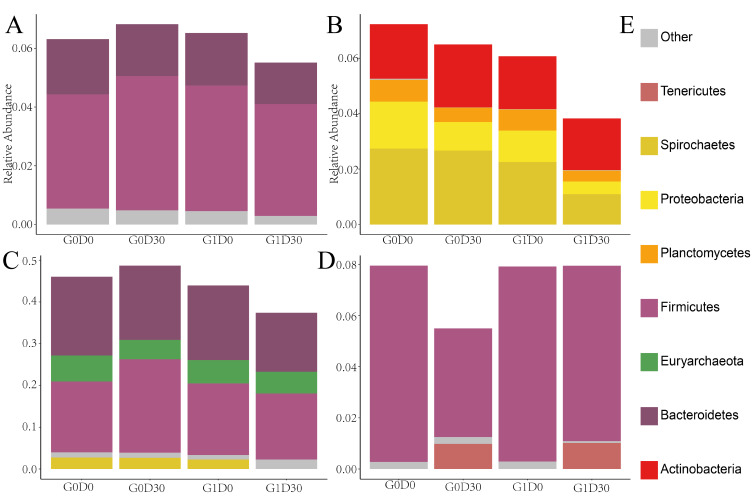
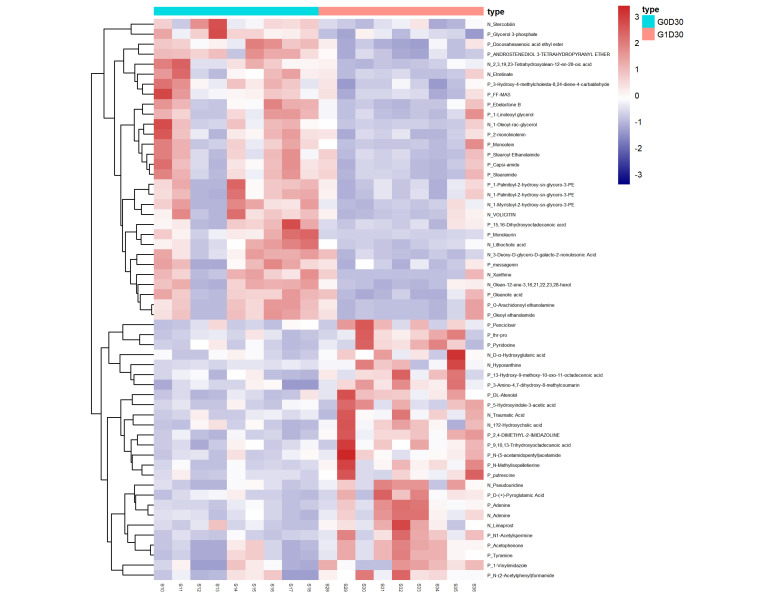
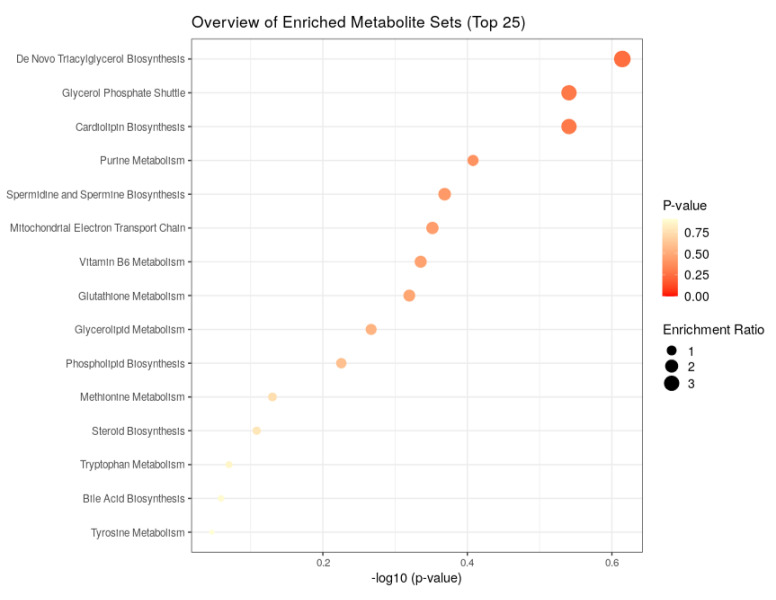
Lactobacillus delbrueckii subsp. bulgaricus (LDB) is an approved feed additive on the Chinese ‘Approved Feed Additives’ list. However, the possibility of LDB as an antibiotic replacement remains unclear. Particularly, the effect of LDB on microbiota and metabolites in the gastrointestinal tract (GIT) requires further explanation. This study aimed to identify the microbiota and metabolites present in fecal samples and investigate the relationship between the microbiota and metabolites to evaluate the potential of LDB as an antibiotic replacement in pig production. A total of 42 female growing-finishing pigs were randomly allocated into the antibiotic group (basal diet + 75 mg/kg aureomycin) and LDB (basal diet + 3.0 × 10⁹ cfu/kg LDB) groups. Fecal samples were collected on days 0 and 30. Growth performance was recorded and assessed. 16S rRNA sequencing and liquid chromatography-mass spectrometry-based non-targeted metabolomics approaches were used to analyze the differences in microbiota and metabolites. Associations between the differences were calculated using Spearman correlations with the Benjamini−Hochberg adjustment. The LDB diet had no adverse effect on feed efficiency but slightly enhanced the average daily weight gain and average daily feed intake (p > 0.05). The diet supplemented with LDB increased Lactobacillus abundance and decreased that of Prevotellaceae_NK3B31_group spp. Dietary-supplemented LDB enhanced the concentrations of pyridoxine, tyramine, D-(+)-pyroglutamic acid, hypoxanthine, putrescine and 5-hydroxyindole-3-acetic acid and decreased the lithocholic acid concentration. The Lactobacillus networks (Lactobacillus, Peptococcus, Ruminococcaceae_UCG-004, Escherichia-Shigella, acetophenone, tyramine, putrescine, N-methylisopelletierine, N1-acetylspermine) and Prevotellaceae_NK3B31_group networks (Prevotellaceae_NK3B31_group, Treponema_2, monolaurin, penciclovir, N-(5-acetamidopentyl)acetamide, glycerol 3-phosphate) were the most important in the LDB effect on pig GIT health in our study. These findings indicate that LDB may regulate GIT function through the Lactobacillus and Prevotellaceae_NK3B31_group networks. However, our results were restrained to fecal samples of female growing-finishing pigs; gender, growth stages, breeds and other factors should be considered to comprehensively assess LDB as an antibiotic replacement in pig production.
Keywords: Lactobacillus delbrueckii subsp. bulgaricus; co-occurrence network; gastrointestinal tract; metabolites; microbiota.
Conflict of interest statement
The authors declare no conflict of interest.
Figures


Similar articles
-
Integrated Microbiome and Serum Metabolome Analysis Reveals Molecular Regulatory Mechanisms of the Average Daily Weight Gain of Yorkshire Pigs.Animals (Basel). 2024 Jan 16;14(2):278. doi: 10.3390/ani14020278. Animals (Basel). 2024. PMID: 38254447 Free PMC article.
-
Safety and robustness aspects analysis of Lactobacillus delbrueckii ssp. bulgaricus LDB-C1 based on the genome analysis and biological tests.Arch Microbiol. 2021 Sep;203(7):3955-3964. doi: 10.1007/s00203-021-02383-7. Epub 2021 May 22. Arch Microbiol. 2021. PMID: 34021387
-
Lactobacillus delbrueckii ssp. bulgaricus B-30892 can inhibit cytotoxic effects and adhesion of pathogenic Clostridium difficile to Caco-2 cells.Gut Pathog. 2009 Apr 27;1(1):8. doi: 10.1186/1757-4749-1-8. Gut Pathog. 2009. PMID: 19397787 Free PMC article.
-
Selective and differential enumerations of Lactobacillus delbrueckii subsp. bulgaricus, Streptococcus thermophilus, Lactobacillus acidophilus, Lactobacillus casei and Bifidobacterium spp. in yoghurt--a review.Int J Food Microbiol. 2011 Oct 3;149(3):194-208. doi: 10.1016/j.ijfoodmicro.2011.07.008. Epub 2011 Jul 21. Int J Food Microbiol. 2011. PMID: 21807435 Review.
-
Gut Health and Influencing Factors in Pigs.Animals (Basel). 2023 Apr 14;13(8):1350. doi: 10.3390/ani13081350. Animals (Basel). 2023. PMID: 37106913 Free PMC article. Review.
Cited by
-
Combined supplementation with Lactobacillus sp. and Bifidobacterium thermacidophilum isolated from Tibetan pigs improves growth performance, immunity, and microbiota composition in weaned piglets.J Anim Sci. 2023 Jan 3;101:skad220. doi: 10.1093/jas/skad220. J Anim Sci. 2023. PMID: 37358243 Free PMC article.
-
Microbial ecology of selected traditional Ethiopian fermented products.Front Microbiol. 2025 Jun 2;16:1570914. doi: 10.3389/fmicb.2025.1570914. eCollection 2025. Front Microbiol. 2025. PMID: 40529576 Free PMC article.
-
Paederia scandens extract alleviates obesity via modulating the gut microbiota and serum metabolome disorder.Front Microbiol. 2025 Apr 23;16:1554537. doi: 10.3389/fmicb.2025.1554537. eCollection 2025. Front Microbiol. 2025. PMID: 40336829 Free PMC article.
-
Dietary Lactobacillus delbrueckii Affects Ileal Bacterial Composition and Circadian Rhythms in Pigs.Animals (Basel). 2024 Jan 26;14(3):412. doi: 10.3390/ani14030412. Animals (Basel). 2024. PMID: 38338054 Free PMC article.
-
Integrated Microbiome and Serum Metabolome Analysis Reveals Molecular Regulatory Mechanisms of the Average Daily Weight Gain of Yorkshire Pigs.Animals (Basel). 2024 Jan 16;14(2):278. doi: 10.3390/ani14020278. Animals (Basel). 2024. PMID: 38254447 Free PMC article.
References
-
- Pourrajab B., Fatahi S., Sohouli M.H., Găman M.A., Shidfar F. The effects of probiotic/synbiotic supplementation compared to placebo on biomarkers of oxidative stress in adults: A systematic review and meta-analysis of randomized controlled trials. Crit. Rev. Food Sci. Nutr. 2022;62:490–507. doi: 10.1080/10408398.2020.1821166. - DOI - PubMed
-
- Yan R., Wang K., Wang Q., Jiang H., Lu Y., Chen X., Zhang H., Su X., Du Y., Chen L., et al. Probiotic Lactobacillus casei Shirota prevents acute liver injury by reshaping the gut microbiota to alleviate excessive inflammation and metabolic disorders. Microb. Biotechnol. 2022;15:247–261. doi: 10.1111/1751-7915.13750. - DOI - PMC - PubMed
-
- Colombo E.A., Cooke R.F., Brandão A.P., Wiegand J.B., Schubach K.M., Sowers C.A., Duff G.C., Block E., Gouvêa V.N. Performance, health, and physiological responses of newly received feedlot cattle supplemented with pre- and probiotic ingredients. Animal. 2021;15:100214. doi: 10.1016/j.animal.2021.100214. - DOI - PubMed
Grants and funding
LinkOut - more resources
Full Text Sources
Miscellaneous
