. 2022 Jun 23;12(7):872.
doi: 10.3390/biom12070872.

Development of a Biotechnology Platform for the Fast-Growing Cyanobacterium Synechococcus sp. PCC 11901

Affiliations

Development of a Biotechnology Platform for the Fast-Growing Cyanobacterium Synechococcus sp. PCC 11901

Lauren A Mills et al. Biomolecules. .

Abstract

Synechococcus sp. PCC 11901 reportedly demonstrates the highest, most sustained growth of any known cyanobacterium under optimized conditions. Due to its recent discovery, our knowledge of its biology, including the factors underlying sustained, fast growth, is limited. Furthermore, tools specific for genetic manipulation of PCC 11901 are not established. Here, we demonstrate that PCC 11901 shows faster growth than other model cyanobacteria, including the fast-growing species Synechococcuselongatus UTEX 2973, under optimal growth conditions for UTEX 2973. Comparative genomics between PCC 11901 and Synechocystis sp. PCC 6803 reveal conservation of most metabolic pathways but PCC 11901 has a simplified electron transport chain and reduced light harvesting complex. This may underlie its superior light use, reduced photoinhibition, and higher photosynthetic and respiratory rates. To aid biotechnology applications, we developed a vitamin B12 auxotrophic mutant but were unable to generate unmarked knockouts using two negative selectable markers, suggesting that recombinase- or CRISPR-based approaches may be required for repeated genetic manipulation. Overall, this study establishes PCC 11901 as one of the most promising species currently available for cyanobacterial biotechnology and provides a useful set of bioinformatics tools and strains for advancing this field, in addition to insights into the factors underlying its fast growth phenotype.

Keywords: CodA selection; SacB selection; Synechococcus sp. PCC 11901; cellular metabolism; comparative genomics; photoinhibition; photosynthesis; vitamin B12.


Conflict of interest statement

The authors declare no conflict of interest.

Figures

Figure 1
Figure 1
(A) Growth and (B) biomass accumulation of cyanobacterial species. Strains were cultured at 38 °C under 900 µmol photons m−2 s−1 continuous light intensity and with direct bubbling of air/5% CO2. Error bars indicate SD. Asterisks indicate significant differences between PCC 11901 and the other cyanobacterial species (p < 0.05).
Figure 2
Figure 2
Schematic diagram of the proposed PCC 11901 electron transport chain network. NDH-2: NAD(P)H dehydrogenase 2; SDH: Succinate dehydrogenase; NDH-1L/1L’/MS/MS’: NAD(P)H dehydrogenase 1 complexes; PBS: Phycobilisome; OCP: Orange Carotenoid Protein; PSII: Photosystem II; PQ: plastoquinone; PQH2: plastoquinol; ARTO: Alternative respiratory terminal oxidase; Cyt b6f: Cytochrome b6f; Cyt c6: cytochrome c6; PSI: Photosystem I; Fdx: ferredoxin; COX: cytochrome-c oxidase; Fld: Flavodoxin; FNR: ferredoxin-NADP+-reductase; Flv1/3: Flavodiiron 1/3; HOX: Bidirectional hydrogenase.
Figure 3
Figure 3
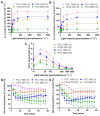
Characterization of the photosynthetic and respiratory rates, light use and photoinhibition of cyanobacterial species. (A) Oxygen evolution was measured at different light intensities, and (B) oxygen consumption was measured following each light period. (C) The coefficient of light use was calculated by dividing the net rate of oxygen evolution by the correspondent light photon flux. Photoinhibition was quantified by determining photosynthetic oxygen evolution in the (D) absence and (E) presence of lincomycin. All results are from three to ten biological replicates (number indicated in brackets after species legend). Errors bars indicate SE. Color-coded asterisks indicate significant differences between PCC 11901 and the other cyanobacterial species (p < 0.05).
Figure 4
Figure 4
Growth of wild-type and B12-independent mutants in liquid AD7 medium. Wild-type was cultured in B12 and B12+ medium. Strains were cultured at 38 °C under 300 µmol photons m−2 s−1 continuous light intensity and with direct bubbling of air/5% CO2. Error bars indicate SD. Asterisks indicate significant differences between wild-type +B12 and the other strains and wild-type −B12 (p < 0.05).
Figure 5
Figure 5
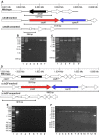
Generation of marked knockouts and attempted generation of unmarked knockouts in PCC 11901. DNA ladders are shown in lane 1 in each panel. (A) Schematic representations of locus location in the PCC 11901 genome (top) and profiles expected in wild-type and the ∆desB marked and unmarked knockouts. (B) Amplification of genomic DNA in WT (Lane 3; Expected band size: 1477 bp) and ∆desB marked mutants (Lanes 4–7) using DesBfor and DesBrev primers. Positive control is shown in lane 2. (C) Amplification of genomic DNA in the desB marked mutant (Lanes 5) and putative desB unmarked mutants (Lanes 2–4, 6) using DesBfor and DesBrev primers. (D) Schematic representations of locus location in the PCC 11901 genome (top) and profiles expected in wild-type and the ∆ctaDI marked and unmarked knockouts. (E) Amplification of genomic DNA in WT (Lane 2) and ∆ctaDI marked mutants (Lanes 4–9) using COXfor and COXrev primers. Negative control (no gDNA) is shown in lane 3. (F) Amplification of genomic DNA in putative ∆ctaDI unmarked mutants (Lanes 2–11) using COXfor and COXrev primers. Negative control (no gDNA) is shown in lane 12. Amplification of wild-type is shown in lane 13. (G) Schematic representations of locus location in the PCC 11901 genome (top) and profiles expected in wild-type and the ∆ctaCII marked and unmarked knockouts. (H) Amplification of genomic DNA in WT (Lane 3) and ∆ctaCII marked mutants (Lanes 4–7) using ARTOfor and ARTOrev primers. Negative control (no gDNA) is shown in lane 2. (I) Amplification of genomic DNA in putative ∆ctaCII unmarked mutants (Lanes 2–10) using ARTOfor and ARTOrev primers. Negative control (no gDNA) is shown in lane 11. Amplification of wild-type is shown in lane 12.
Figure 5
Figure 5
Generation of marked knockouts and attempted generation of unmarked knockouts in PCC 11901. DNA ladders are shown in lane 1 in each panel. (A) Schematic representations of locus location in the PCC 11901 genome (top) and profiles expected in wild-type and the ∆desB marked and unmarked knockouts. (B) Amplification of genomic DNA in WT (Lane 3; Expected band size: 1477 bp) and ∆desB marked mutants (Lanes 4–7) using DesBfor and DesBrev primers. Positive control is shown in lane 2. (C) Amplification of genomic DNA in the desB marked mutant (Lanes 5) and putative desB unmarked mutants (Lanes 2–4, 6) using DesBfor and DesBrev primers. (D) Schematic representations of locus location in the PCC 11901 genome (top) and profiles expected in wild-type and the ∆ctaDI marked and unmarked knockouts. (E) Amplification of genomic DNA in WT (Lane 2) and ∆ctaDI marked mutants (Lanes 4–9) using COXfor and COXrev primers. Negative control (no gDNA) is shown in lane 3. (F) Amplification of genomic DNA in putative ∆ctaDI unmarked mutants (Lanes 2–11) using COXfor and COXrev primers. Negative control (no gDNA) is shown in lane 12. Amplification of wild-type is shown in lane 13. (G) Schematic representations of locus location in the PCC 11901 genome (top) and profiles expected in wild-type and the ∆ctaCII marked and unmarked knockouts. (H) Amplification of genomic DNA in WT (Lane 3) and ∆ctaCII marked mutants (Lanes 4–7) using ARTOfor and ARTOrev primers. Negative control (no gDNA) is shown in lane 2. (I) Amplification of genomic DNA in putative ∆ctaCII unmarked mutants (Lanes 2–10) using ARTOfor and ARTOrev primers. Negative control (no gDNA) is shown in lane 11. Amplification of wild-type is shown in lane 12.

References

    1. Lea-Smith D.J., Howe C.J. The Use of Cyanobacteria for Biofuel Production. In: Love J., Bryant J.A., editors. Biofuels and Bioenergy. Wiley; New York, NY, USA: 2017.
    1. Ducat D.C., Way J.C., Silver P.A. Engineering cyanobacteria to generate high-value products. Trends Biotechnol. 2011;29:95–103. doi: 10.1016/j.tibtech.2010.12.003. - DOI - PubMed
    1. Yu J.J., Liberton M., Cliften P.F., Head R.D., Jacobs J.M., Smith R.D., Koppenaal D.W., Brand J.J., Pakrasi H.B. Synechococcus elongatus UTEX 2973, a fast growing cyanobacterial chassis for biosynthesis using light and CO2. Sci. Rep. 2015;5:8132. doi: 10.1038/srep08132. - DOI - PMC - PubMed
    1. Sezonov G., Joseleau-Petit D., D’Ari R. Escherichia coli physiology in Luria-Bertani broth. J. Bacteriol. 2007;189:8746–8749. doi: 10.1128/JB.01368-07. - DOI - PMC - PubMed
    1. Snoep J.L., Mrwebi M., Schuurmans J.M., Rohwer J.M., Teixeira de Mattos M.J. Control of specific growth rate in Saccharomyces cerevisiae. Microbiology. 2009;155:1699–1707. doi: 10.1099/mic.0.023119-0. - DOI - PubMed

Publication types

LinkOut - more resources