

Comparing Bayesian-Based Reconstruction Strategies in Topology-Based Pathway Enrichment Analysis
- PMID: 35883462
- PMCID: PMC9313337
- DOI: 10.3390/biom12070906
Comparing Bayesian-Based Reconstruction Strategies in Topology-Based Pathway Enrichment Analysis
Abstract
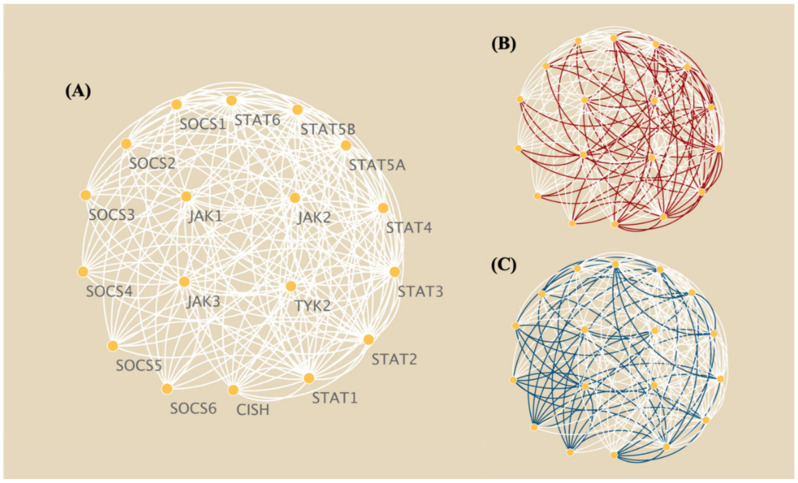
The development of high-throughput omics technologies has enabled the quantification of vast amounts of genes and gene products in the whole genome. Pathway enrichment analysis (PEA) provides an intuitive solution for extracting biological insights from massive amounts of data. Topology-based pathway analysis (TPA) represents the latest generation of PEA methods, which exploit pathway topology in addition to lists of differentially expressed genes and their expression profiles. A subset of these TPA methods, such as BPA, BNrich, and PROPS, reconstruct pathway structures by training Bayesian networks (BNs) from canonical biological pathways, providing superior representations that explain causal relationships between genes. However, these methods have never been compared for their differences in the PEA and their different topology reconstruction strategies. In this study, we aim to compare the BN reconstruction strategies of the BPA, BNrich, PROPS, Clipper, and Ensemble methods and their PEA and performance on tumor and non-tumor classification based on gene expression data. Our results indicate that they performed equally well in distinguishing tumor and non-tumor samples (AUC > 0.95) yet with a varying ranking of pathways, which can be attributed to the different BN structures resulting from the different cyclic structure removal strategies. This can be clearly seen from the reconstructed JAK-STAT networks by different strategies. In a nutshell, BNrich, which relies on expert intervention to remove loops and cyclic structures, produces BNs that best fit the biological facts. The plausibility of the Clipper strategy can also be partially explained by intuitive biological rules and theorems. Our results may offer an informed reference for the proper method for a given data analysis task.
Keywords: Bayesian network; gene expression; network reconstruction; topology-based pathway analysis.
Conflict of interest statement
The authors declare no conflict of interest.
Figures


Similar articles
-
Pathway analysis of high-throughput biological data within a Bayesian network framework.Bioinformatics. 2011 Jun 15;27(12):1667-74. doi: 10.1093/bioinformatics/btr269. Epub 2011 May 5. Bioinformatics. 2011. PMID: 21551144
-
Restricted-derestricted dynamic Bayesian Network inference of transcriptional regulatory relationships among genes in cancer.Comput Biol Chem. 2019 Apr;79:155-164. doi: 10.1016/j.compbiolchem.2019.02.006. Epub 2019 Feb 21. Comput Biol Chem. 2019. PMID: 30822674
-
Bayesian pathway analysis of cancer microarray data.PLoS One. 2014 Jul 18;9(7):e102803. doi: 10.1371/journal.pone.0102803. eCollection 2014. PLoS One. 2014. PMID: 25036210 Free PMC article.
-
Bayesian Networks for Risk Prediction Using Real-World Data: A Tool for Precision Medicine.Value Health. 2019 Apr;22(4):439-445. doi: 10.1016/j.jval.2019.01.006. Epub 2019 Mar 15. Value Health. 2019. PMID: 30975395 Review.
-
Methods and approaches in the topology-based analysis of biological pathways.Front Physiol. 2013 Oct 10;4:278. doi: 10.3389/fphys.2013.00278. Front Physiol. 2013. PMID: 24133454 Free PMC article. Review.
Cited by
-
A mathematical model for strigolactone biosynthesis in plants.Front Plant Sci. 2022 Sep 2;13:979162. doi: 10.3389/fpls.2022.979162. eCollection 2022. Front Plant Sci. 2022. PMID: 36119618 Free PMC article.
-
Minimum uncertainty as Bayesian network model selection principle.BMC Bioinformatics. 2025 Apr 8;26(1):100. doi: 10.1186/s12859-025-06104-5. BMC Bioinformatics. 2025. PMID: 40200184 Free PMC article.
References
-
- Subramanian A., Tamayo P., Mootha V.K., Mukherjee S., Ebert B.L., Gillette M.A., Paulovich A., Pomeroy S.L., Golub T.R., Lander E.S., et al. Gene set enrichment analysis: A knowledge-based approach for interpreting genome-wide expression profiles. Proc. Natl. Acad. Sci. USA. 2005;102:15545–15550. doi: 10.1073/pnas.0506580102. - DOI - PMC - PubMed
MeSH terms
LinkOut - more resources
Full Text Sources
Medical
