. 2022 Jul 7;12(7):954.
doi: 10.3390/biom12070954.

Cell Confluence Modulates TRPV4 Channel Activity in Response to Hypoxia

Affiliations

Cell Confluence Modulates TRPV4 Channel Activity in Response to Hypoxia

Solène Barbeau et al. Biomolecules. .

Abstract

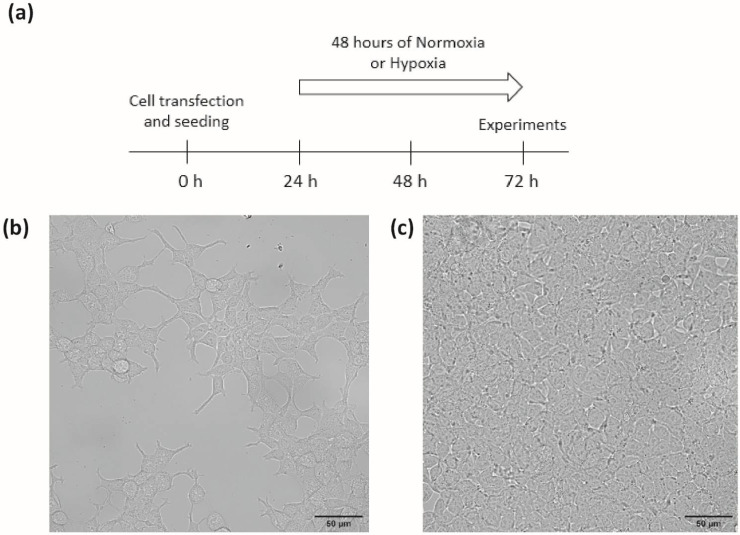
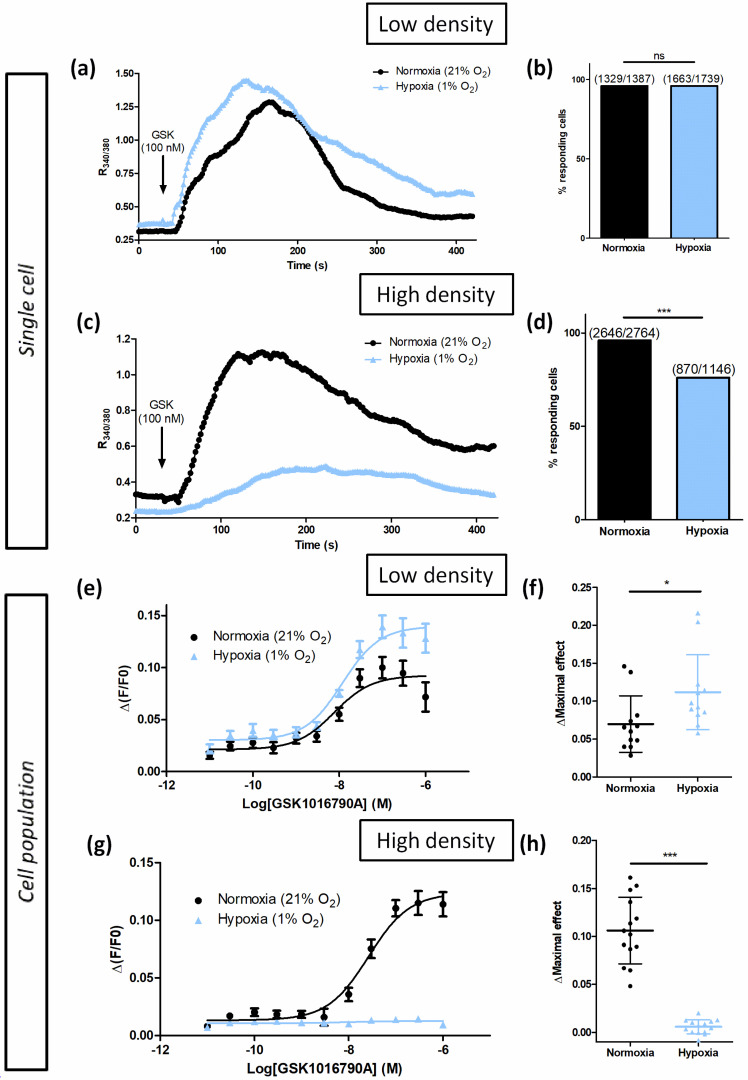
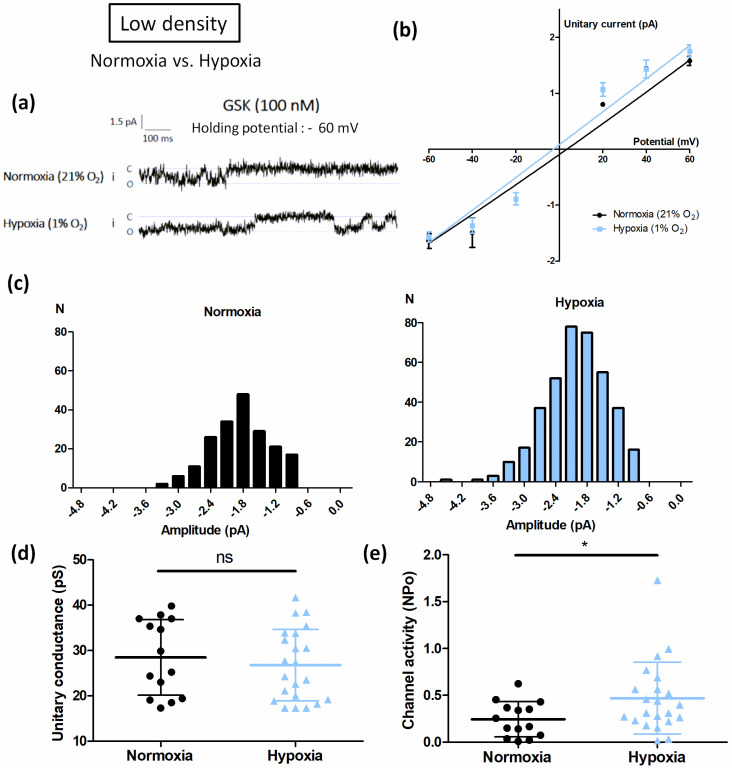
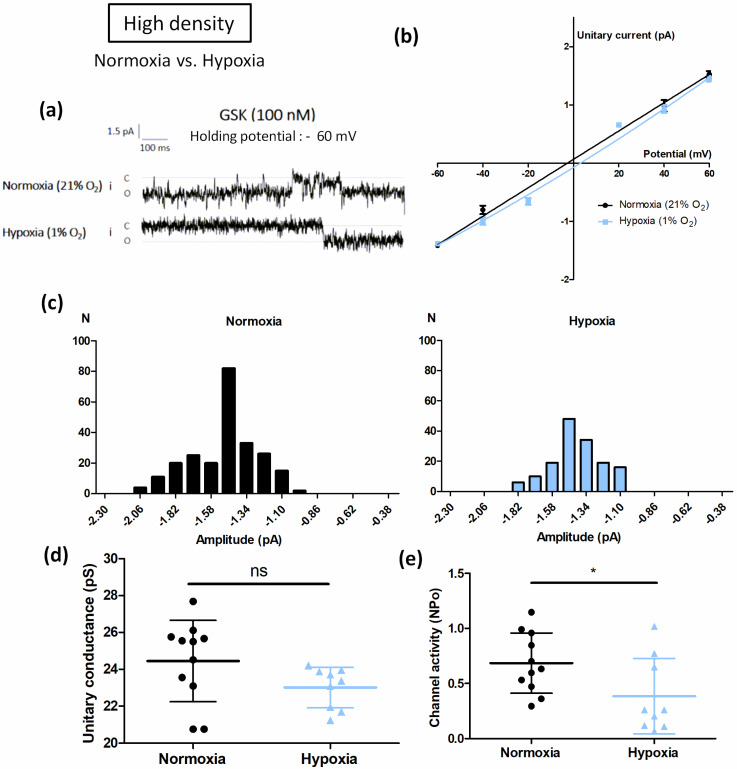
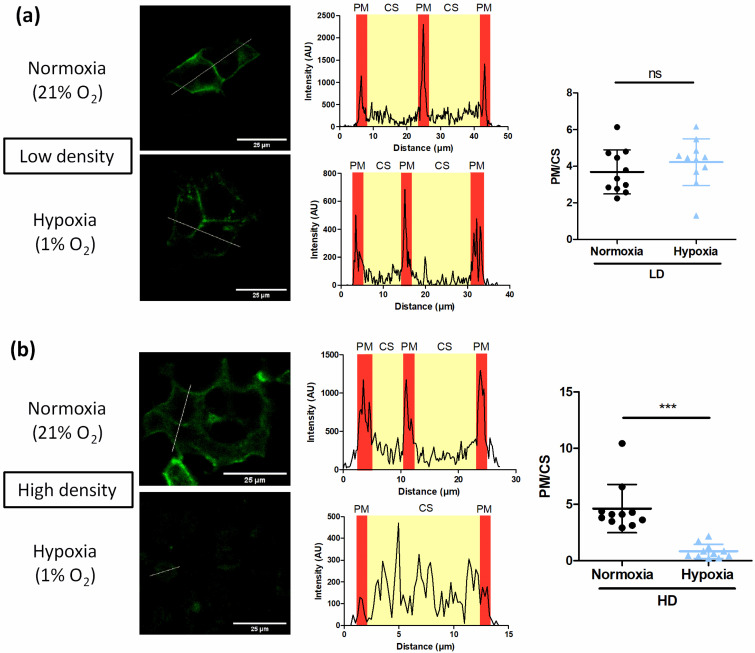
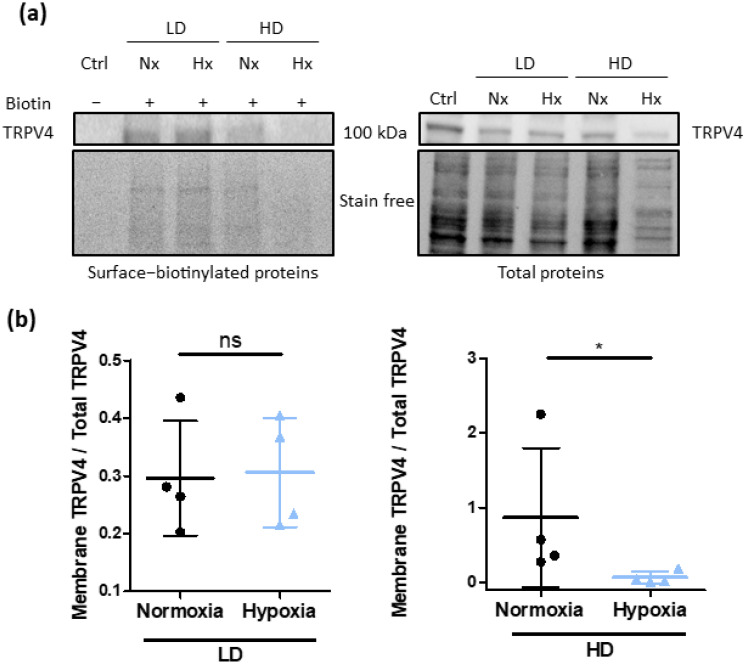
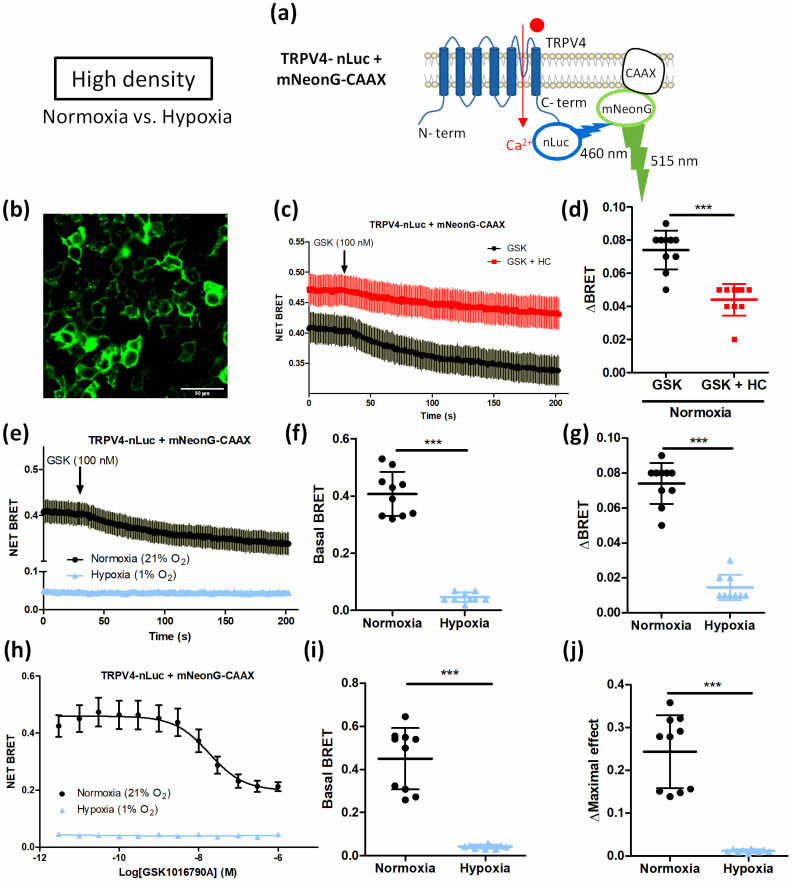
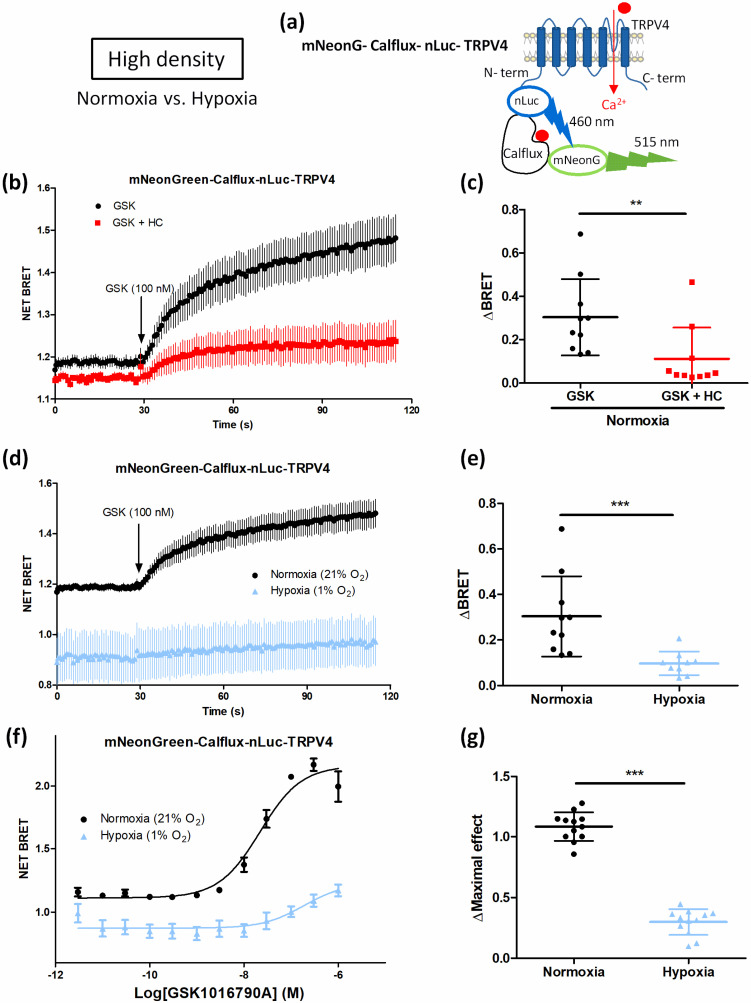
Transient receptor potential vanilloid 4 (TRPV4) is a polymodal Ca2+-permeable channel involved in various hypoxia-sensitive pathophysiological phenomena. Different tools are available to study channel activity, requiring cells to be cultured at specific optimal densities. In the present study, we examined if cell density may influence the effect of hypoxia on TRPV4 activity. Transiently TRPV4-transfected HEK293T cells were seeded at low or high densities corresponding to non-confluent or confluent cells, respectively, on the day of experiments, and cultured under in vitro normoxia or hypoxia. TRPV4-mediated cytosolic Ca2+ responses, single-channel currents, and Ca2+ influx through the channel were measured using Ca2+ imaging/microspectrofluorimetric assay, patch-clamp, and Bioluminescence Resonance Energy Transfer (BRET), respectively. TRPV4 plasma membrane translocation was studied using confocal microscopy, biotinylation of cell surface proteins, and BRET. Our results show that hypoxia exposure has a differential effect on TRPV4 activation depending on cell confluence. At low confluence levels, TRPV4 response is increased in hypoxia, whereas at high confluence levels, TRPV4 response is strongly inhibited, due to channel internalization. Thus, cell density appears to be a crucial parameter for TRPV4 channel activity.

Keywords: BRET; TRP channel; calcium; cell culture conditions; cell density; patch-clamp; stretch-activated channel.


Conflict of interest statement

The authors declare no conflict of interest.

Figures

Figure 1
Figure 1
Cell culture conditions (a) timeline protocol for cell experiments, (b,c) representative phase-contrast fields of HEK293T cells seeded at (b) low (1 × 10⁴ cells/cm2) or (c) high (3 × 10⁵ cells/cm2) densities after 72 h of culture. Scale bar = 50 µm (magnification 40×).
Figure 2
Figure 2
Characterization of TRPV4 Ca2+ response in transiently TRPV4-transfected HEK293T (HEK-TRPV4) cells cultured under normoxia at low density (1 × 10⁴ cells/cm2). (a) Schematic representation of TRPV4-WT. (b,c) Variations of relative cytosolic Ca2+ concentration (Ratio R340/380) were monitored by single-cell fluorescence videomicroscopy in Fura-2-LR/AM loaded cells. HEK-TRPV4 were bathed in physiological saline solution in absence or presence of the specific TRPV4 inhibitor HC067047 (HC, 1 μM). (b) Typical recordings of single cells when GSK1016790A (GSK, 100 nM), a selective TRPV4 agonist, was added at 30 s (as indicated by the arrow), and (c) percentage of responding cells in response to GSK. (d,e) Variations in relative cytosolic Ca2+ concentration (F/F0) were monitored using a microplate spectrophotometer reader in Fluo-4/AM loaded cells. (d) Δ(F/F0) concentration–response curves to GSK1016790A in presence or absence of HC067047 (1 µM) and (e) maximal concentration–response curve amplitude (ΔMaximal effect). Data are expressed as mean value ± SD. The number of cells (c) is indicated in brackets. Significant difference is indicated by two asterisks when p < 0.01 and three asterisks when p < 0.001, Mann–Whitney or chi-squared test.
Figure 3
Figure 3
Hypoxia only potentiates TRPV4-induced Ca2+ responses in transiently TRPV4-transfected HEK293T (HEK-TRPV4) cells cultured at low density (1 × 10⁴ cells/cm2). (ad) Variations of relative cytosolic Ca2+ concentration (Ratio R340/380) were monitored by single-cell fluorescence videomicroscopy in Fura-2-LR/AM loaded cells grown under normoxia (21% O2) or hypoxia (1% O2) for 48 h. (a) Typical recordings of single cells when HEK-TRPV4 were bathed in physiological saline solution and GSK1016790A (GSK, 100 nM), a selective TRPV4 agonist, was added at 30 s (as indicated by the arrow), and (b) percentage of responding cells in response to GSK at low density. (c) Typical recordings of single cells when HEK-TRPV4 were bathed in physiological saline solution and GSK1016790A (GSK, 100 nM), a selective TRPV4 agonist, was added at 30 s (as indicated by the arrow), and (d) percentage of responding cells in response to GSK at high density. (eh) Variations of relative cytosolic Ca2+ concentration (F/F0) were monitored using a microplate spectrophotometer reader in Fluo-4/AM loaded cells grown in normoxia (21% O2) or hypoxia (1% O2) for 48 h. Δ(F/F0) concentration–response curves to GSK1016790A at (e) low and (g) high densities, and maximal concentration–response curve amplitude (ΔMaximal effect) at (f) low and (h) high densities. Data are expressed as mean value ± SD. The number of cells (bd) is indicated in brackets. Significant difference is indicated by one asterisk when p < 0.05, three asterisks when p < 0.001, and ns indicates a non-significant difference, Mann–Whitney or chi-squared test.
Figure 4
Figure 4
Hypoxia potentiates TRPV4 currents in transiently TRPV4-transfected HEK293T (HEK-TRPV4) cells cultured at low density (1 × 10⁴ cells/cm2). (a) Representative records of current traces (patch clamp; cell-attached configuration at −60 mV holding potential, assuming a resting potential of 0 mV) recorded in HEK-TRPV4 cells cultured under normoxia (21% O2) or hypoxia (1% O2) for 48h at low cell confluence (1 × 10⁴ cells/cm2). The letters c and o indicate the closed and open channel states, respectively. (b) Unitary current (i)/potential (V) curves, (c) corresponding amplitude histograms shown at −60 mV, (d) unitary conductance, and (e) channel activity (NPo), determined at a holding potential of −60 mV in presence of the TRPV4 agonist GSK1016790A (100 nM). Data are expressed as mean value ± SD. Significant difference is indicated by one asterisk when p < 0.05, and ns indicates a non-significant difference, Mann–Whitney test.
Figure 5
Figure 5
Cell confluence alters hypoxia-induced TRPV4 current potentiation in transiently TRPV4-transfected HEK293T (HEK-TRPV4) cells. (a) Representative records of current traces (patch clamp; cell-attached configuration at −60 mV holding potential, assuming a resting potential of 0 mV) recorded in HEK-TRPV4 cells cultured under normoxia (21% O2) or hypoxia (1% O2) for 48 h at high cell confluence (3 × 10⁵ cells/cm2). The letters c and o indicate the closed and open channel states, respectively. (b) Unitary current (i)/potential (V) curves, (c) corresponding amplitude histograms shown at −60 mV, (d) unitary conductance, and (e) channel activity (NPo), determined at a holding potential of −60 mV in presence of the TRPV4 agonist GSK1016790A (100 nM). Data are expressed as mean value ± SD. Significant difference is indicated by one asterisk when p < 0.05 and ns indicates a non-significant difference, Mann–Whitney test.
Figure 6
Figure 6
Cell confluence reduces plasma membrane density of TRPV4 channels in TRPV4-transfected HEK293T cells under hypoxia. Representative confocal fields of living HEK293T cells transfected with TRPV4 tagged with YFP and cultured at (a) low (1 × 10⁴ cells/cm2) and (b) high density (3 × 10⁵ cells/cm2) under normoxia (21% O2) or hypoxia (1% O2) for 48 h (scale bar = 25 µm); and corresponding evaluation of TRPV4 membrane localization by the fluorescence intensity profile in arbitrary units (AU) of a typical line scan indicated by the dotted line in cell. The average ratios (PM/CS) of the fluorescence signals of the plasma membrane (PM) to the fluorescence signals of the cytosol (CS) of representative cells are indicated as mean value ± SD. Significant difference is indicated by three asterisks when p < 0.001 and ns indicates a non-significant difference, Mann–Whitney test.
Figure 7
Figure 7
Cell confluence reduces plasma membrane expression of TRPV4 channels in TRPV4-transfected HEK293T cells under hypoxia. (a) Representative Western blots showing the presence of TRPV4 surface-biotinylated and total proteins from HEK293T cells transfected with TRPV4 WT and cultured at low (1 × 10⁴ cells/cm2) and high density (3 × 10⁵ cells/cm2) under normoxia (21% O2) or hypoxia (1% O2) for 48 h. Samples without biotin were used as negative control. (b) Membrane TRPV4/Total TRPV4 ratio was evaluated for each condition with stain free normalization. Data are expressed as mean value ± SD. Significant difference is indicated by one asterisk when p < 0.05 and ns indicates a non-significant difference, Mann–Whitney test.
Figure 8
Figure 8
Hypoxia impairs agonist-induced TRPV4 internalization in transiently TRPV4-transfected HEK293T cells cultured at high density. (a) Schematic representation of TRPV4-nLuc and mNeonG-CAAX. (b) Representative confocal fields of mNeonG-CAAX transfected HEK293T cells (scale bar = 50 µm). (c) Kinetic BRET measurement of the effect of GSK1016790A (100 nM) on cells transfected with mNeonG-CAAX and TRPV4-nLuc BRET probes in presence or absence of HC067047 (1 µM) and cultured at high cell confluence (3 × 10⁵ cells/cm2) under normoxia, and (d) maximal absolute amplitude (ΔBRET). (e) Kinetic BRET measurement of the effect of GSK1016790A (100 nM) on HEK293T cells transfected with mNeonG-CAAX and TRPV4-nLuc BRET probes and cultured under normoxia (21% O2) or hypoxia (1% O2) for 48 h, (f) basal BRET, and (g) maximal absolute amplitude (ΔBRET). (h) Concentration–response curves of the effect of GSK1016790A on HEK293T cells transfected with mNeonG-CAAX and TRPV4-nLuc BRET probes and cultured under normoxia or hypoxia, (i) basal BRET, and (j) maximal concentration–response curve amplitude (ΔMaximal effect). Data are expressed as mean value ± SD. Significant difference is indicated by three asterisks when p < 0.001, Mann–Whitney.
Figure 9
Figure 9
Cell confluence alters Ca2+ influx through TRPV4 in transiently mNeonG-Calflux-nLuc-TRPV4-transfected HEK293T cells cultured under hypoxia (1% O2) for 48 h at high cell confluence (3 × 10⁵ cells/cm2). (a) Schematic representation of mNeonG-Calflux-nLuc-TRPV4. (b) Kinetic BRET measurement of the effect of GSK1016790A (100 nM, applied as indicated by the arrow) on cells transfected with mNeonG-Calflux-nLuc-TRPV4 in presence or absence of HC067047 (1 µM) and cultured at high cell confluence (3 × 10⁵ cells/cm2) under normoxia (21% O2), and (c) maximal amplitude (ΔBRET). (d) Kinetic BRET measurement of the effect of GSK1016790A (100 nM) on cells transfected with mNeonG-Calflux-nLuc-TRPV4 cultured at high cell confluence under normoxia or hypoxia (1% O2) for 48 h, and (e) maximal amplitude (ΔBRET). (f) Concentration–response curves of the effect of GSK1016790A on HEK293T cells transfected with mNeonG-Calflux-nLuc-TRPV4 BRET probe and cultured under normoxia or hypoxia at HD, and (g) maximal concentration–response curve amplitude (ΔMaximal effect). Data are expressed as mean value ± SD. The number of independent experiments is indicated in brackets. Significant difference is indicated by two asterisks when p < 0.01 and three asterisks when p < 0.001, Mann–Whitney test.

References

    1. White J.P., Cibelli M., Urban L., Nilius B., McGeown J.G., Nagy I. Trpv4: Molecular Conductor of a Diverse Orchestra. Physiol. Rev. 2016;96:911–973. doi: 10.1152/physrev.00016.2015. - DOI - PubMed
    1. Voets T., Prenen J., Vriens J., Watanabe H., Janssens A., Wissenbach U., Bodding M., Droogmans G., Nilius B. Molecular Determinants of Permeation through the Cation Channel Trpv4. J. Biol. Chem. 2002;277:33704–33710. doi: 10.1074/jbc.M204828200. - DOI - PubMed
    1. Rosenbaum T., Benitez-Angeles M., Sanchez-Hernandez R., Morales-Lazaro S.L., Hiriart M., Morales-Buenrostro L.E., Torres-Quiroz F. Trpv4: A Physio and Pathophysiologically Significant Ion Channel. Int. J. Mol. Sci. 2020;21:3837. doi: 10.3390/ijms21113837. - DOI - PMC - PubMed
    1. Toft-Bertelsen T.L., MacAulay N. Trping to the Point of Clarity: Understanding the Function of the Complex Trpv4 Ion Channel. Cells. 2021;10:165. doi: 10.3390/cells10010165. - DOI - PMC - PubMed
    1. Fan H.C., Zhang X., McNaughton P.A. Activation of the Trpv4 Ion Channel Is Enhanced by Phosphorylation. J. Biol. Chem. 2009;284:27884–27891. doi: 10.1074/jbc.M109.028803. - DOI - PMC - PubMed

Publication types

LinkOut - more resources