Observational Study
. 2022 Jul 15;12(7):989.
doi: 10.3390/biom12070989.

Concurrent Change in Serum Cholinesterase Activity and Midregional-Proadrennomedullin Level Could Predict Patient Outcome following Liver Transplantation

Affiliations
Observational Study

Concurrent Change in Serum Cholinesterase Activity and Midregional-Proadrennomedullin Level Could Predict Patient Outcome following Liver Transplantation

Sebastian O Decker et al. Biomolecules. .

Abstract

Background: After liver transplantation (LTX), patients are susceptible to opportunistic infections resulting in reduced outcomes within the early post-transplantation period. The postoperative monitoring of LTX patients has gained much importance in recent years. However, reliable plasmatic markers predicting 90-day outcomes are still lacking.

Methods: In the post hoc analysis of a prospective, observational study, butyrylcholinesterase (BChE), mid-regional proadrenomedullin (MR-proADM), as well as conventional inflammatory markers (procalcitonin, C-reactive protein) were evaluated in 93 patients at seven consecutive timepoints within the first 28 days following LTX.

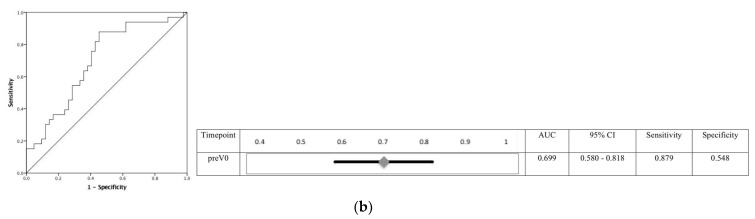
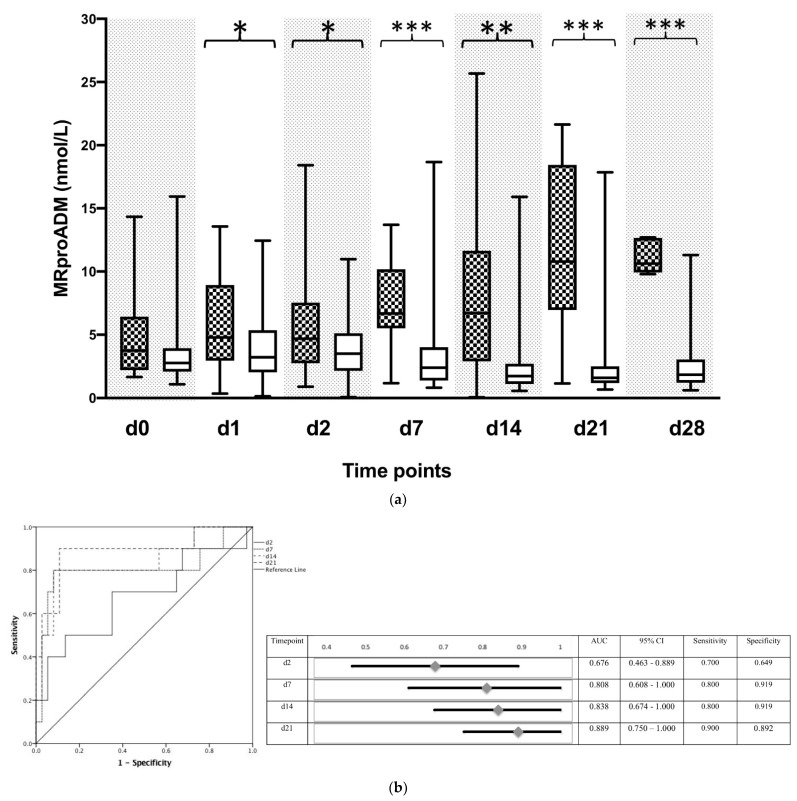
Results: Persistently reduced activity of BChE and elevated MR-proADM levels indicated reduced 90-day survival following LTX. Furthermore, reduced BChE and increased MR-proADM activity could indicate early post-transplantation bacterial infections, whereas conventional inflammatory biomarkers showed no diagnostic efficacy within the observation period.

Conclusion: Concurrent assessment of BChE and MR-proADM activity might serve as a bedside diagnostic tool for early bacterial infections following liver transplantation. Thus, a combined utilization of the two biomarkers may be a useful tool in the risk evaluation of patients following liver transplantation.

Keywords: liver transplantation; mid-regional proadrenomedullin; outcome; pseudocholinesterase.


Conflict of interest statement

The authors declare no conflict of interest.

Figures

Figure 1
Figure 1
Flowchart of included patients. Abbreviations: ESLD, end-stage liver disease; LTX, liver transplantation, BChE, butyrylcholinesterase; MR-proADM, mid-regional proadrenomedullin.
Figure 2
Figure 2
Plasma concentrations of butyrylcholinesterase (BChE) in patients following liver transplantation. (a) Plasmatic BChE activity was measured in patients following liver transplantation and grouped according to their 90-day survival. BChE activity is presented in kU/L for 90-day survivors (white box) and 90-day non-survivors (black squared box). Plasma samples were collected immediately following liver transplantation (d0), and on day 1 (d1), day 2 (d2), day 7 (d7), day 14 (d14), day 21 (d21), and day 28 (d28) afterwards. Data in the box plots are presented as the median, 25th percentile, and 75th percentile, with the 10th as well as 90th percentile at the end of the whiskers. Concerning symbolism and higher orders of significance: p < 0.05: *, p < 0.01: **, Mann–Whitney U Test. (b) Plasmatic BChE activity represents normalized values to the initial value at day 0. Values are shown in percentages. (c) Receiver operating characteristic (ROC) analysis with BChE in all participating patients on day 14 (d14), as well as day 21 (d21) and day 28 (d28), respectively, with regard to the prediction of 90-day survival. Patients who died within 90 days after liver transplantation represented the target group, whereas surviving patients served as controls for this ROC analysis. (d) A comparison of Kaplan–Meier curves stratified according to the cut-off-value (c.o.v.) calculated in (b) for the timepoint d14.
Figure 2
Figure 2
Plasma concentrations of butyrylcholinesterase (BChE) in patients following liver transplantation. (a) Plasmatic BChE activity was measured in patients following liver transplantation and grouped according to their 90-day survival. BChE activity is presented in kU/L for 90-day survivors (white box) and 90-day non-survivors (black squared box). Plasma samples were collected immediately following liver transplantation (d0), and on day 1 (d1), day 2 (d2), day 7 (d7), day 14 (d14), day 21 (d21), and day 28 (d28) afterwards. Data in the box plots are presented as the median, 25th percentile, and 75th percentile, with the 10th as well as 90th percentile at the end of the whiskers. Concerning symbolism and higher orders of significance: p < 0.05: *, p < 0.01: **, Mann–Whitney U Test. (b) Plasmatic BChE activity represents normalized values to the initial value at day 0. Values are shown in percentages. (c) Receiver operating characteristic (ROC) analysis with BChE in all participating patients on day 14 (d14), as well as day 21 (d21) and day 28 (d28), respectively, with regard to the prediction of 90-day survival. Patients who died within 90 days after liver transplantation represented the target group, whereas surviving patients served as controls for this ROC analysis. (d) A comparison of Kaplan–Meier curves stratified according to the cut-off-value (c.o.v.) calculated in (b) for the timepoint d14.
Figure 3
Figure 3
Plasma concentrations of butyrylcholinesterase (BChE) in patients following liver transplantation adjusted to the timepoint of bacterial infection. (a) Plasmatic BChE activity was measured in patients following liver transplantation. Measurements in patients with bacterial infection were adjusted to the timepoint of appearance (black squared box) and then compared to non-infected patients (white box). In patients with a bacterial infection, new timepoints were assigned by matching them to the first time of bacterial infection, whereas the control group without bacterial infection was assigned by matching them in an age- and sex-related manner to the same timepoints as patients with a bacterial infection. The following virtual timepoints were created: the first measurement before the first bacterial infection (preV0), the plasma level at the time of bacterial infection (V0) and the next measured plasma level (V1). BChE activity is presented in kU/L. Data in box plots are given as median, 25th percentile, and 75th percentile, with the 10th and 90th percentile at the end of the whiskers. Concerning symbolism and higher orders of significance: p < 0.01: **, Mann–Whitney U Test. (b) Receiver operator characteristics (ROC)-analysis for BChE in bacterial infected vs. uninfected patients regarding the virtual timepoint V0 that is described above. Abbreviations: AUC, area under the curve; CI, confidence interval.
Figure 3
Figure 3
Plasma concentrations of butyrylcholinesterase (BChE) in patients following liver transplantation adjusted to the timepoint of bacterial infection. (a) Plasmatic BChE activity was measured in patients following liver transplantation. Measurements in patients with bacterial infection were adjusted to the timepoint of appearance (black squared box) and then compared to non-infected patients (white box). In patients with a bacterial infection, new timepoints were assigned by matching them to the first time of bacterial infection, whereas the control group without bacterial infection was assigned by matching them in an age- and sex-related manner to the same timepoints as patients with a bacterial infection. The following virtual timepoints were created: the first measurement before the first bacterial infection (preV0), the plasma level at the time of bacterial infection (V0) and the next measured plasma level (V1). BChE activity is presented in kU/L. Data in box plots are given as median, 25th percentile, and 75th percentile, with the 10th and 90th percentile at the end of the whiskers. Concerning symbolism and higher orders of significance: p < 0.01: **, Mann–Whitney U Test. (b) Receiver operator characteristics (ROC)-analysis for BChE in bacterial infected vs. uninfected patients regarding the virtual timepoint V0 that is described above. Abbreviations: AUC, area under the curve; CI, confidence interval.
Figure 4
Figure 4
Plasma concentrations of mid-regional proadrenomedullin (MR-proADM) in patients following liver transplantation. (a) Plasma concentrations of MR-proADM were measured in patients following liver transplantation and divided according to their 90 d survival. MR-proADM is presented in nmol/L for 90-day survivors (white box) and 90-day non-survivors (black squared box). Plasma samples were collected immediately following liver transplantation (d0), and on day 1 (d1), day 2 (d2), day 7 (d7), day 14 (d14), day 21 (d21), and day 28 (d28) afterwards. Data in box plots are given as median, 25th percentile, and 75th percentile, with the 10th and 90th percentile at the end of the whiskers. Concerning symbolism and higher orders of significance: p < 0.05: *, p < 0.01: **, p < 0.001: ***. Mann–Whitney U Test. (b) Receiver operating characteristic (ROC) analysis with MR-proADM in all participating patients at day 2 (d2), as well as day 7 (d7), day 14, and day 21 (d21) afterwards with regard to the prediction of 90-day survival. Patients who died within 90 days after liver transplantation represented the target group, whereas surviving patients served as controls for this ROC analysis.
Figure 5
Figure 5
Plasma concentrations of mid-regional proadrenomedullin (MR-proADM) in patients following liver transplantation adjusted to the time of bacterial infection. (a) Plasma concentrations of MR-proADM were measured in patients following liver transplantation. Measurements in patients with bacterial infection were adjusted to the time of appearance (black squared box) and then compared to non-infected patients (white box). In patients with a bacterial infection, new timepoints were created by matching them to the first occurrence of bacterial infection, whereas the control group without bacterial infection was built by matching them in an age- and sex-related manner to the same timepoints as those for patients with bacterial infection. The following virtual timepoints were created: the first measurement before the first bacterial infection (preV0), the plasma level at the time of bacterial infection (V0) and the subsequent measured plasma level (V1). MR-proADM is presented in nmol/L. Data in box plots are given as the median, 25th percentile, and 75th percentile, with the 10th and 90th percentile at the end of the whiskers. Concerning symbolism and higher orders of significance: p < 0.05: *, p < 0.01: **, p < 0.001: ***. Mann–Whitney U Test. (b) Receiver operator characteristics (ROC)-analysis for MR-proADM in bacterial infected vs. uninfected patients regarding the virtual timepoint V0, described above. Abbreviations: AUC, area under the curve; CI, confidence interval.

References

    1. Trunecka P. Immunosuppression after liver transplant, now and in future. Vnitr. Lek. 2013;59:671–677. - PubMed
    1. Astarcioglu I., Egeli T., Gulcu A., Ozbilgin M., Agalar C., Cesmeli E.B., Kaya E., Karademir S., Unek T. Vascular complications after liver transplantation. Exp. Clin. Transplant. 2019;10:1–8. doi: 10.6002/ect.2018.0240. - DOI - PubMed
    1. Winston D.J., Emmanouilides C., Busuttil R.W. Infections in liver transplant recipients. Clin. Infect. Dis. 1995;21:1077–1089. doi: 10.1093/clinids/21.5.1077. - DOI - PubMed
    1. Zeair S., Stasiuk R., Zair L., Wawrzynowicz-Syczewska M., Rybicka A., Grochans E., Kazimierczak A. Incidents and risk factors of biliary complications after orthotropic liver transplantation. Medicine. 2021;100:e26994. doi: 10.1097/MD.0000000000026994. - DOI - PMC - PubMed
    1. Fishman J.A. Infection in solid-organ transplant recipients. N. Engl. J. Med. 2007;357:2601–2614. doi: 10.1056/NEJMra064928. - DOI - PubMed

Publication types

Associated data