. 2022 Jul 19;12(7):1003.
doi: 10.3390/biom12071003.

Kallikrein-Related Peptidase 6 (KLK6) as a Contributor toward an Aggressive Cancer Cell Phenotype: A Potential Role in Colon Cancer Peritoneal Metastasis

Affiliations

Kallikrein-Related Peptidase 6 (KLK6) as a Contributor toward an Aggressive Cancer Cell Phenotype: A Potential Role in Colon Cancer Peritoneal Metastasis

Hayet Bouzid et al. Biomolecules. .

Abstract

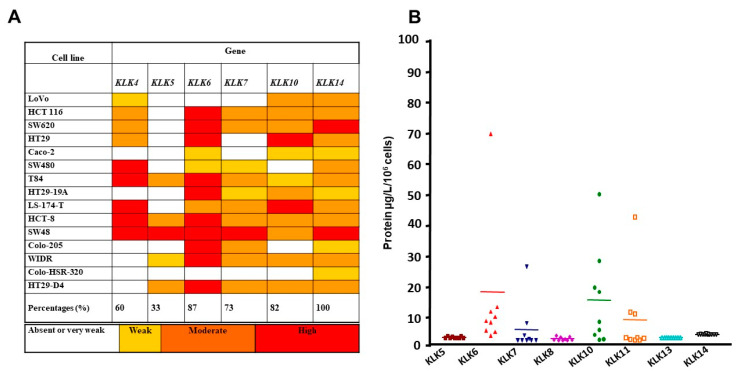
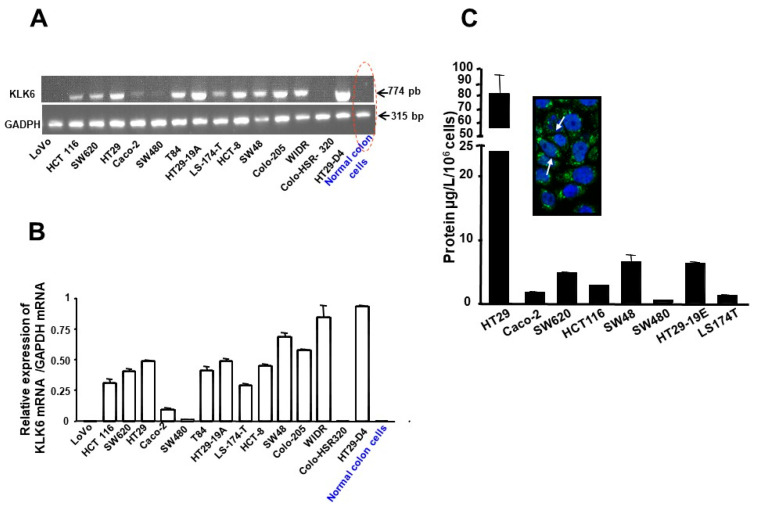
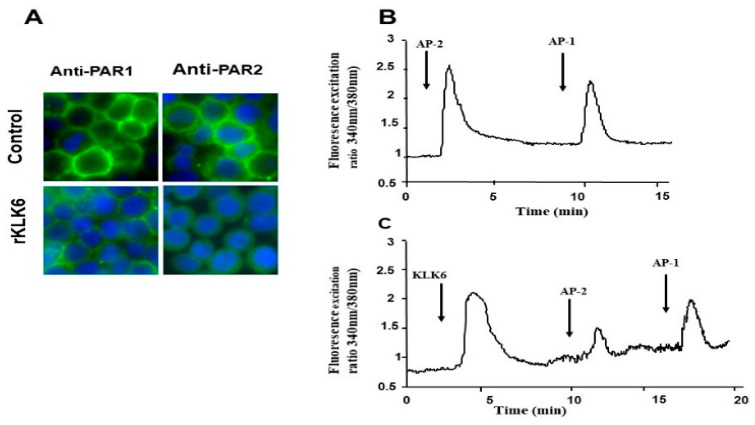
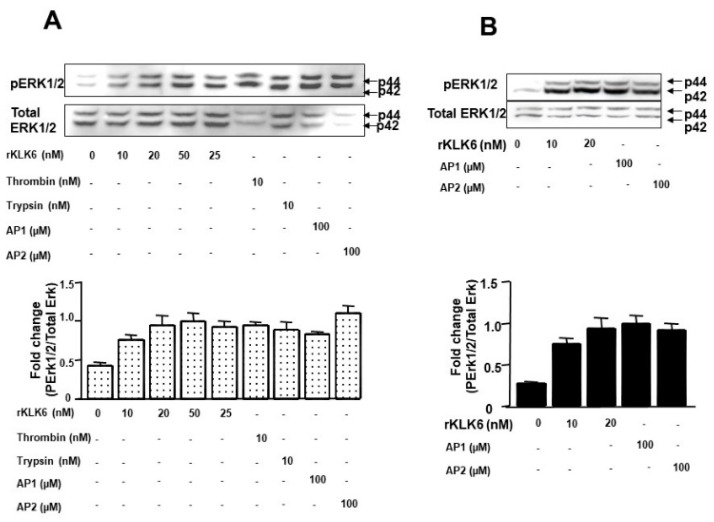
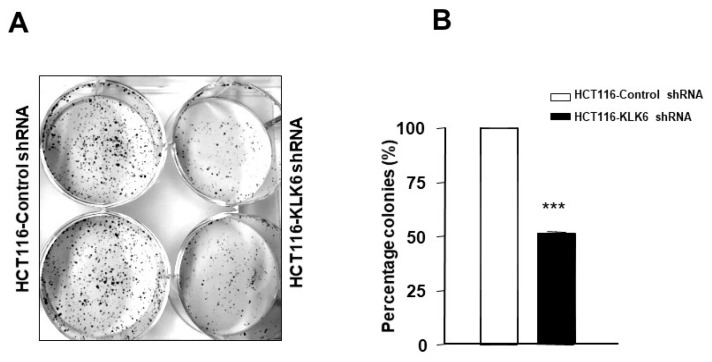
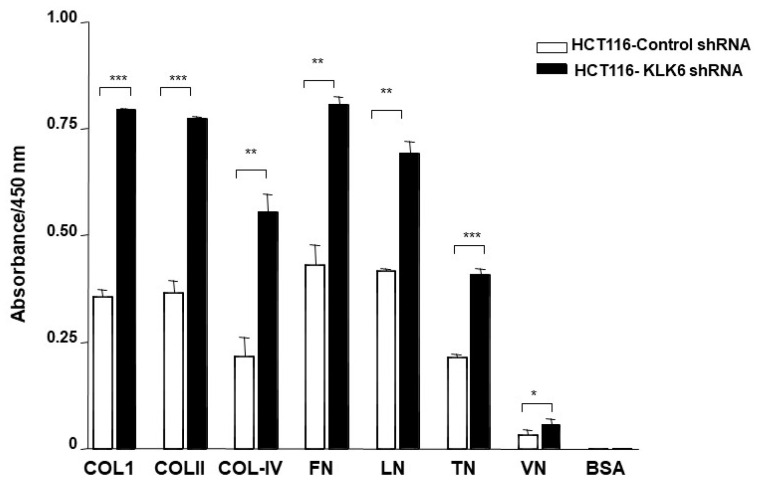
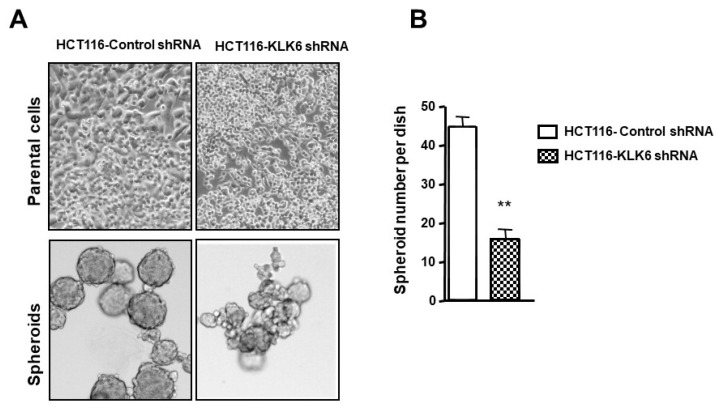
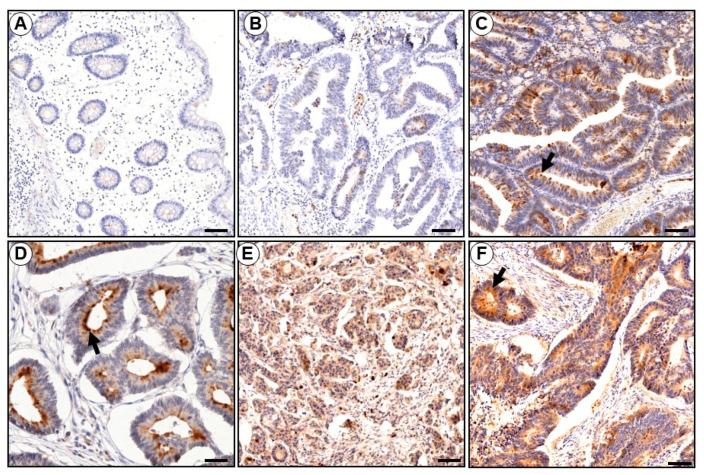
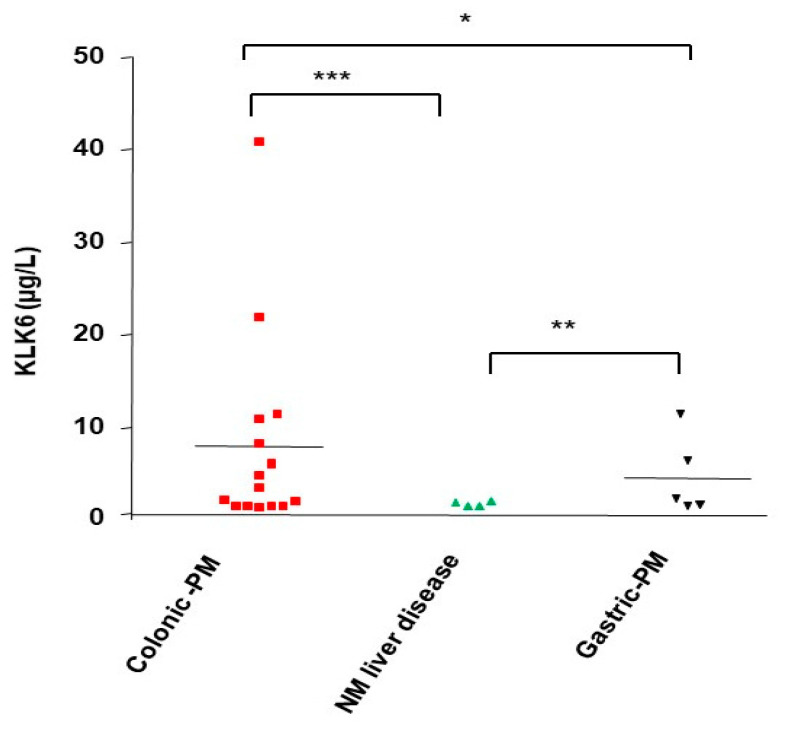
Kallikrein-related peptidases (KLKs) are implicated in many cancer-related processes. KLK6, one of the 15 KLK family members, is a promising biomarker for diagnosis of many cancers and has been associated with poor prognosis of colorectal cancer (CRC) patients. Herein, we evaluated the expression and cellular functions of KLK6 in colon cancer-derived cell lines and in clinical samples from CRC patients. We showed that, although many KLKs transcripts are upregulated in colon cancer-derived cell lines, KLK6, KLK10, and KLK11 are the most highly secreted proteins. KLK6 induced calcium flux in HT29 cells by activation and internalization of protease-activated receptor 2 (PAR2). Furthermore, KLK6 induced extracellular signal-regulated kinases 1 and 2 (ERK1/2) phosphorylation. KLK6 suppression in HCT-116 colon cancer cells decreased the colony formation, increased cell adhesion to extracellular matrix proteins, and reduced spheroid formation and compaction. Immunohistochemistry (IHC) analysis demonstrated ectopic expression of KLK6 in human colon adenocarcinomas but not in normal epithelia. Importantly, high levels of KLK6 protein were detected in the ascites of CRC patients with peritoneal metastasis, but not in benign ascites. These data indicate that KLK6 overexpression is associated with aggressive CRC, and may be applied to differentiate between benign and malignant ascites.

Keywords: colorectal cancer; extracellular matrix; kallikrein-related peptidase 6; metastasis; protease-activated receptors; signaling.


Conflict of interest statement

The authors declare no conflict of interest.

Figures

Figure 1
Figure 1
Analysis of the mRNA and protein expression pattern of KLK4, 5, 6, 7, and 14 in different colon cancer cell lines. (A) Analysis of KLK mRNA expression levels in the indicated human colon cancer cell lines by semiquantitative RT-PCR. (B) Secretion of KLK 4, 5, 6, 7, 8, 10, 13, and 14 in conditioned medium from nine colon cancer cell lines was assessed by ELISA and is presented in a scatter plot. The protein levels are shown as the mean concentration of KLKs (µg/L) secreted by 106 cells per 24 h. Median values are marked with a horizontal line.
Figure 2
Figure 2
Expression of KLK6 in human colon cancer cell lines. (A) Two micrograms of total RNA were reverse transcribed and PCR-amplified with KLK6 or GAPDH primers as described in Material and Methods. A major single PCR-amplified product of the predicted size (774 bp) for KLK6 was visualized after electrophoresis on a 2% agarose gel. GADPH was used as an internal control. Normal isolated epithelial cells do not express KLK 6 mRNA. Note that KLK 6 is present in SW620, a cell line from a lymph node of a primary adenocarcinoma from which SW480 was derived. (B) The amount of mRNA expression was quantified by densitometry of bands in comparison to the glyceraldehyde-3-phosphate dehydrogenase (GAPDH). Densitometry of mRNA bands were quantified from three independent PCR experiments presented as mean ± SEM. (C) Immunodetection of kallikrein-related peptidases 6 by colon cancer cell lines: Supernatants were collected from colon cancer cells in culture and KLK6 expression was estimated by sandwich-type ELISA (see Material and Methods). Protein values represent the mean concentration of KLK6 (µg/L) secreted by 106 cells, which were cultured for 24 h. Inset: shows confocal microscopic immunocytochemical localization of KLK6 in HT-29 cells (Magnification X630). Arrows show cytoplasmic, perinuclear staining of KLK6.
Figure 3
Figure 3
KLK6 induces loss of PAR1 and PAR2 from the surface of HT-29 cells and initiates calcium signaling via PAR2. (A) Immunofluorescence detection of PAR1 and PAR2 in HT-29 cells pre-treated with KLK6 (20 nmol/L), or with vehicle (control) for 15 min at 37 °C. Cells were fixed using 2% paraformaldehyde and immunostained with a PAR2 monoclonal antibody or PAR1 monoclonal antibody. Results are representative of two independent experiments (Magnification ×630). (B,C) KLK6 initiates intracellular Ca2+ mobilization. HT-29 cells were loaded for 60 min at 37 °C using Fura 2/AM. (B) HT-29 cells were challenged first with AP2 (SLIGKV-NH2, 100 µmol/L)) and AP1 (TFFLLR-NH2, 100 µmol/L). (C) Cells were first challenged with KLK6 (1 µmol/L) followed by a second challenge with activating peptide AP2 (100 µmol/L) and subsequent challenge with AP1 (100 µmol/L). Note the AP2 response showed a reduction in response, whereas cells were still responsive to AP1. Administration of compounds is indicated with the corresponding arrows.
Figure 4
Figure 4
Dose-dependent activation of p42/p44 MAP-Kinase phosphorylation by KLK6. (A) Quiescent HT-29 cells were stimulated with the indicated concentrations of KLK6, thrombin (0.01 µmol/L), trypsin (0.01 µmol/L), with 100 µM of TFLLR-NH2 (AP1, a PAR1 agonist), 100 µM SLIGKV-NH2 (AP2, a PAR2 agonist) or with vehicle (control) for 5 min. (B) Quiescent HCT116 cells were stimulated with the indicated concentrations of KLK6, with 100 µM of TFLLR-NH2 (AP1, a PAR1 agonist), with 100 µM SLIGKV-NH2 (AP2, a PAR2 agonist) or with vehicle (control) for 5 min. To confirm equal protein loading, the membranes were stripped and incubated with p42/p44 MAP-Kinase antibody. p42/p44 MAPKinase protein seems to be reduced in PARs agonist-stimulated samples, possibly because the high signal with the anti-phopsho-ERK1/2 (Thr202/Tyr204) antibody prevents subsequent anti-ERK1/2 antibody binding to the ERK1/2 epitope as observed previously [9]. Densitometric analysis of the phospo-p42/p44 MAP-Kinase divided by total amount of p42/p44 MAP-Kinase is represented in lower panels. Results are representative of two separate experiments.
Figure 5
Figure 5
The effect of KLK6 knockdown on colony formation. (A) HCT116-control shRNA and HCT116-KLK6 shRNA were plated as described in Materials and Methods and incubated for 12 days. Silencing KLK6 induced a strong decrease in colon cancer colony formation. Representative images were captured and quantified using an Azure™ Imaging Systems. (B) Analysis of colony formation rates is shown as percentage of colonies from three independent experiments, each performed in duplicate. Data are shown as mean ± SEM. *** p < 0.001.
Figure 6
Figure 6
Effect of KLK6 knock down on cell adhesion. The adhesion assay was performed by seeding HCT116-KLK6-KO and HCT116-control cells (105 cells each) in 96-well plates coated with type I collagen (Col-I), type II collagen (Col-II), type IV collagen (Col-IV), fibronectin (FN), laminin (LN), tenascin (TN), or BSA as a negative control. Cells were incubated for 2 h. Non-adherent cells were washed three times with PBS, the attached cells were then stained using the ECM Cell Adhesion Array Kit and quantified by absorbance readings in a microplate reader at 570 nm. Means of three independent experiments are presented. Data are shown as mean ± SEM. * p < 0.05; ** p < 0.01; *** p < 0.001.
Figure 7
Figure 7
Effect of KLK6 silencing on colon cancer spheroid formation. Spheres were generated by growing cells at a clonal density of 1000 cells/mL in neural crest cells culture conditions as described in Material and Methods. Cells were dispensed in low-adherent plates and medium was changed twice a week. Spheres were allowed to grow over the course of 12 days. Spheres were counted and measured every 2–3 days under the microscope. (A) Upper panel: KLK6 silencing results in altered cell morphology. Lower panel: representative images of spheroids formed by HCT116-KLK6 shRNA and HCT116-control shRNA cells randomly taken at day 6 after subculture. (B) Spheroids number formed by HCT116-KLK6 shRNA and HCT116-control shRNA cells. Data are shown as mean ± SEM of three independent experiments each performed in duplicate. ** p < 0.01.
Figure 8
Figure 8
Representative immunostaining of the KLK6 in paraffin sections of colonic tissues from patients with adenocarcinoma. (A) KLK6 immunoreactivity is absent in ‘normal-appearing’ colonic mucosa very distant (more than 10 cm) from a colon adenocarcinoma (B) Immunostaining for KLK6 in the dysplastic colonic mucosa from the same patient as in (A) is seen. (CF) Moderate to strong positive immunoreactivity in the adenocarcinomas of four different patients. KLK6 immunoreactivity appeared to be distinguishable into a predominantly apical/cytoplasmic pattern (arrows). Bar = 100 µm (AF), 10 µm (D).
Figure 9
Figure 9
Immunodetection of KLK 6 in ascitic peritoneal metastasis from human colorectal cancer. Ascitic fluids were collected from peritoneal metastasis from human colorectal cancer (Colon-PM), (Gastric-PM) or from non-malignant liver diseases (NM Liver disease) and KLK6 expression was estimated by a sandwich-type ELISA (see Material and Methods). Protein values represent the mean concentration of KLK6 (µg/L). Data are shown as mean ± SEM. * p < 0.05; ** p < 0.01; *** p < 0.001.

References

    1. Lemoine L., Sugarbaker P., Van der Speeten K. Pathophysiology of colorectal peritoneal carcinomatosis: Role of the peritoneum. World J. Gastroenterol. 2016;22:7692–7707. doi: 10.3748/wjg.v22.i34.7692. - DOI - PMC - PubMed
    1. Pretzsch E., Bosch F., Neumann J., Ganschow P., Bazhin A., Guba M., Werner J., Angele M. Mechanisms of Metastasis in Colorectal Cancer and Metastatic Organotropism: Hematogenous versus Peritoneal Spread. J. Oncol. 2019;2019:7407190. doi: 10.1155/2019/7407190. - DOI - PMC - PubMed
    1. Sevenich L., Joyce J.A. Pericellular proteolysis in cancer. Genes Dev. 2014;28:2331–2347. doi: 10.1101/gad.250647.114. - DOI - PMC - PubMed
    1. Xie Y., Chen L., Lv X., Hou G., Wang Y., Jiang C., Zhu H., Xu N., Wu L., Lou X., et al. The levels of serine proteases in colon tissue interstitial fluid and serum serve as an indicator of colorectal cancer progression. Oncotarget. 2016;7:32592–32606. doi: 10.18632/oncotarget.8693. - DOI - PMC - PubMed
    1. Chandrabalan A., Ramachandran R. Molecular mechanisms regulating Proteinase-Activated Receptors (PARs) Febs J. 2021;288:2697–2726. doi: 10.1111/febs.15829. - DOI - PubMed

Publication types