. 2022 Jul 6;11(7):1330.
doi: 10.3390/antiox11071330.

Antioxidant and Anti-Inflammatory Effects of Thyme (Thymus vulgaris L.) Essential Oils Prepared at Different Plant Phenophases on Pseudomonas aeruginosa LPS-Activated THP-1 Macrophages

Affiliations

Antioxidant and Anti-Inflammatory Effects of Thyme (Thymus vulgaris L.) Essential Oils Prepared at Different Plant Phenophases on Pseudomonas aeruginosa LPS-Activated THP-1 Macrophages

Edina Pandur et al. Antioxidants (Basel). .

Abstract

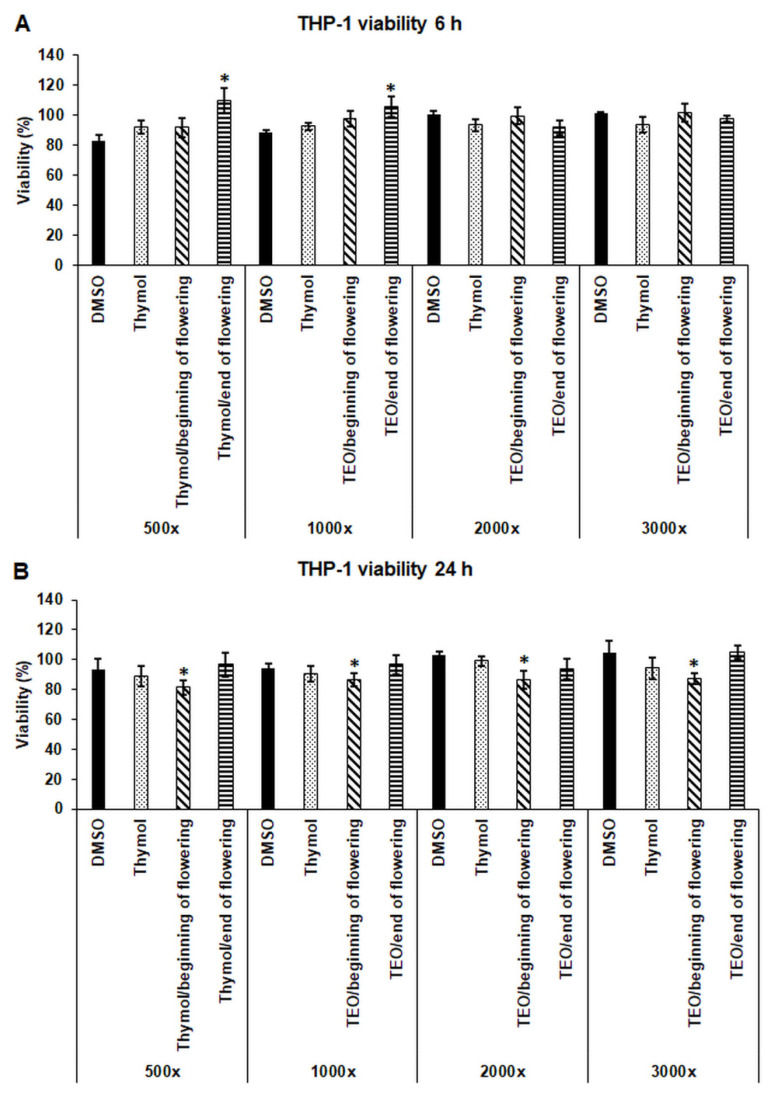
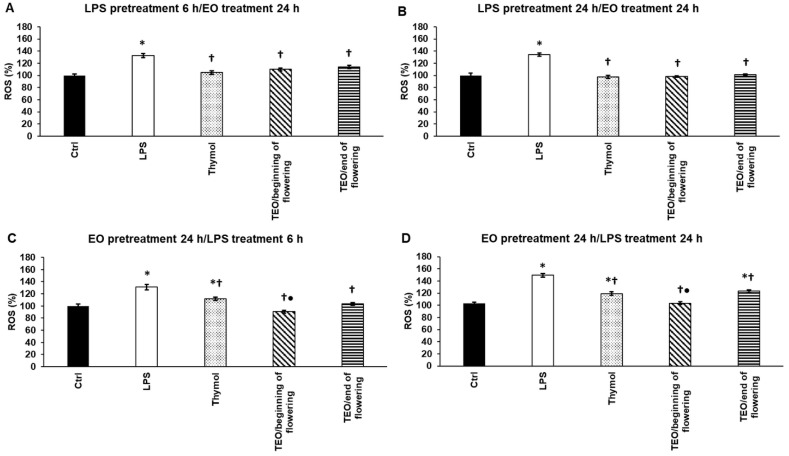
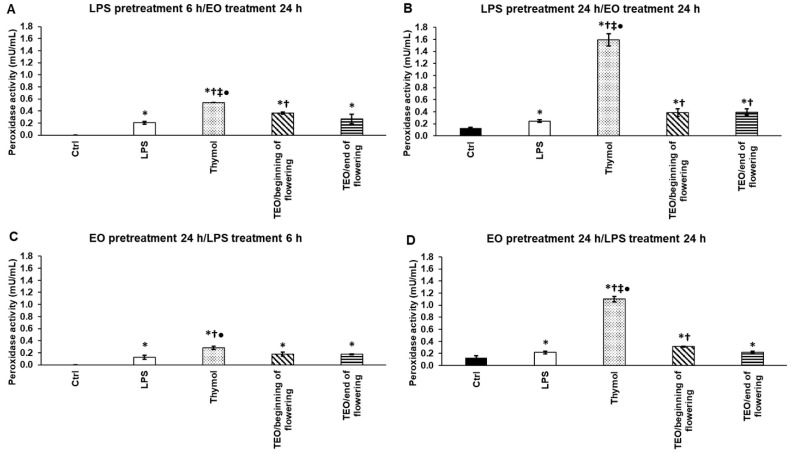
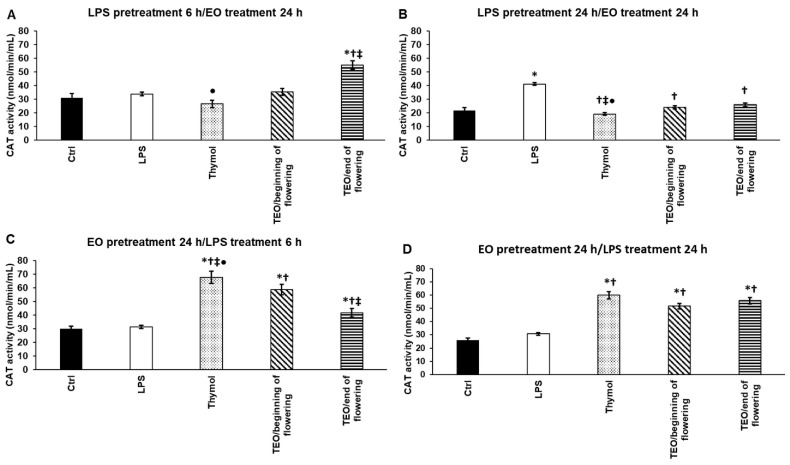
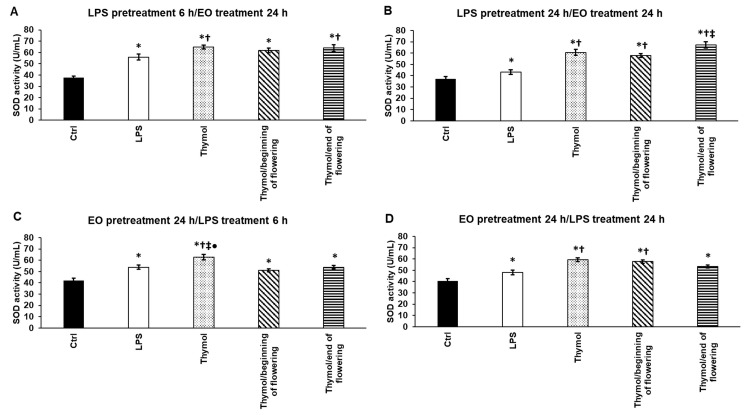
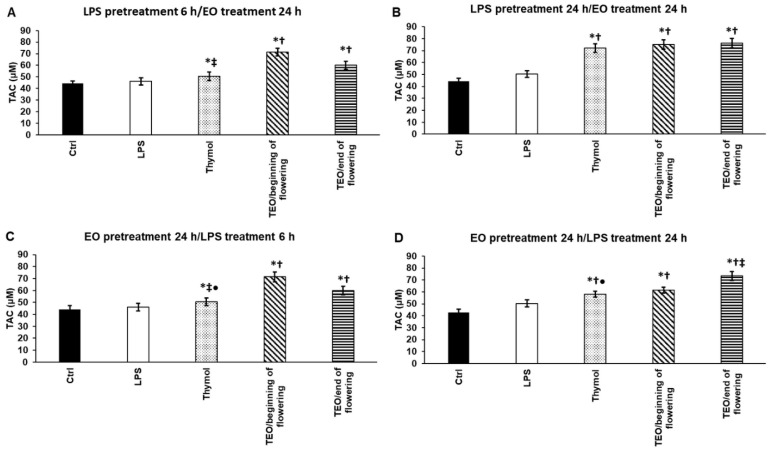
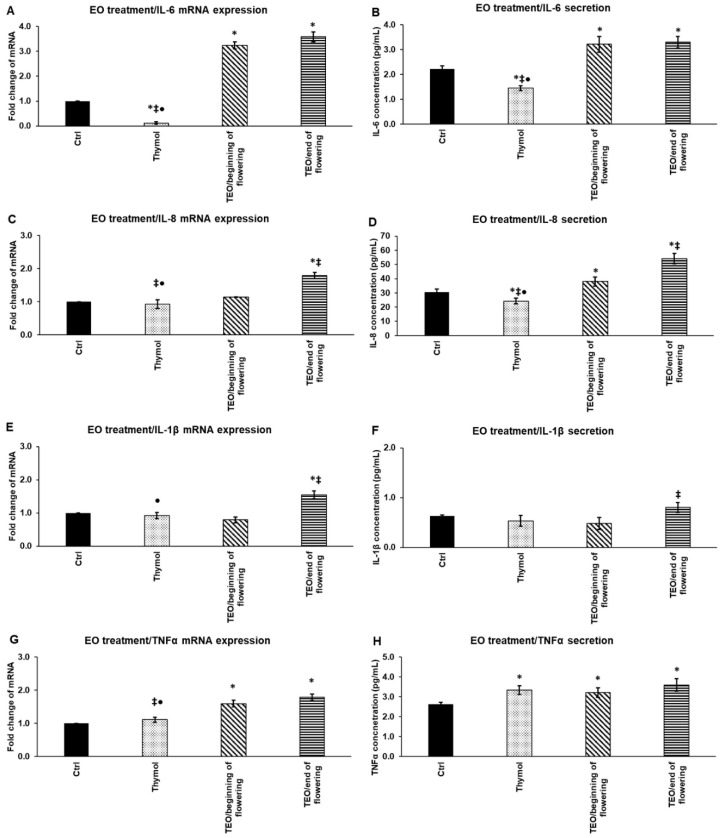
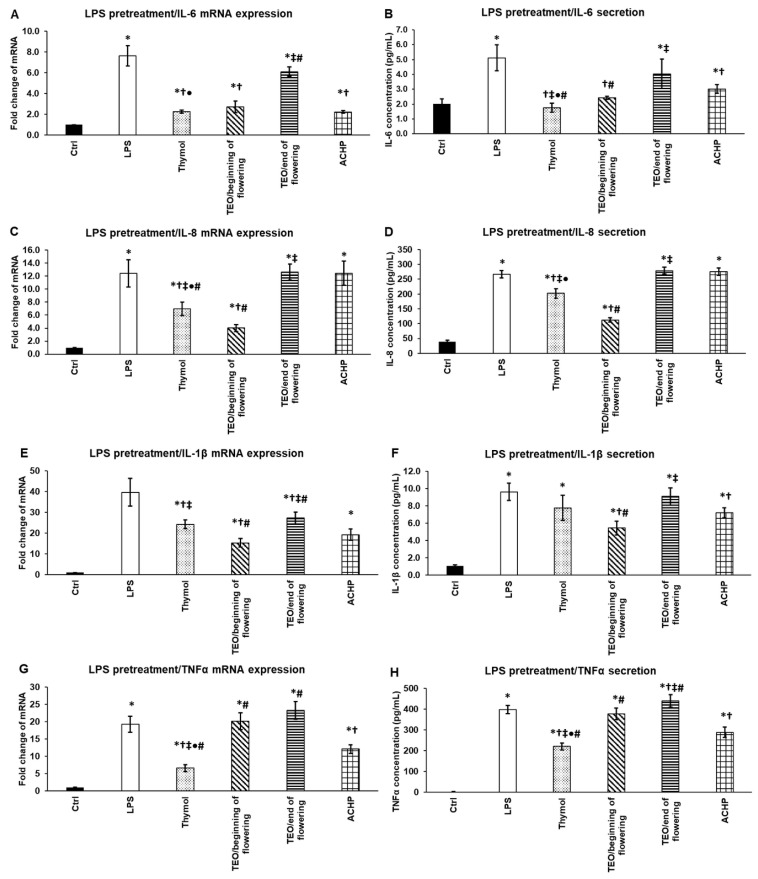
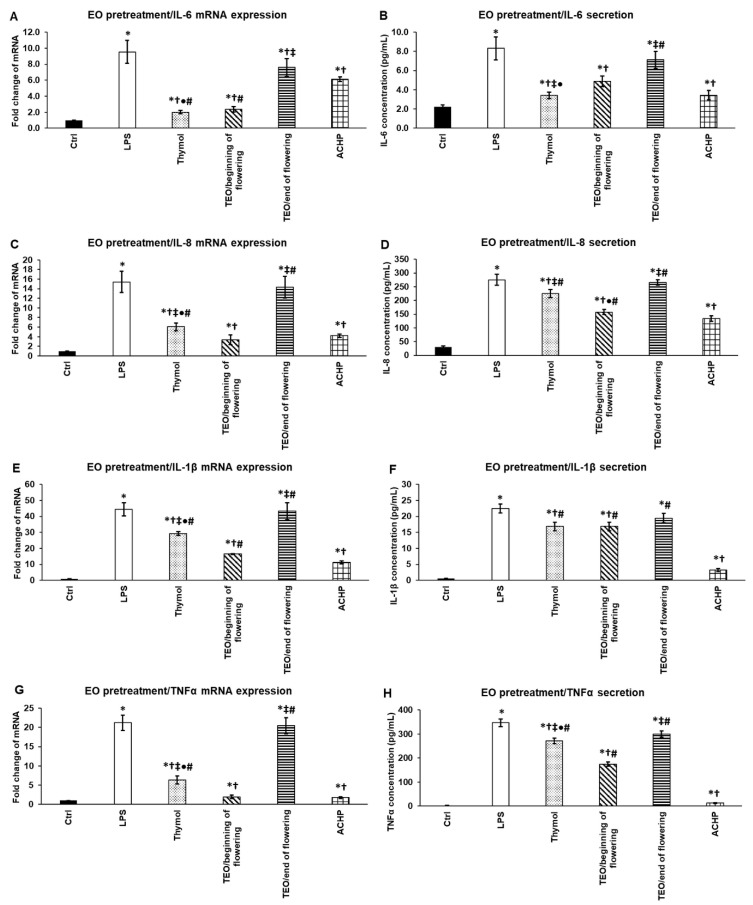
Thyme (Thymus vulgaris L.) essential oil (TEO) is widely used as an alternative therapy especially for infections of the upper respiratory tract. TEO possesses antiviral, antibacterial, and antifungal properties. The emerging antibiotic resistance of bacterial strains, including Pseudomonas aeruginosa, has prompted the urge to find alternative treatments. In the present study, we examined the anti-inflammatory and antioxidant effects of thymol, the main compound of TEO, and two TEOs prepared at the beginning and at the end of the flowering period that may make these oils promising candidates as complementary or alternative therapies against P. aeruginosa infections. The activity measurements of the antioxidant enzymes peroxidase (PX), catalase (CAT), and superoxide dismutase (SOD) as well as the determination of total antioxidant capacity of P. aeruginosa-activated THP-1 cells revealed that thymol and both TEOs increased CAT and SOD activity as well as the antioxidant capacity of the THP-1 cells. The measurements of the proinflammatory cytokine mRNA expression and secreted protein level of LPS-activated THP-1 cells showed that from the two TEOs, only TEO prepared at the beginning of the flowering period acted as a potent inhibitor of the synthesis of IL-6, IL-8, IL-β, and TNF-α. Our results suggest that not only thymol, but also the synergism or the antagonistic effects of the additional compounds of the essential oils are responsible for the anti-inflammatory activity of TEOs.

Keywords: antioxidant capacity; cytokines; essential oil; inflammation; macrophage; thyme.


Conflict of interest statement

The authors declare no conflict of interest.

Figures

Figure 1
Figure 1
Determination of the viability of THP-1 cells treated with thymol and TEOs. Viability of the THP-1 cells was measured using CCK-8 cell viability assay after 6 h (A) and 24 h (B) treatments using serial dilutions of the stock solutions of DMSO, thymol, and TEOs. Viability is expressed as percentile of the untreated cells. The bars represent mean values, and error bars represent standard deviation (SD) for four independent experiments (n = 4). Cell viability assays were carried out in quadruplicate in each experiment. Asterisks indicate p < 0.05 compared to the DMSO-treated cells. Statistical analysis was carried out by two-way ANOVA followed by Scheffe’s post hoc test.
Figure 2
Figure 2
Determination of the effects of thymol and TEOs on reactive oxygen species (ROS) generated by LPS. As a control, the THP-1 cells were treated with DMSO, the carrier of EOs or distilled water, and the solvent of LPS in the same order and for the same time as in the case of the EO and LPS pretreatments. For LPS treatment, the cells were treated with LPS for 6 h or 24 h, and then they were treated with 500-fold diluted DMSO for 24 h or were treated with DMSO for 24 h, and then they were treated with LPS for 6 h and 24 h. For LPS pretreatment, the cells were treated with LPS for 6 h and 24 h, and then they were treated using 500-fold diluted thymol or TEOs for 24 h. For EO pretreatment, the cells were treated with 500-fold diluted thymol or TEOs for 24 h followed by LPS treatments for 6 h and 24 h. Intracellular ROS production was determined by using Fluorometric Intracellular ROS Kit and was expressed as % compared to the control. The bars represent mean values, and error bars represent standard deviation (SD) for three independent experiments (n = 3). The assays were carried out in quadruplicate in each experiment. Asterisk indicates p < 0.05 compared to the control. Cross marks p < 0.05 compared to LPS treatment. Bullet marks p < 0.05 compared to TEO/end of flowering. Statistical analysis was carried out by two-way ANOVA followed by Scheffe’s post hoc test.
Figure 3
Figure 3
Determination of the effects of thymol and TEOs on peroxidase activity (PX) of the THP-1 cells. As a control, the THP-1 cells were treated with DMSO, the carrier of EOs or distilled water, and the solvent of LPS in the same order and for the same time as in the case of the EO and LPS pretreatments. For LPS treatment, the cells were treated with LPS for 6 h or 24 h, and then 500-fold diluted DMSO was added for 24 h, or the cells were treated with DMSO for 24 h, and then LPS was administered for 6 h and 24 h. For LPS pretreatment, the cells were incubated with LPS for 6 h and 24 h, and then 500-fold diluted thymol or TEOs were added for 24 h. For EO pretreatment, the cells were treated with 500-fold diluted thymol or TEOs for 24 h followed by LPS addition for 6 h and 24 h. Peroxidase activity was determined by Peroxidase Activity Assay Kit according to the protocol of the manufacturer and was expressed as mU/mL. The bars represent mean values, and error bars represent standard deviation (SD) for three independent experiments (n = 3). The assays were carried out in triplicate in each experiment. Asterisk indicates p < 0.05 compared to control. Cross marks p < 0.05 compared to LPS treatment. Double cross shows p < 0.05 compared to TEO/beginning of flowering. Bullet marks p < 0.05 compared to TEO/end of flowering. Statistical analysis was carried out by two-way ANOVA followed by Scheffe’s post hoc test.
Figure 4
Figure 4
Determination of the effects of thymol and TEOs on catalase (CAT) activity of the THP-1 cells. As a control, the THP-1 cells were treated with DMSO, the carrier of EOs or distilled water, and the solvent of LPS in the same order and for the same time as in the case of the EO and LPS pretreatments. For LPS treatment, the cells were treated with LPS for 6 h or 24 h, and then they were treated with 500-fold diluted DMSO for 24 h, or they were treated with DMSO for 24 h, and then they were treated with LPS for 6 h and 24 h. For LPS pretreatment, the cells were treated with LPS for 6 h and 24 h, and then they were treated using 500-fold diluted thymol or TEOs for 24 h. For EO pretreatment, the cells were treated with 500-fold diluted thymol or TEOs for 24 h followed by LPS treatments for 6 h and 24 h. CAT activity was determined using Catalase Assay kit according to the protocol of the manufacturer and was expressed as nmol/min/mL. The bars represent mean values, and error bars represent standard deviation (SD) for three independent experiments (n = 3). The assays were carried out in triplicate in each experiment. Asterisk indicates p < 0.05 compared to control. Cross marks p < 0.05 compared to LPS treatment. Double cross shows p < 0.05 compared to TEO/beginning of flowering. Bullet marks p < 0.05 compared to TEO/end of flowering. Statistical analysis was carried out by two-way ANOVA followed by Scheffe’s post hoc test.
Figure 5
Figure 5
Determination of the effects of thymol and TEOs on superoxide dismutase (SOD) activity of the THP-1 cells. As a control, the THP-1 cells were treated with DMSO, the carrier of EOs or distilled water, and the solvent of LPS in the same order and for the same time as in the case of the EO and LPS pretreatments. For LPS treatment, the cells were treated with LPS for 6 h or 24 h, and then they were treated with 500-fold diluted DMSO for 24 h or were treated with DMSO for 24 h, and then LPS was added for 6 h and 24 h. For LPS pretreatment, the cells were treated with LPS for 6 h and 24 h, and then they were treated using 500-fold diluted thymol or TEOs for 24 h. For EO pretreatment, the cells were treated with 500-fold diluted thymol or TEOs for 24 h followed by LPS administration for 6 h and 24 h. SOD activity was measured with Superoxide Dismutase (SOD) Activity Assay Kit according to the protocol of the manufacturer and was expressed as U/mL. The bars represent mean values, and error bars represent standard deviation (SD) for three independent experiments (n = 3). The assays were carried out in triplicate in each experiment. Asterisk indicates p < 0.05 compared to control. Cross marks p < 0.05 compared to LPS treatment. Double cross shows p < 0.05 compared to TEO/beginning of flowering. Bullet marks p < 0.05 compared to TEO/end of flowering. Statistical analysis was carried out by two-way ANOVA followed by Scheffe’s post hoc test.
Figure 6
Figure 6
Determination of the effects of thymol and TEOs on total antioxidant capacity (TAC) of the THP-1 cells. As a control, the THP-1 cells were treated with DMSO, the carrier of EOs or distilled water, and the solvent of LPS in the same order and for the same time as in the case of the EO and LPS pretreatments. For LPS treatment, the cells were treated with LPS for 6 h or 24 h, and then they were treated with 500-fold diluted DMSO for 24 h, or they were treated with DMSO for 24 h, and then LPS was added for 6 h and 24 h. For LPS pretreatment, the cells were treated with LPS for 6 h and 24 h, and then they were treated using 500-fold diluted thymol or TEOs for 24 h. For EO pretreatment, the cells were treated with 500-fold diluted thymol or TEOs for 24 h followed by LPS treatments for 6 h and 24 h. TAC was determined using Antioxidant Assay Kit according to the protocol of the manufacturer and was expressed as μM. The bars represent mean values, and error bars represent standard deviation (SD) for three independent experiments (n = 3). The assays were carried out in triplicate in each experiment. Asterisk indicates p < 0.05 compared to control. Cross marks p < 0.05 compared to LPS treatment. Double cross shows p < 0.05 compared to TEO/beginning of flowering. Bullet marks p < 0.05 compared to TEO/end of flowering. Statistical analysis was carried out by two-way ANOVA followed by Scheffe’s post hoc test.
Figure 7
Figure 7
Determination of mRNA expression (A,C,E,G) and protein (B,D,F,H) levels of proinflammatory cytokines IL-6, IL-8, IL-1β, and TNF-α after thymol and TEO treatments of THP-1 cells. THP-1 cells were treated with 500-fold diluted thymol and TEOs for 24 h. DMSO-treated cells were used as a control of the EO-treated cells. Real-time PCR for the proinflammatory cytokines was performed with SYBR green protocol. Β-actin was used as housekeeping gene, and the relative expression of controls was regarded as 1. Proinflammatory cytokine secretions were determined using IL-6-, IL-8-, IL-1β-, and TNF-α-specific ELISA kits according to the manufacturer’s protocols. The bars represent mean values, and error bars represent standard deviation (SD) for three independent determinations (n = 3). Real-time PCR and ELISA measurements were carried out in triplicate in each independent experiment. Asterisks indicate p < 0.05 compared to control. Double cross shows p < 0.05 compared to TEO/beginning of flowering. Bullet marks p < 0.05 compared to TEO/end of flowering. Statistical analysis was carried out by two-way ANOVA followed by Scheffe’s post hoc test.
Figure 8
Figure 8
Effects of thymol, TEOs, and ACHP NFκB inhibitor on mRNA (A,C,E,G) and protein (B,D,F,H) levels of proinflammatory cytokines IL-6, IL-8, IL-1β, and TNF-α after LPS pretreatment. THP-1 cells were pretreated with 100 ng/mL LPS for 24 h and then with 500-fold diluted thymol, TEOs, or 5 μM ACHP for 24 h. DMSO-treated cells were used as control of the treated cells. Real-time PCR for the proinflammatory cytokines was performed with SYBR green protocol. β-actin was used as housekeeping gene, and the relative expression of controls was regarded as 1. Pro-inflammatory cytokine secretions were determined using IL-6-, IL-8-, IL-1β-, and TNF-α-specific ELISA kits according to the manufacturer’s protocols. The columns represent mean values, and error bars represent standard deviation (SD) for three independent experiments (n = 3). The assays were carried out in triplicate in each experiment. Asterisk indicates p < 0.05 compared to control. Cross marks p < 0.05 compared to LPS treatment. Double cross shows p < 0.05 compared to TEO/beginning of flowering. Bullet marks p < 0.05 compared to TEO/end of flowering. Number sign indicates p < 0.05 compared to ACHP treatment. Statistical analysis was carried out by two-way ANOVA followed by Scheffe’s post hoc test.
Figure 9
Figure 9
Effects of thymol, TEOs, and ACHP NFκB inhibitor pretreatments on mRNA (A,C,E,G) and protein (B,D,F,H) levels of proinflammatory cytokines IL-6, IL-8, IL-1β, and TNF-α. THP-1 cells were pretreated with 500-fold diluted thymol, TEOs, and 5 μM ACHP for 24 h and then with 100 ng/mL LPS for 24 h. DMSO administration was used as a control of the treated cells. Real-time PCR for the proinflammatory cytokines was performed with SYBR green protocol. β-actin was used as housekeeping gene, and the relative expression of controls was regarded as 1. Proinflammatory cytokine secretions were determined using IL-6-, IL-8-, IL-1β-, and TNF-α-specific ELISA kits according to the manufacturer’s protocols. The columns represent mean values, and error bars represent standard deviation (SD) for three independent experiments (n = 3). The assays were carried out in triplicate in each experiment. Asterisk indicates p < 0.05 compared to control. Cross marks p < 0.05 compared to LPS treatment. Double cross shows p < 0.05 compared to TEO/beginning of flowering. Bullet marks p < 0.05 compared to TEO/end of flowering. Number sign indicates p < 0.05 compared to ACHP treatment. Statistical analysis was carried out by two-way ANOVA followed by Scheffe’s post hoc test.

References

    1. Kowalczyk A., Przychodna M., Sopata S., Bodalska A., Fecka I. Thymol and Thyme Essential Oil—New Insights into Selected Therapeutic Applications. Molecules. 2020;25:4125. doi: 10.3390/molecules25184125. - DOI - PMC - PubMed
    1. Tariq S., Wani S., Rasool W., Shafi K., Bhat M.A., Prabhakar A., Shalla A.H., Rather M.A. A Comprehensive Review of the Antibacterial, Antifungal and Antiviral Potential of Essential Oils and Their Chemical Constituents against Drug-Resistant Microbial Pathogens. Microb. Pathog. 2019;134:103580. doi: 10.1016/j.micpath.2019.103580. - DOI - PubMed
    1. Thosar N., Basak S., Bahadure R.N., Rajurkar M. Antimicrobial Efficacy of Five Essential Oils against Oral Pathogens: An in Vitro Study. Eur. J. Dent. 2013;7:S071–S077. doi: 10.4103/1305-7456.119078. - DOI - PMC - PubMed
    1. Elbe E., Yigitturk G., Cavusoglu T., Uyanikgil Y. Apoptotic Effects of Thymol, a Novel Monoterpene Phenol, on Different Types of Cancer. Bratislava Med. J. 2020;121:122–128. doi: 10.4149/BLL_2020_016. - DOI - PubMed
    1. Marchese A., Orhan I.E., Daglia M., Barbieri R., Di Lorenzo A., Nabavi S.F., Gortzi O., Izadi M., Nabavi S.M. Antibacterial and Antifungal Activities of Thymol: A Brief Review of the Literature. Food Chem. 2016;210:402–414. doi: 10.1016/j.foodchem.2016.04.111. - DOI - PubMed

LinkOut - more resources