. 2022 Jul 8;14(14):3340.
doi: 10.3390/cancers14143340.

Selective CDK9 Inhibition by Natural Compound Toyocamycin in Cancer Cells

Affiliations

Selective CDK9 Inhibition by Natural Compound Toyocamycin in Cancer Cells

Somnath Pandey et al. Cancers (Basel). .

Abstract

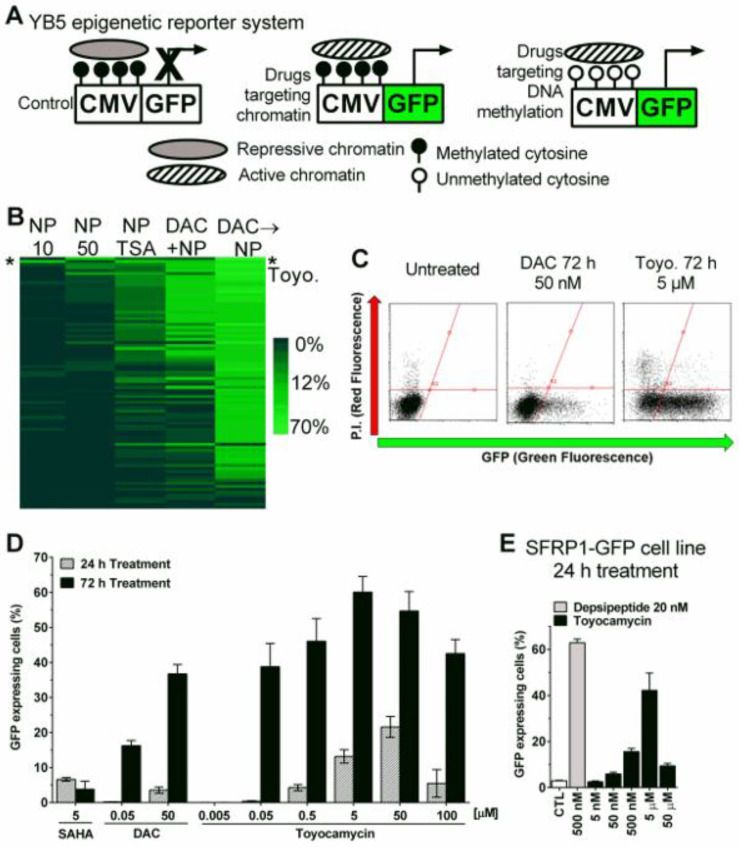
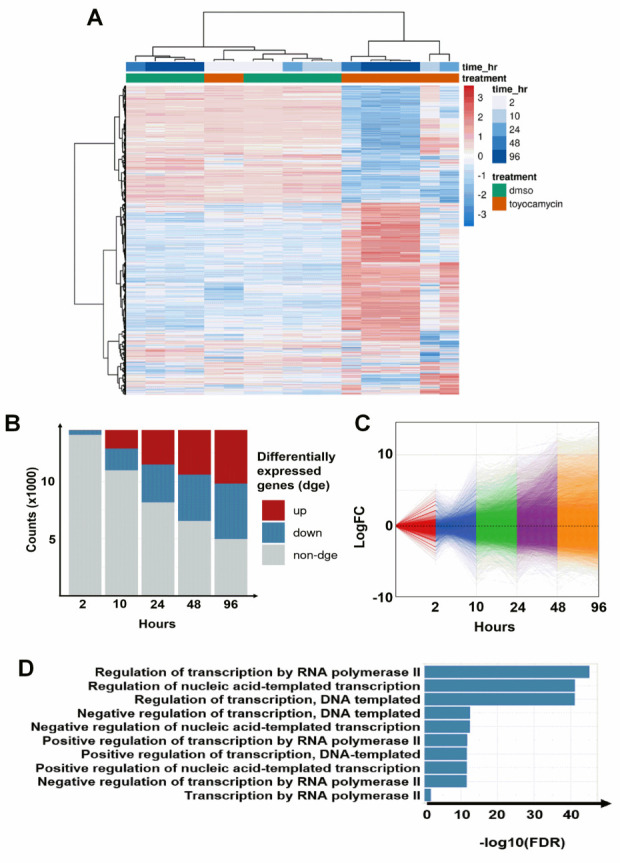
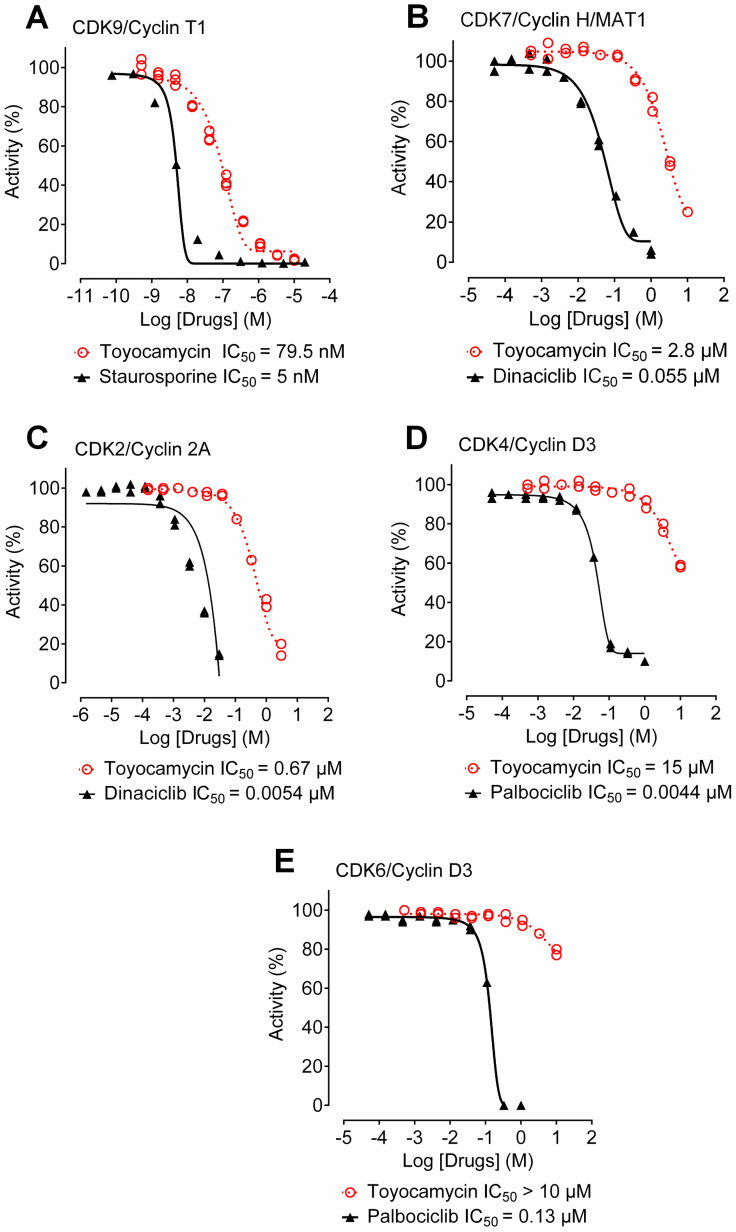
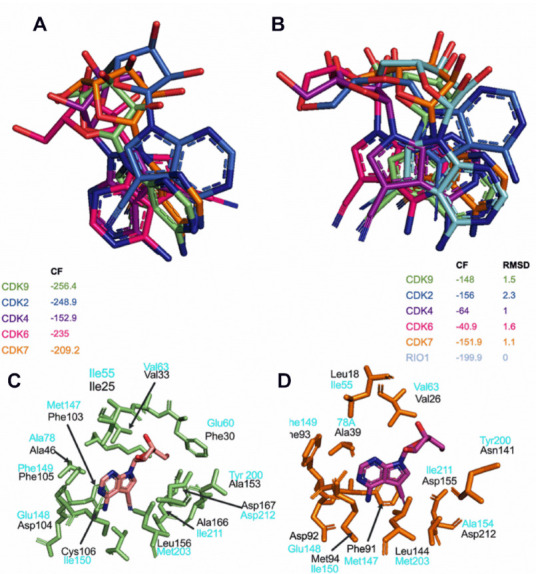
Aberrant transcription in cancer cells involves the silencing of tumor suppressor genes (TSGs) and activation of oncogenes. Transcriptomic changes are associated with epigenomic alterations such as DNA-hypermethylation, histone deacetylation, and chromatin condensation in promoter regions of silenced TSGs. To discover novel drugs that trigger TSG reactivation in cancer cells, we used a GFP-reporter system whose expression is silenced by promoter DNA hypermethylation and histone deacetylation. After screening a natural product drug library, we identified that toyocamycin, an adenosine-analog, induces potent GFP reactivation and loss of clonogenicity in human colon cancer cells. Connectivity-mapping analysis revealed that toyocamycin produces a pharmacological signature mimicking cyclin-dependent kinase (CDK) inhibitors. RNA-sequencing revealed that the toyocamycin transcriptomic signature resembles that of a specific CDK9 inhibitor (HH1). Specific inhibition of RNA Pol II phosphorylation level and kinase assays confirmed that toyocamycin specifically inhibits CDK9 (IC50 = 79 nM) with a greater efficacy than other CDKs (IC50 values between 0.67 and 15 µM). Molecular docking showed that toyocamycin efficiently binds the CDK9 catalytic site in a conformation that differs from other CDKs, explained by the binding contribution of specific amino acids within the catalytic pocket and protein backbone. Altogether, we demonstrated that toyocamycin exhibits specific CDK9 inhibition in cancer cells, highlighting its potential for cancer chemotherapy.

Keywords: CDK9 inhibitor; CDKs; RNA Pol II phosphorylation; cancer; drug screening; epigenetics; molecular docking; toyocamycin.


Conflict of interest statement

J.-P.J.I. is a founder and shareholder in Epigenonco, which seeks to develop a CDK9 inhibitor as an anti-cancer drug. The rest of the authors declare that they have no competing interests.

Figures

Figure 1
Figure 1
Epigenetic drug screening with natural compound library identifies toyocamycin as the most promising hit. (A) Schematic description of YB5 epigenetic reporter system in untreated condition (left), showing GFP expression upon drug-induced active chromatin (middle), or after drug-induced DNA demethylation and consequent chromatin activation (right). (B) Heatmap showing percentages of GFP-expressing cells after natural products (NP) screening in YB5 cells with the 5 different schedules (n = 1). NP10 means treatment with natural products at 10 µM for 72 h. NP50 means treatment with natural compound library at 50 µM for 24 h. NP TSA means treatment with natural products at 10 µM for 72 h followed by 24 h treatment with 200 nM trichostatin A. DAC+NP means 72 h treatment with decitabine (DAC) in simultaneous combination with 10 µM NP. DAC → NP means 72 h treatment with decitabine at 50 nM followed by NP at 50 µM. Each horizontal line represents a compound. Toyocamycin is highlighted with a star on the heatmap (*). (C) Flow cytometry graphical representations of YB5 cells for GFP fluorescence (x-axis) counterstained with propidium iodide (P.I., y-axis) for dead cell staining in untreated and treated cells (drugs and doses are indicated on the graphs, 10,000 cells were acquired). (D) Percentage of GFP-expressing cells in YB5 cells after vorinostat (SAHA), DAC, and toyocamycin treatments (at doses indicated on the graph, n = 3). (E) Percentage of GFP-expressing cells in HCT116 cells after depsipeptide and toyocamycin treatments (at doses indicated on the graph, n = 3).
Figure 2
Figure 2
Toyocamycin induces potent time-dependent gene expression changes. YB5 cells were treated with toyocamycin (250 nM) during 2, 10, 24, 48, and 96 h prior to RNA-seq. (A) Heatmap showing gene expression log2 fold change (blue-red scale) between toyocamycin-treated and untreated groups (16,535 genes are shown on the heatmap). The time points at 2 and 10 h are done in duplicates. The time points at 96 h have been done in triplicates and the 24/48 h of treatment have been done with only one replicate. (B) Number of differentially expressed genes (upregulated in red and downregulated in blue, unchanged expression is depicted in grey). After 2 h toyocamycin treatment, 513 genes were downregulated and 24 genes were upregulated. After 10 h toyocamycin treatment, 2299 genes were downregulated and 1999 genes were upregulated. After 24 h toyocamycin treatment, 3651 genes were downregulated and 3387 genes were upregulated. After 48 h toyocamycin treatment, 4377 genes were downregulated and 4449 genes were upregulated. After 96 h toyocamycin treatment, 5061 genes were downregulated and 5050 genes were upregulated. (C) Gene expression variation over time during toyocamycin treatment. (D) Gene enrichment analysis showing RNA regulatory pathways that are downregulated after toyocamycin treatment (2 h).
Figure 3
Figure 3
Common gene regulation between toyocamycin treatment and HH1 treatment in YB5 cells. RNA-seq data sets were merged to compare the expression values of common genes differentially regulated by toyocamycin and HH1 in YB5 cells (downregulated genes with Log2FC < –1 and upregulated genes with Log2FC > 1, p-adjusted values < 0.05). Gene expression data sets are presented (A) 2 h, (B) 24 h, and (C) 96 h after toyocamycin exposure. (D) Endogenous retrovirus expression levels were compared between toyocamycin and HH1 treatments (24 h). The number of common genes is indicated on all the graphs.
Figure 4
Figure 4
Toyocamycin demonstrates CDK9 inhibition in colon cancer cells. YB5 cells were transfected with HA-CDK9 or FLAG-CDK9 vectors. (A) Western blotting shows transfection efficiency. Loading control is shown using β-actin antibody. (B) Percentage of GFP-expressing YB5 cells after DNA hypomethylating drug (DAC, 50 nM, 72 h) or selective CDK9 inhibitor (MC180295, 500 nM, 48 h) in presence or absence of CDK9-expressing vectors (n = 2). (C) Protein expression levels of CDK9 and cell cycle CDK targets. RNA-Pol II (N-term and C-term), phospho-Pol II, Rb, phospho-Rb, and CDK9 levels were measured after 6 h toyocamycin treatment in HCT116 cells (doses are indicated in the graph) or with DMSO. Treatments with CDK9 inhibitor BAY 1251152 at 1–10 µM for 16 h were used as a positive control. β-actin was used as loading control. Molecular weight of each protein is indicated on the graph. Full western blots are available in supplementary. (D) Ratio of Phospho-Pol II Ser 2/Pol II and Phospho-Rb T826/Rb, normalized on β-actin and DMSO are shown (mean  ±  SEM, N ≥ 3 biological replicates, *: p ≤ 0.05 obtained by unpaired Student’s t test). (E) Cell viability analysis by Viacount staining in YB5 and HCT116 cells after 24 and 72 h toyocamycin treatment (0.05, 0.5, 5, and 50 µM, n = 3) relative to untreated cells. (F). Cell cycle analysis by flow cytometry in HCT116 cells after 6 h toyocamycin treatment followed by 18 h without exposure (n = 3, a star indicates statistical difference between treated group and control, unpaired Student’s t-test, p < 0.05).
Figure 5
Figure 5
Toyocamycin is a potent and specific inhibitor of CDK9. Enzymatic assays were performed with toyocamycin at different concentrations against (A) CDK9/CyclinT1, (B) CDK7/Cyclin H/MAT1, (C) CDK2/Cyclin 2A, (D) CDK4/Cyclin D3, and (E) CDK6/Cyclin D3. Concentration producing 50% enzymatic inhibition (IC50) was calculated for toyocamycin and other inhibitors listed in the graphs.
Figure 6
Figure 6
Toyocamycin docking simulations in different CDKs. (A) Best docking poses of toyocamycin in CDK2 (blue marine), CDK4 (purple), CDK6 (pink), CDK7 (orange), and CDK9 (lime green). (B) Best RMSD poses of toyocamycin within Rio1 kinase crystal pose in the different CDKs. (C) ATP binding site residues interacting with toyocamycin in CDK9 (lime green) and (D) CDK7 (orange) with corresponding interacting residues determined in Rio1-toyocamycin complex (light blue).

References

    1. Jones P.A., Issa J.P., Baylin S. Targeting the cancer epigenome for therapy. Nat. Rev. Genet. 2016;17:630–641. doi: 10.1038/nrg.2016.93. - DOI - PubMed
    1. Baylin S.B., Jones P.A. Epigenetic Determinants of Cancer. Cold Spring Harbor Perspect. Biol. 2016;8:a019505. doi: 10.1101/cshperspect.a019505. - DOI - PMC - PubMed
    1. Baylin S.B., Jones P.A. A decade of exploring the cancer epigenome—Biological and translational implications. Nat. Rev. Cancer. 2011;11:726–734. doi: 10.1038/nrc3130. - DOI - PMC - PubMed
    1. Pandey S., Pruitt K. Functional assessment of MeCP2 in Rett syndrome and cancers of breast, colon, and prostate. Biochem. Cell Biol. Biochim. Biol. Cell. 2017;95:368–378. doi: 10.1139/bcb-2016-0154. - DOI - PubMed
    1. Kelly T.K., De Carvalho D.D., Jones P.A. Epigenetic modifications as therapeutic targets. Nat. Biotechnol. 2010;28:1069–1078. doi: 10.1038/nbt.1678. - DOI - PMC - PubMed