. 2022 Jul 9;14(14):3342.
doi: 10.3390/cancers14143342.

Increased Soluble PD-1 Predicts Response to Nivolumab plus Ipilimumab in Melanoma

Affiliations

Increased Soluble PD-1 Predicts Response to Nivolumab plus Ipilimumab in Melanoma

Jesper Geert Pedersen et al. Cancers (Basel). .

Abstract

Background: Checkpoint inhibitors have revolutionized the treatment of metastatic melanoma, yielding long-term survival in a considerable proportion of the patients. Yet, 40-60% of patients do not achieve a long-term benefit from such therapy, emphasizing the urgent need to identify biomarkers that can predict response to immunotherapy and guide patients for the best possible treatment. Here, we exploited an unsupervised machine learning approach to identify potential inflammatory cytokine signatures from liquid biopsies, which could predict response to immunotherapy in melanoma.

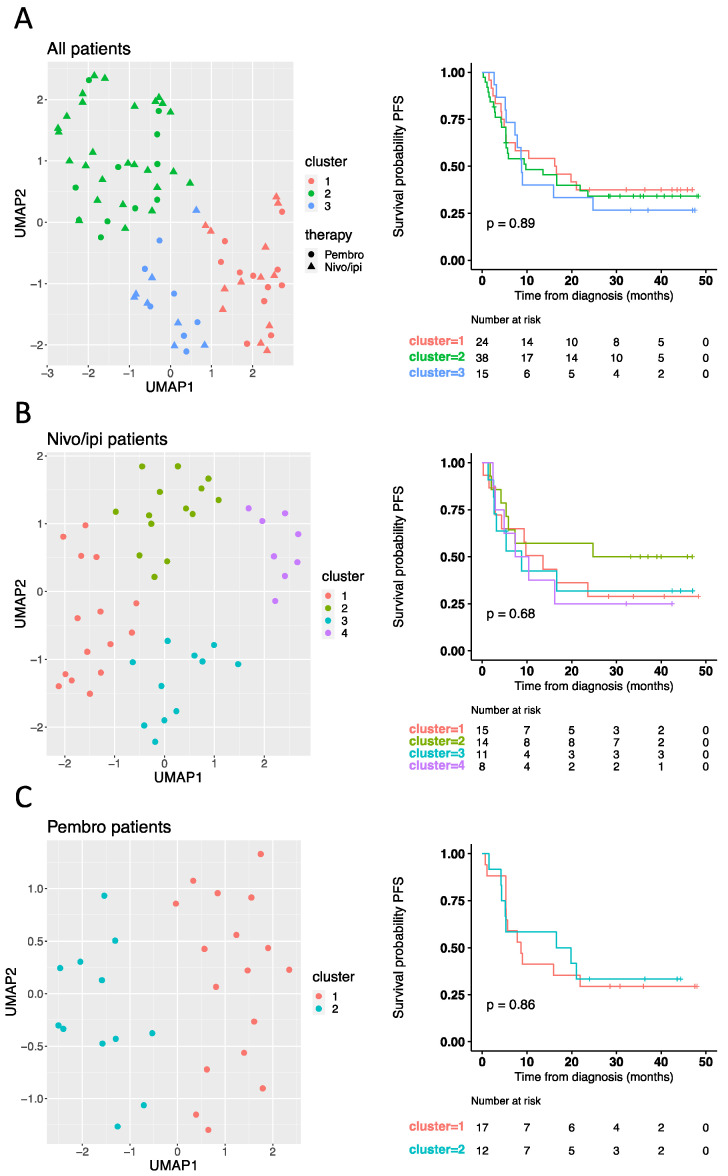
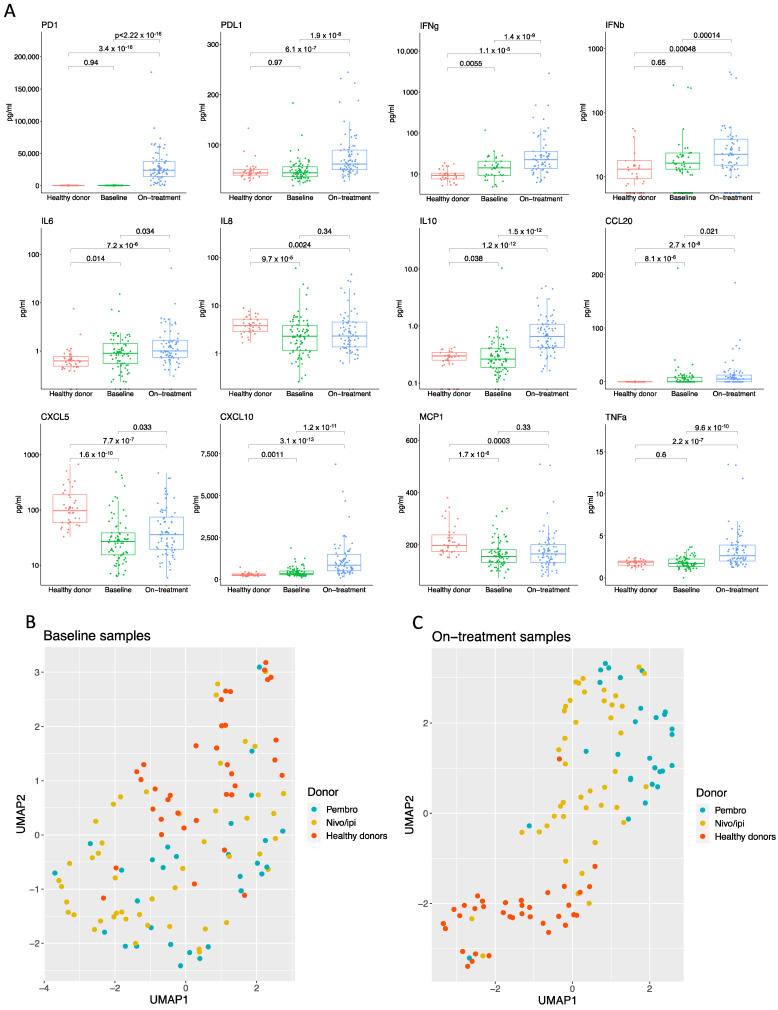
Methods: We studied a cohort of 77 patients diagnosed with unresectable advanced-stage melanoma undergoing treatment with first-line nivolumab plus ipilimumab or pembrolizumab. Baseline and on-treatment plasma samples were tested for levels of PD-1, PD-L1, IFNγ, IFNβ, CCL20, CXCL5, CXCL10, IL6, IL8, IL10, MCP1, and TNFα and analyzed by Uniform Manifold Approximation and Projection (UMAP) dimension reduction method and k-means clustering analysis.

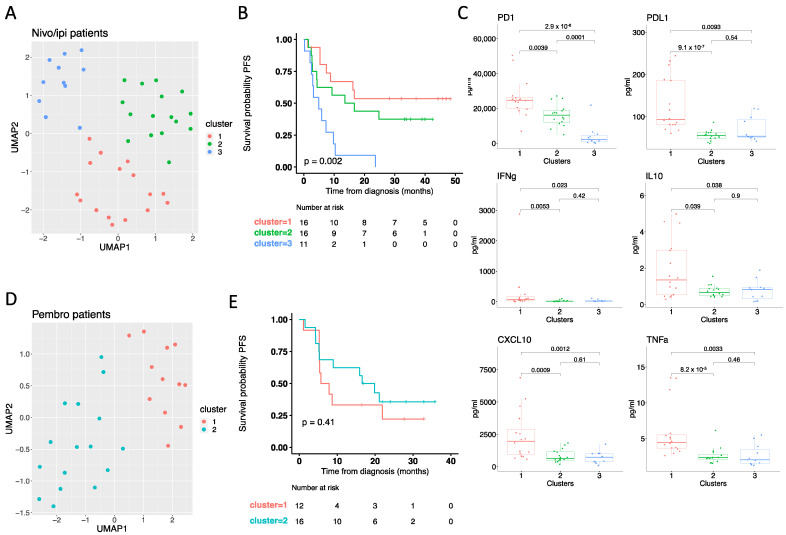
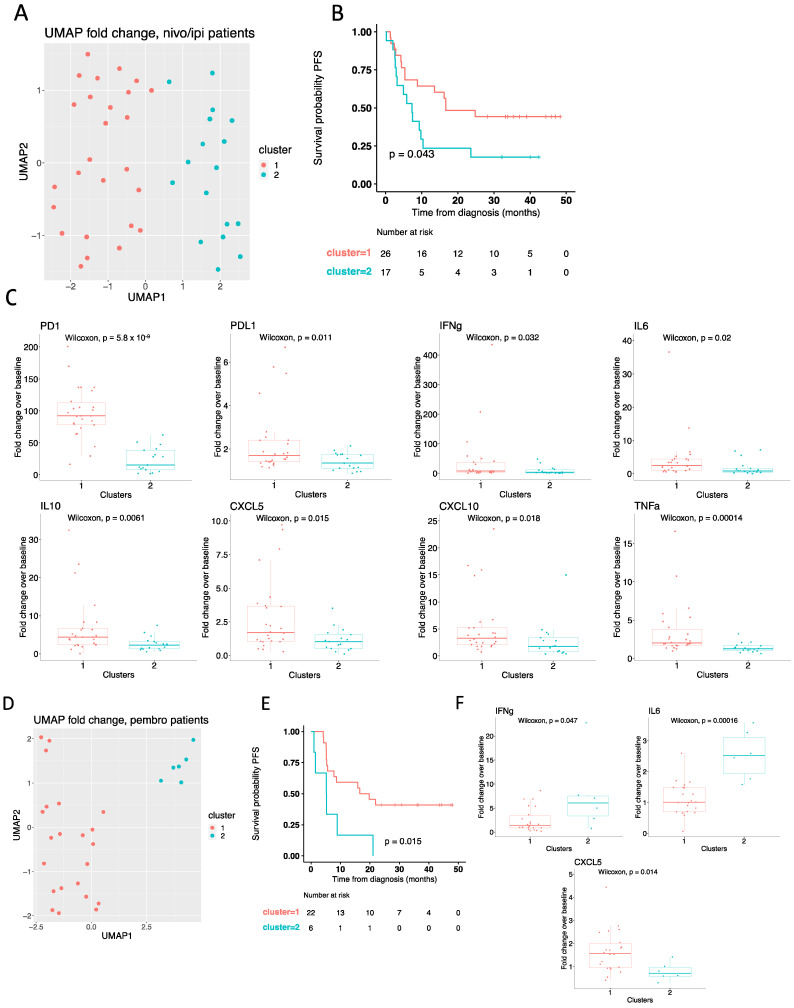
Results: Interestingly, using UMAP analysis, we found that treatment-induced cytokine changes measured as a ratio between baseline and on-treatment samples correlated significantly to progression-free survival (PFS). For patients treated with nivolumab plus ipilimumab we identified a group of patients with superior PFS that were characterized by significantly higher baseline-to-on-treatment increments of PD-1, PD-L1, IFNγ, IL10, CXCL10, and TNFα compared to patients with worse PFS. Particularly, a high PD-1 increment was a strong individual predictor for superior PFS (HR = 0.13; 95% CI 0.034-0.49; p = 0.0026). In contrast, decreasing levels of IFNγ and IL6 and increasing levels of CXCL5 were associated with superior PFS in the pembrolizumab group, although none of the cytokines were individually predictors for PFS.

Conclusions: In short, our study demonstrates that a high increment of PD-1 is associated with superior PFS in advanced-stage melanoma patients treated with nivolumab plus ipilimumab. In contrast, decreasing levels of IFNγ and IL6, and increasing levels of CXCL5 are associated with response to pembrolizumab. These results suggest that using serial samples to monitor changes in cytokine levels early during treatment is informative for treatment response.

Keywords: PD-1; immunotherapy; inflammatory cytokines; liquid biopsies; melanoma.


Conflict of interest statement

M.R.J. is shareholder and consultant for the biotech companies Stipe Therapeutics and Unikum Therapeutics who develop novel cancer immunotherapies to treat cancer. The rest of the authors have no conflicts to declare.

Figures

Figure 1
Figure 1
Baseline cytokine signature does not predict response to checkpoint inhibitors. Plasma levels of PD1, PD-L1, IFNγ, IFNβ, IL6, IL8, IL10, CCL20, CXCL5, CXCL10, MCP1, and TNFα were measured in baseline samples from all patients (n = 77). UMAP analysis based on all 12 cytokines was performed to visualize the distribution of all patients (A, left panel), nivo/ipi patients only (n = 48) (B, left panel), and pembro patients only (n = 29) (C, left panel), followed by k-means clustering analysis to divide patients into clusters. Clusters are represented by colors (AC), whereas the shape of the points represents first-line therapy (A). (AC, right panel) Kaplan-Meier curves showing the percentage of progression-free survival (PFS) by cytokine profile defined clusters. Statistical significance was tested with a log-rank test. Nivo/ipi, nivolumab plus ipilimumab; pembro, pembrolizumab.
Figure 2
Figure 2
Checkpoint inhibitor therapy shapes distinct inflammatory cytokine profile. (A) Box plots showing levels of 12 cytokines measured in blood samples from healthy donors (n = 36), patient samples at baseline (n = 77), and patient samples taken on-treatment with either pembrolizumab or nivolumab and ipilimumab (n = 71). Statistical significance was tested with an unpaired Wilcoxon test. (B) UMAP analysis based on cytokine profile from healthy donors and baseline samples from pembro and nivo/ipi patients. (C) UMAP analysis based on cytokine profile from healthy donors (n = 36) and on-treatment samples from pembro (n = 28) and nivo/ipi patients (n = 43). Pembro, pembrolizumab; nivo/ipi, nivolumab plus ipilimumab.
Figure 3
Figure 3
On-treatment cytokine profile predicts response to nivolumab and ipilimumab. (A) UMAP analysis of cytokine profiles in on-treatment samples from nivo/ipi patients (n = 43). Colors indicate clusters identified by k-means clustering. (B) Kaplan-Meier curve showing the percentage of progression-free survival (PFS) of nivo/ipi patients by clusters defined in panel (A). Statistical significance was tested with a log-rank test. (C) Box plots showing plasma levels of PD1, PD-L1, IFNγ, IL10, CXCL10, and TNFα measured in on-treatment samples from nivo/ipi patients, according to clusters defined in panel (A). Statistical significance was tested with an unpaired Wilcoxon test. (D) UMAP analysis of cytokine profiles in on-treatment samples from pembro patients (n = 28). Colors indicate clusters identified by k-means clustering. (E) Kaplan-Meier curve showing the percentage of PFS of pembro patients by clusters defined in panel (D). Statistical significance was tested with a log-rank test. Nivo/ipi, nivolumab plus ipilimumab; pembro, pembrolizumab.
Figure 4
Figure 4
Treatment-induced cytokine changes predict response to checkpoint inhibitors. (A) UMAP analysis of nivo/ipi patients (n = 43) based on the fold change over baseline for all 12 cytokines. Colors indicate clusters defined by k-means clustering. (B) Kaplan-Meier curve showing the percentage of progression-free survival (PFS) for nivo/ipi patients by clusters defined in panel (A). Log-rank test was used to test for statistical significance. (C) Box plots showing the fold change over baseline for PD1, PD-L1, IFNγ, IL6, IL10, CXCL5, CXCL10, and TNFα in nivo/ipi patients by clusters defined in panel A. Statistical significance was tested with an unpaired Wilcoxon test. (D) UMAP analysis of pembro patients (n = 28) based on the fold change over baseline for all 12 cytokines. Colors indicate clusters defined by k-means clustering. (E) Kaplan-Meier curve showing the percentage of PFS for pembro patients by clusters defined in panel (D). Log-rank test was used to test for statistical significance. (F) Box plots showing the fold change over baseline for IFNγ, CXCL5, and IL6 in pembro patients by clusters defined in panel (D). Statistical significance was tested with an unpaired Wilcoxon test. Nivo/ipi, nivolumab plus ipilimumab.

References

    1. Robert C., Ribas A., Schachter J., Arance A., Grob J.-J., Mortier L., Daud A., Carlino M.S., McNeil C.M., Lotem M., et al. Pembrolizumab versus ipilimumab in advanced melanoma (KEYNOTE-006): Post-hoc 5-year results from an open-label, multicentre, randomised, controlled, phase 3 study. Lancet Oncol. 2019;20:1239–1251. doi: 10.1016/S1470-2045(19)30388-2. - DOI - PubMed
    1. Wolchok J.D., Chiarion-Sileni V., Gonzalez R., Grob J.-J., Rutkowski P., Lao C.D., Cowey C.L., Schadendorf D., Wagstaff J., Dummer R., et al. Long-Term Outcomes With Nivolumab Plus Ipilimumab or Nivolumab Alone Versus Ipilimumab in Patients With Advanced Melanoma. J. Clin. Oncol. 2022;40:127–137. doi: 10.1200/JCO.21.02229. - DOI - PMC - PubMed
    1. Larkin J., Chiarion-Sileni V., Gonzalez R., Grob J.J., Cowey C.L., Lao C.D., Schadendorf D., Dummer R., Smylie M., Rutkowski P., et al. Combined Nivolumab and Ipilimumab or Monotherapy in Untreated Melanoma. N. Engl. J. Med. 2015;373:23–34. doi: 10.1056/NEJMoa1504030. - DOI - PMC - PubMed
    1. Schachter J., Ribas A., Long G.V., Arance A., Grob J.-J., Mortier L., Daud A., Carlino M.S., McNeil C., Lotem M., et al. Pembrolizumab versus ipilimumab for advanced melanoma: Final overall survival results of a multicentre, randomised, open-label phase 3 study (KEYNOTE-006) Lancet. 2017;390:1853–1862. doi: 10.1016/S0140-6736(17)31601-X. - DOI - PubMed
    1. Gide T.N., Wilmott J.S., Scolyer R.A., Long G.V. Primary and Acquired Resistance to Immune Checkpoint Inhibitors in Metastatic Melanoma. Clin. Cancer Res. 2018;24:1260–1270. doi: 10.1158/1078-0432.CCR-17-2267. - DOI - PubMed