. 2022 Jul 16;14(14):3459.
doi: 10.3390/cancers14143459.

Formulation of a Thermosensitive Imaging Hydrogel for Topical Application and Rapid Visualization of Tumor Margins in the Surgical Cavity

Affiliations

Formulation of a Thermosensitive Imaging Hydrogel for Topical Application and Rapid Visualization of Tumor Margins in the Surgical Cavity

Ethan Walker et al. Cancers (Basel). .

Abstract

Background: Tumor-positive surgical margins during primary breast cancer (BCa) surgery are associated with a two-fold increase in the risk of local recurrence when compared with tumor-negative margins. Pathological microscopic evaluation of the samples only assesses about 1/10 of 1% of the entire volume of the removed BCa specimens, leading to margin under-sampling and potential local recurrence in patients with pathologically clean margins, i.e., false negative margins. In the case of tumor-positive margins, patients need to undergo re-excision and/or radiation therapy, resulting in increases in complications, morbidity, and healthcare costs. Development of a simple real-time imaging technique to identify residual BCa in the surgical cavity rapidly and precisely could significantly improve the quality of care.

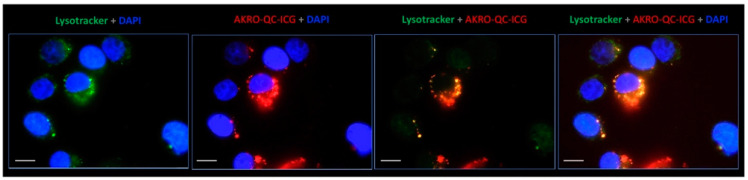
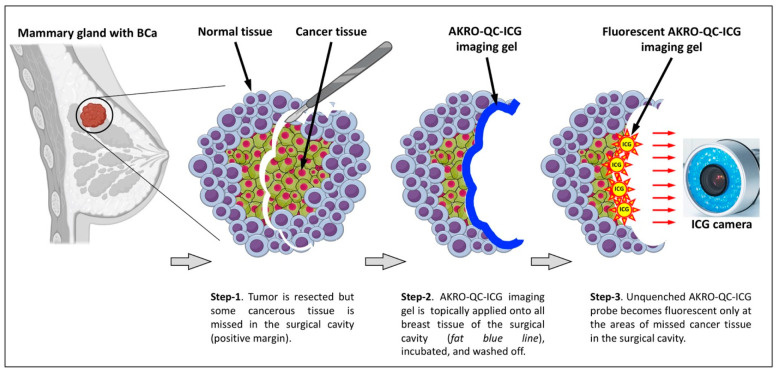
Methods: A small-molecule, fluorescently quenched protease-substrate probe, AKRO-QC-ICG, was tested as part of a thermosensitive imaging gel formulated for topical application and imaging of the BCa surgical cavity.

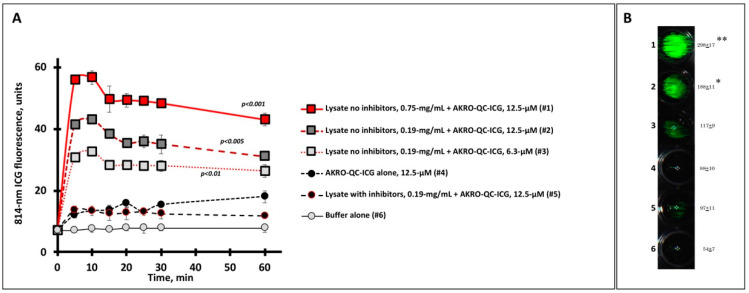
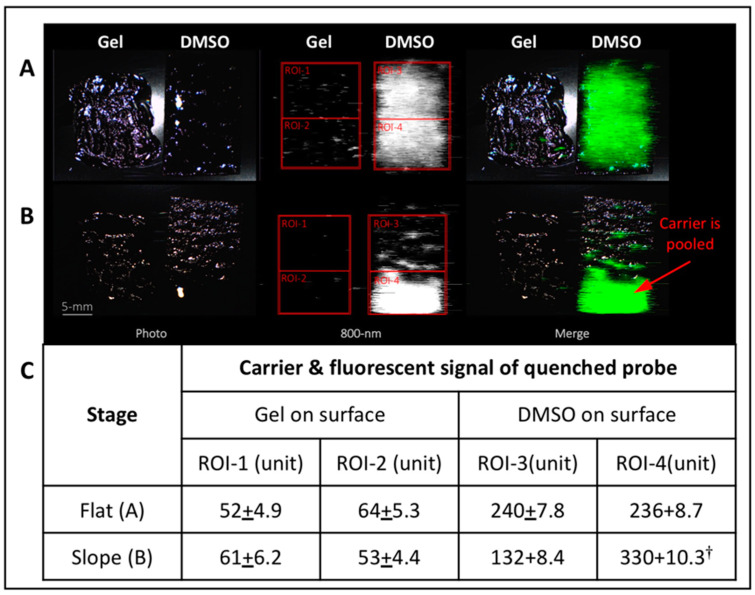
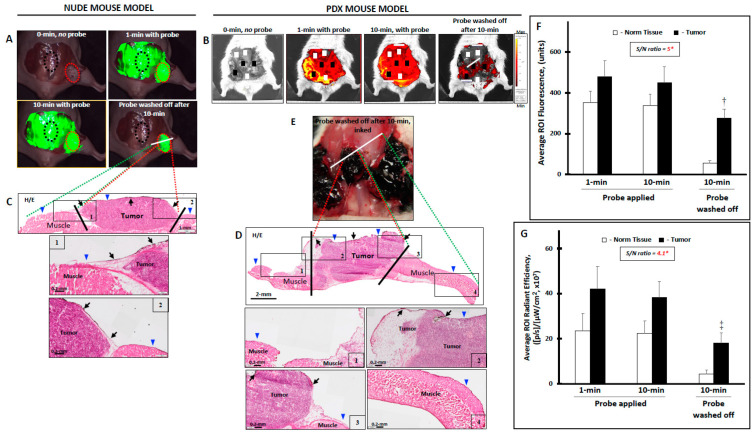
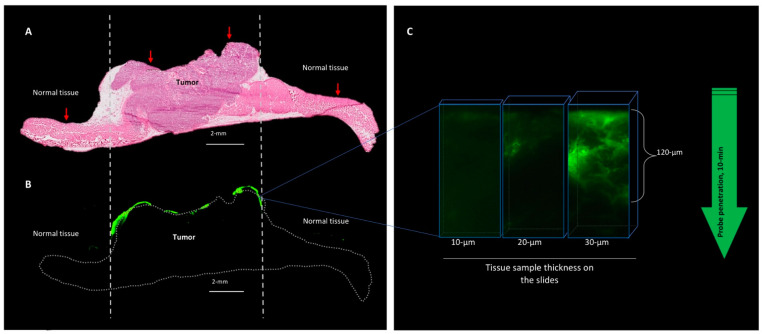
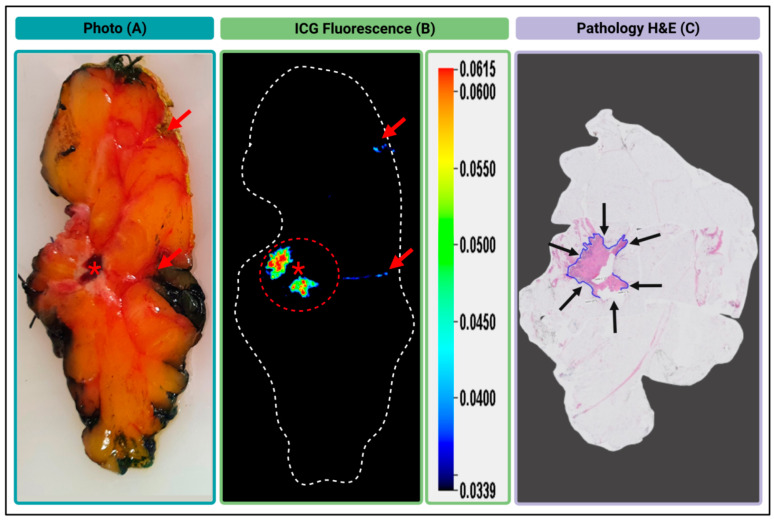
Results: More than forty formulations of gel mixtures were investigated to enable easy fluid application and subsequent solidification once applied, preventing dripping and pooling in the surgical cavity. The final formulation was tested using human BCa orthotopic implants in nude and NSG patient-derived xenografts (PDX) mice. This formulation of Pluronic F-127/DMSO/AKRO-QC-ICG imaging gel was found to be a good solvent for the probe, with a desirable thermo-reversible solid-gel transition and mechanical strength for distribution of AKRO-QC-ICG on the surfaces of tissue. It demonstrated excellent ability to detect BCa tissue after 10 min exposure, with a high signal-to-noise ratio both in mouse xenografts and freshly excised human lumpectomy tissue. The in vivo efficacy of the AKRO-QC-ICG imaging gel to detect BCa revealed the levels of sensitivity/specificity = 0.92/1 in 12 nude mice, which was corroborated with the sensitivity/specificity = 0.94/1 in 10 PDX mice.

Conclusions: Utilization of Pluronic F-127/DMSO/AKRO-QC-ICG imaging gel for topical application to detect BCa in the surgical cavity during surgery has the potential to reduce re-excisions, with consequent savings in healthcare costs and enhancement in patient quality of life.

Keywords: human breast cancer; optical imaging; surgical cavity; tumor margins.


Conflict of interest statement

Matthew Bogyo and James Basilion are co-founders, and Brian Straight is the CEO of Akrotome Imaging, Inc. (Cleveland, OH, USA) No potential conflicts of interest are disclosed by the other authors.

Figures

Figure 1
Figure 1
AKRO-QC-ICG accumulates in lysosomes and becomes fluorescent in the human BCa cells in vitro. Representative live cell fluorescence microscopy images of the human breast MDA-MB-486 cancer cell monolayer incubated for 30 min with 1 μM of quenched substrates followed by washout. ICG fluorescence of probe is false-colored red, lysotracker (lysosome selective stain) is false colored green, blue is DAPI (nuclear stain), and yellow/orange corresponds to lysosome/ICG co-localization. Magnification—100× with immersion (Leica-DM4000B). Scale bar—10 μm.
Figure 2
Figure 2
Human BCa cell lysate initiates specific fluorescence imaging of AKRO-QC-ICG probe in vitro. (A)—Time course of ICG fluorescence imaging of cancer-cell-associated cysteine cathepsins (lysate) mixed with substrate (AKRO-QC-ICG). Tecan fluorescent scanner was used to assess ICG fluorescence in 4 wells per sample for different mixes, probe alone, or buffer alone (100 μL per well, 96-well black flat bottom plate) in three experiments. Irreversible cysteine protease inhibitor K777 was used as a control for specificity of fluorescence. Vertical bars—SD. (B)—Representative sample of ICG FL in AKRO-QC-ICG/MDA-MB-468 cancer cell lysate mixes after 10 min incubation. Data presented as mean fluorescence ± SD in 3 wells per sample. Number of wells corresponds to the number of samples tested in (A). Quantification of well signal in arbitrary units after 10 min of incubation is presented to the right of each well. Imaging of lysate spots was performed using the Curadel Lab-Flare RP1 with 800 nm filter set and Curadel Resvet Imaging software. Notes: (1) the levels of fluorescence of all lysates without inhibitor were significantly higher as compared to controls (wells #4–#6) in (A); *—p < 0.05, **—p < 0.01 compared to controls (wells #4–#6) in (B) by Student’s t-test in three independent experiments both for (A) and (B)).
Figure 3
Figure 3
Thermo-sensitive Pluronic F-127 hydro-gel#30 possesses better carrier characteristics for “no drip” topical applications of AKRO-QC-ICG imaging probe under force of gravity. Analysis of behavior of carriers of the AKRO-QC-ICG imaging probe. Both AKRO-QC-ICG (final 5 μM) dissolved in 50 μL of Pluronic F-127 hydro-gel#30 and a paper applicator impregnated with AKRO-QC-ICG (final 5 μM in 50 μL of DMSO) were topically applied to a plastic surface that was pre-heated at 37 °C. (A)—Distribution of the AKRO-QC-ICG in the carriers on the flat surface. (B)—Distribution of the AKRO-QC-ICG in the carriers on the surface with a 30 degree slope after 1 min. Scale bar 5 mm. (C)—Analysis of the levels of auto-fluorescence of AKRO-QC-ICG at the upper and bottom quadrant of the applied carrier in the regions of interest (ROIs). Data were normalized to background. Notes: †—p < 0.05 compared to ROI-3 in (B) with slope (Student’s t-test in three independent experiments). Imaging and analysis—Lab-FLARE® imaging system with 800 nm filter set and Resvet Imaging software (both Curadel, LLC, Natick, MA, USA). It should be noted that the lower concentration of probe used here is quenched by gel formulation, but not when formulated in 100% DMSO. Quantitation of signal reveals lack of probe movement when formulated using gel#30.
Figure 4
Figure 4
Topical application of AKRO-QC-ICG imaging Pluronic F-127 hydro-gel#30 visualizes and helps to demarcate the human BCa tissue from normal mouse tissue in vivo. (A)—The levels of ICG fluorescence in the surgical cavity of athymic nude mouse with MDA-MB-468 human breast cancer cell xenograft. Tip of the tumor xenograft (up to 40% of visible tumor) was cut off, bleeding was cauterized, and AKRO-QC-ICG imaging hydro-gel#30 (AKRO-QC-ICG = 50 μM final) was topically applied onto all surfaces of the abdominal muscle wall along with tumor xenografts. After 10 min of incubation, the imaging gel was washed away with sterile saline from everywhere, including tumor, and surgical cavity was imaged. Based on this 10 min image, only high fluorescent zones were inked by a black pathological ink. White line—plane of section. (B)—The levels of ICG fluorescence in the surgical cavity of NSG PDX mouse with xenografts that were grown from the human breast cancer cells isolated from patient TM00098. Tips of the tumor xenografts (up to 40% of visible tumor) were cut off, bleeding was cauterized, and AKRO-QC-ICG imaging hydro-gel#30 (AKRO-QC-ICG = 50 μM final) was topically applied onto all surfaces of the abdominal muscle wall along with tumor xenografts. After 10 min of incubation, the imaging gel was washed away with sterile saline from everywhere, including tumor, and surgical cavity was imaged. Based on this 10 min image, only high fluorescent zones were inked by a black pathological ink. White line—plane of section. (C)—Bread-loaf section and H&E histology of (A); blue triangles indicate the surface where the imaging gel was applied. Inserts-1 and -2 show borders between normal tissue and cancer (bottom—with high magnification). Black arrows—ink in the tumor zone. Black lines demarcate the cancer zone border. (D)—Pathology ink on the tumor surfaces of the surgical cavity that was used to mark the areas of high ICG-fluorescence in (B). (E)—Bread-loaf section and H&E histology of (B), blue triangles indicate the surface where the probe was applied. Inserts-1 and -4 (upper panel) show normal tissue and inserts-2 and -3 show borders between normal tissue and cancer (bottom panel—with high magnification). Black arrows—ink in the tumor zone. Black lines demarcate the cancer zone border. (F)—The average levels of fluorescence in the ROIs of the tumor (red dotted circles) and normal (black dotted circles) tissue as represented in the surgical cavity in (A) for all athymic nude mice, n = 12. (G)—The average levels of fluorescence in the ROIs of the tumor (black squares) and normal (white squares) tissue as represented in the surgical cavity in (B) for all NSG PDX mice, n = 10. Notes: (1) *—normalized to 0 min pre-image = background; (2) †—p < 0.001 to normal tissue at 10 min (n = 12), when the imaging gel was washed off in (F); ‡—p < 0.005 to normal tissue at 10 min (n = 10), when the imaging gel was washed off in (G) by Student’s t-test; 3) Vertical bars—SD; 4) cameras: Curadel Lab-Flare RP1 and Curadel Resvet software in athymic nude mice and IVIS® Spectrum in vivo imaging system and software in NSG PDX mice.
Figure 5
Figure 5
After topical application, AKRO-QC-ICG probe penetrates tissue to the depth of a few cancer cells. (A)—H/E histology of the PDX cancer xenograft with surrounding normal tissue (abdominal wall muscles). Vertical dotted lines indicate tumor borders. (B)—Fluorescent scan of consecutive tissue slide represents AKRO-QC-ICG-induced fluorescence (false green color), indicating that the probe was activated only at the area of the fresh cut surface of the tumor without a tendency to spread to surrounding tissues. Dotted line—contour of the sample. (C)—Fluorescent microscopy consecutive tissue sections of different thickness indicate that AKRO-QC-ICG penetrates from the surface (where it was applied) to a depth of up to 120 μm in 10 min. Thicker tissue sections were required to visualize probe fluorescence in tissue, avoiding the need for inking fluorescence prior to tissue preparation. For these studies, mice were treated with AKRO-QC-ICG imaging gel#30 and imaged as in Figure 3. Next, tissue was snap frozen and consecutive slides were sliced for routine histology, fluorescent scan (Odyssey CLx, resolution = 24 μm, 800 nm filter set, Li-Cor) in (B) and microscopy (Leica, NIR filter set) in (C). Vertical red arrows indicate the surface of application and direction of future penetration of the probe in (A).
Figure 6
Figure 6
Ex vivo fluorescent imaging of the human BCa lumpectomy tissue sample. (A)—Color photo of the surface of the fresh cut of the human lumpectomy sample. Red asterisk indicates a blood clot. (B)—Image of 6QC-induced cathepsin-dependent ICG-fluorescence of the sample surface after topical application of AKRO-QC-ICG imaging gel (800 nm). The red dotted circle shows a high fluorescent ICG signal that corresponds to the tumor region of the sample. (C)—H&E histology of the sample at low magnification. Blue line and black arrows represent the tumor area. Notes: red arrows indicate spots of the yellow pathological ink in (A) and non-specific fluorescence in (B) on the surface and edge of the sample. Imaging—Pearl Trilogy Imaging System.
Figure 7
Figure 7
The scheme of the approach proposed for topical application of AKRO-QC-ICG imaging gel into the surgical cavity to detect missed cancerous tissue.

References

    1. American Cancer Society Breast Cancer Facts & Figures 2022. [(accessed on 11 July 2022)]. Available online: https://www.cancer.org/research/cancer-facts-statistics/all-cancer-facts....
    1. American Cancer Society Breast Cancer Facts and Figures 2019–2020. [(accessed on 11 July 2022)]. Available online: https://www.cancer.org/research/cancer-facts-statistics/all-cancer-facts....
    1. Gomes D.C., Farshid G. Change of blue ink margin colour to black in immunohistochemistry stained slides: A potential pitfall for pathology cancer margin assessment. Pathology. 2021;53:558–559. doi: 10.1016/j.pathol.2020.08.025. - DOI - PubMed
    1. Moran M.S., Schnitt S.J., Giuliano A.E., Harris J.R., Khan S.A., Horton J., Klimberg S., Chavez-MacGregor M., Freedman G., Houssami N., et al. Society of Surgical Oncology-American Society for Radiation Oncology consensus guideline on margins for breast-conserving surgery with whole-breast irradiation in stages I and II invasive breast cancer. Ann. Surg. Oncol. 2014;21:704–716. doi: 10.1245/s10434-014-3481-4. - DOI - PubMed
    1. Jeevan R., Cromwell D.A., Trivella M., Lawrence G., Kearins O., Pereira J., Sheppard C., Caddy C.M., van der Meulen J.H. Reoperation rates after breast conserving surgery for breast cancer among women in England: Retrospective study of hospital episode statistics. BMJ. 2012;345:e4505. doi: 10.1136/bmj.e4505. - DOI - PMC - PubMed

LinkOut - more resources