. 2022 Jul 19;14(14):3506.
doi: 10.3390/cancers14143506.

Multi-Targeting Approach in Glioblastoma Using Computer-Assisted Drug Discovery Tools to Overcome the Blood-Brain Barrier and Target EGFR/PI3Kp110β Signaling

Affiliations

Multi-Targeting Approach in Glioblastoma Using Computer-Assisted Drug Discovery Tools to Overcome the Blood-Brain Barrier and Target EGFR/PI3Kp110β Signaling

Catarina Franco et al. Cancers (Basel). .

Abstract

The epidermal growth factor receptor (EGFR) is upregulated in glioblastoma, becoming an attractive therapeutic target. However, activation of compensatory pathways generates inputs to downstream PI3Kp110β signaling, leading to anti-EGFR therapeutic resistance. Moreover, the blood-brain barrier (BBB) limits drugs' brain penetration. We aimed to discover EGFR/PI3Kp110β pathway inhibitors for a multi-targeting approach, with favorable ADMET and BBB-permeant properties. We used quantitative structure-activity relationship models and structure-based virtual screening, and assessed ADMET properties, to identify BBB-permeant drug candidates. Predictions were validated in in vitro models of the human BBB and BBB-glioma co-cultures. The results disclosed 27 molecules (18 EGFR, 6 PI3Kp110β, and 3 dual inhibitors) for biological validation, performed in two glioblastoma cell lines (U87MG and U87MG overexpressing EGFR). Six molecules (two EGFR, two PI3Kp110β, and two dual inhibitors) decreased cell viability by 40-99%, with the greatest effect observed for the dual inhibitors. The glioma cytotoxicity was confirmed by analysis of targets' downregulation and increased apoptosis (15-85%). Safety to BBB endothelial cells was confirmed for three of those molecules (one EGFR and two PI3Kp110β inhibitors). These molecules crossed the endothelial monolayer in the BBB in vitro model and in the BBB-glioblastoma co-culture system. These results revealed novel drug candidates for glioblastoma treatment.

Keywords: blood–brain barrier; dual-targeting; epidermal growth factor receptor; glioblastoma; phosphatidylinositol-3-kinase; quantitative structure–activity relationship models; virtual screening.


Conflict of interest statement

The authors declare no conflict of interest. The funders had no role in the design of the study; in the collection, analyses, or interpretation of data; in the writing of the manuscript, or in the decision to publish the results.

Figures

Figure 1
Figure 1
QSAR model building pipeline. KNIME automated framework for model building embeds all tools necessary to perform the entirely QSAR life cycle. The workflow was built to automatically access and process fetched molecular data for a given target or problem, calculate descriptors and fingerprints, select optimized set of features by using an enhanced random forest (RF) methodology, and follow an unbiased protocol for QSAR models’ internal and external validation using reliable machine learning algorithms, as the support vector machine (SVM). IVS, independent validation set; MSE, mean square error.
Figure 2
Figure 2
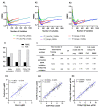
QSAR models building and validation: (A) The root mean square error (RMSE) delivered by models’ internal validation using each fingerprint (FP) type (Atompair and Morgan) and bit sizes (256, 512, or 1024) were compared between N-models developed by sequentially adding variables ranked according their importance score for each chemical problem, (A1) BBB’s permeation, (A2) EGFR inhibition, and (A3) PI3Kp110β inhibition. (B) Predictive performance assessment of externally validated final SF-models by respective RMSE and proportion of variance explained (PVE). (C) Comparison of the performance of externally validated final SF-models with full QSAR models (without feature selection (FS)) in predicting activity values of independent validation set (IVS). (D) Comparison of real values and predicted values of IVS by externally validated final SF-models for (D1) BBB’s permeation, (D2) EGFR inhibition, and (D3) PI3Kp110β inhibition. Correlation coefficients r2 were obtained by linear regression statistical analysis.
Figure 3
Figure 3
ZINC15 screening output. Each graphic was obtained by plotting the top thousand screened molecules for (A) EGFR inhibition, (B) PI3Kp110β inhibition, and (C) dual targeting. Orange lines mark the specified threshold for acceptable LogBB values and only hits from shaded area were selected.
Figure 4
Figure 4
Selection and validation of unbiased molecular docking protocol: (A) Identification of most-fitted score function and crystallographic structure for each protein system by (A1) self-docking (plotted by red lined boxes) and (A2) cross-docking simulations (plotted by blue lined boxes), respectively. Heat maps are representative of RMSD values (in Angstrom) between the best-scoring docked pose and the co-crystallized ligand for each available crystallography, where each row represents a ligand and the columns the scoring functions for each tested software, MOE and GOLD. Grey boxes at left in (A2) represent the crystal structure used for each row ligand docking. (B) Protein–ligand interactions analysis. Ribbon representation of final (B1) EGFR (3w2s) and (B2) PI3Kp110β (4bfr) 3D structures with close-up view of the relevant binding residues using cartoon visualization of representative alignment of docked ligand (red) and crystallographic ligand (blue) from self-docking. (C) Validation of selected 3D models and docking protocols by correlation analysis between experimental values of standard molecules -pIC50 and (C1) GOLD CHEMPLP score for EGFR 3w2s 3D-model and (C2) MOE Alpha HB score for PI3Kp110β 4bfr 3D-model. Correlation coefficients r2 were obtained by linear regression statistical analysis.
Figure 5
Figure 5
Drug-response curves delivered low-range EC50 values for the six most promising molecules. U87MG and U87MG-wtEGFR cells were incubated for 24 h with 10 different concentrations (0.01–120 µM) of each selected drug (8, 17, 19, 20, 25, and 27), or vehicle (control). Cell viability was assessed by MTT assay, and the values are presented as percentage relative to control. All experimental values are means ± SEM and were obtained from three independent experiments performed in triplicate.
Figure 6
Figure 6
EGFR inhibitors lead to decreased phospho-EGFR expression and increased glioma cell apoptosis. U87MG cells were grown on coverslips for 48 h and then incubated with molecule (Mol) 8 or 17 at EC50, or vehicle (control; Ctr): (A) Immunostaining for phospho-EGFR and nuclei labeling with Hoechst 33342 were performed at different time-points. Images are representative of three independent experiments each with 10 random fields analyzed. (B) Semi-quantitative analysis of phospho-EGFR expression along time per cell. (C) Analysis of the percentage of apoptotic cells. Arrows in (A) point to cells that presented characteristic morphological changes of apoptosis such as condensation of chromatin and nuclear fragmentation. Data presented in (B,C) are means ± SEM of three independent experiments each with 10 random fields analyzed. Statistical analysis was performed by one-way ANOVA with Tukey correction. *** p < 0.001 vs. control of each time-point; # p < 0.05, ## p < 0.01, ### p < 0.001 between indicated groups.
Figure 7
Figure 7
PI3Kp110β inhibitor candidates lead to decreased phospho-AKT expression and increased glioma cell apoptosis. U87MG cells were grown on coverslips for 48 h and then incubated with molecule (Mol) 19 or 20 at EC50, or vehicle (control; Ctr): (A) Immunostaining for phospho-AKT and nuclei labeling with Hoechst 33342 were performed at different time-points. Images are representative of three independent experiments each with 10 random fields analyzed. (B) Semi-quantitative analysis of phospho-AKT expression along time per cell. (C) Analysis of the percentage of apoptotic cells. White arrows in (A) point to cells presenting characteristic morphological changes of apoptosis such as condensation of chromatin and nuclear fragmentations, whereas red arrows point to necrotic-like areas with consistent nuclear lysis. Data presented in (B,C) are means ± SEM of three independent experiments, each with 10 random fields analyzed. Statistical analysis was performed by one-way ANOVA with Tukey correction. * p < 0.05, *** p < 0.001 vs. control of each time-point; # p < 0.05, ## p < 0.01, ### p < 0.001 between indicated groups.
Figure 8
Figure 8
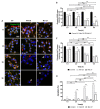
Dual targeting candidates lead to decreased phospho-EGFR and -AKT expression and increased glioma cell apoptosis. U87MG cells were grown on coverslips for 48 h and then incubated with molecule (Mol) 25 or 27 at EC50, or vehicle (control; Ctr): (A) Double immunostaining for phospho-EGFR and phospho-AKT were performed at different time points. Nuclei were counterstained with Hoechst 33342. Images are representative of three independent experiments each with 10 random fields analyzed: (B) Semi-quantitative analysis of phospho-EGFR expression along time per cell. (C) Semi-quantitative analysis of phospho-AKT expression along time per cell. (D) Analysis of the percentage of apoptotic cells. White arrows in (A) point to cells presenting characteristic morphological changes of apoptosis such as condensation of chromatin and nuclear fragmentations, whereas red arrows point to necrotic-like areas with consistent nuclear lysis. Data presented in (BD) are means ± SEM of three independent experiments, each with 10 random fields analyzed. Statistical analysis was performed by one-way ANOVA with Tukey correction. * p < 0.05, ** p < 0.01, *** p < 0.001, vs. control of each time-point; # p < 0.05, ## p < 0.01, ### p < 0.001 between indicated groups.
Figure 9
Figure 9
HBMEC treatment with selected molecules proved lack of cytotoxicity for 3 candidates. HBMEC were exposed to each of the selected molecules (8, 17, 19, 20, 25, and 27), or no addition (control; Ctr), at a concentration of 100 µM, for 24 h, for viability assays (A), or at U87MG EC50, during 9 h, for BBB integrity (B) or cytoskeleton (C) analyses. (A) Cell viability was assessed by MTT assay and the values are presented as a percentage relative to control. Molecules with significant cytotoxic effects are presented as pattern-filled bars, and innocuous molecules are shown as white bars. (B) BBB integrity was assessed by immunostaining of β-catenin, with nuclear counterstaining by Hoechst 33342. (B1) Arrows point to gaps in the HBMEC monolayer caused by incubation with toxic molecules. (B2) Semi-quantitative analysis of endothelial gaps, where values are presented as percentage of control. (B3) 3D representative plots of β-catenin expression obtained by counting the number of image pixels per area in disrupted monolayers. (B4) Semi-quantitative analysis of β-catenin internalization by fold-change of mean image pixels (Px) in the membrane and interior of treated cells vs. control. (B5) Morphological analysis of HBMEC roundness by cells delineation. (C) Cytoskeleton analysis was performed based on F-actin labeling. (C1) Arrows highlight the presence of stress fibers. (C2) Cytoskeleton stress fibers profile per cell representation by semi-quantitative analysis of gray values expressed along ferret diameter of each cell. Images are representative of three independent experiments each with 10 random fields analyzed. All values in (A) are means ± SEM of three independent experiments performed in triplicates. Semi-quantitative analyses shown in (B) are means ± SEM of three independent experiments. Statistical analysis was performed by one-way ANOVA with Tukey correction. * p < 0.05, ** p < 0.01, *** p < 0.001 vs. control; ### p < 0.001 between indicated groups.
Figure 10
Figure 10
Selected molecules proved to efficiently cross the BBB. (A) HBMEC were grown to confluence in Transwell inserts and then incubated with molecules 8, 19, or 20 at U87MG EC50, or vehicle (control; Ctr), for 30 or 120 min. After that, (B) inserts were removed and tested for barrier integrity, and (C) cell medium from upper and lower chambers were collected and analyzed by UPLC-MS/MS to assess molecule permeation across HBMEC. (A1) Schematic view of the two-chamber BBB model and (A2) molecular structure of the candidates tested for BBB permeation. (B1) BBB integrity was assessed by TEER measurement. (B2) Representative immunostaining for HBMEC expression of ZO-1 and vimentin, junctional, and cytoskeleton proteins, respectively. (B3) Quantitative analysis of the permeability to SF (SF Pe) across HBMEC in the Transwell system. (C) Total Ion Chromatograms (TIC) of MRM analyses obtained by UPLC-MS/MS. Quantification was based on the integration (peak areas) of the represented well-resolved peaks with reproducible retention times, both in upper and lower compartments at (C1) 30 min and (C2) 120 min of incubation with molecule 8, 19, or 20. (C3) Transport efficiency quantification is expressed as a percentage of initial applied concentration. (D) Linear correlation between predicted and experimentally validated values of LogBB, expressing the degree of BBB permeation. Statistical analysis was performed by one-way ANOVA with Tukey correction. Data presented in (B) are means ± SEM of six independent experiments and in (C) of three independent experiments. * p < 0.05 vs. control; # p < 0.05, ## p < 0.01, ### p < 0.001 between indicated groups. Correlation coefficients r2 (D) were obtained by linear regression statistical analysis.
Figure 11
Figure 11
A reliable co-culture system corroborated candidate molecules as BBB permeable and strong anti-GB agents: (A) HBMEC were grown to confluence in Transwell inserts and U87MG or U87MG-wtEGFR cells were seeded in the lower chamber. After 3 days of co-culture, supernatant in the upper chamber was replaced with fresh medium (control) or with medium supplemented with molecules 8, 19, or 20 at EC50. After 2 h, the inserts were removed and tested for barrier integrity (BD), whereas the gliomasphere-like cells were maintained in culture for more than 24 h to assess cell viability by MTT assay (E). In parallel, the U87MG or U87MG-wtEGFR cells were incubated for 24 h with the basolateral conditioned medium of HBMEC after incubation with the molecules. (A1) Schematic representation of the BBB-GB co-culture model and (A2) of the conditioned medium assay. (B) Immunostaining for ZO-1 and vimentin in HBMEC mono-culture or co-cultured with U87MG or U87MG-wtEGFR. Images are representative of three independent experiments each with 10 random fields analyzed. (C) Semi-quantitative analysis of ZO-1 expression in HBMEC cells mono-cultured vs. co-cultured with U87MG or U87MG-wtEGFR by mean fluorescence intensity fold-change. (D) TEER of HBMEC after 2 h of incubation with the molecules both in mono- or co-culture system. (E) U87MG or U87MG-wtEGFR cell viability assessment by MTT assay after molecules exposure either in co-culture system or by conditioned medium. Data presented in (C,E) are means ± SEM of three independent experiments each with 10 random fields analyzed. Values in (D) are means ± SEM of three independent experiments. Statistical analysis was performed by one-way ANOVA with Tukey correction. * p < 0.05, ** p < 0.01, *** p < 0.001; # p < 0.05 between indicated groups.

References

    1. Branco V., Pimentel J., Brito M.A., Carvalho C. Thioredoxin, glutathione and related molecules in tumors of the nervous system. Curr. Med. Chem. 2020;27:1878–1900. doi: 10.2174/0929867326666190201113004. - DOI - PubMed
    1. Louis D.N., Perry A., Reifenberger G., von Deimling A., Figarella-Branger D., Cavenee W.K., Ohgaki H., Wiestler O.D., Kleihues P., Ellison D.W. The 2016 world health organization classification of tumors of the central nervous system: A summary. Acta Neuropathol. 2016;131:803–820. doi: 10.1007/s00401-016-1545-1. - DOI - PubMed
    1. Harder B.G., Blomquist M.R., Wang J., Kim A.J., Woodworth G.F., Winkles J.A., Loftus J.C., Tran N.L. Developments in blood-brain barrier penetrance and drug repurposing for improved treatment of glioblastoma. Front. Oncol. 2018;8:462. doi: 10.3389/fonc.2018.00462. - DOI - PMC - PubMed
    1. Afonso M., Brito M.A. Therapeutic options in neuro-oncology. Int. J. Mol. Sci. 2022;23:5351. doi: 10.3390/ijms23105351. - DOI - PMC - PubMed
    1. Swanson K.D., Charest A., Pollack I.F., Wong E.T. Growth Factor Signaling Pathways and Targeted Therapy. In: Newton H.B., editor. Handbook of Brain Tumor Chemotherapy, Molecular Therapeutics, and Immunotherapy. 2nd ed. Elsevier; Amsterdam, The Netherlands: 2018. pp. 305–322.