. 2022 Jul 20;14(14):3525.
doi: 10.3390/cancers14143525.

Differential Transcriptomic Profiles Following Stimulation with Lipopolysaccharide in Intestinal Organoids from Dogs with Inflammatory Bowel Disease and Intestinal Mast Cell Tumor

Affiliations

Differential Transcriptomic Profiles Following Stimulation with Lipopolysaccharide in Intestinal Organoids from Dogs with Inflammatory Bowel Disease and Intestinal Mast Cell Tumor

Dipak Kumar Sahoo et al. Cancers (Basel). .

Abstract

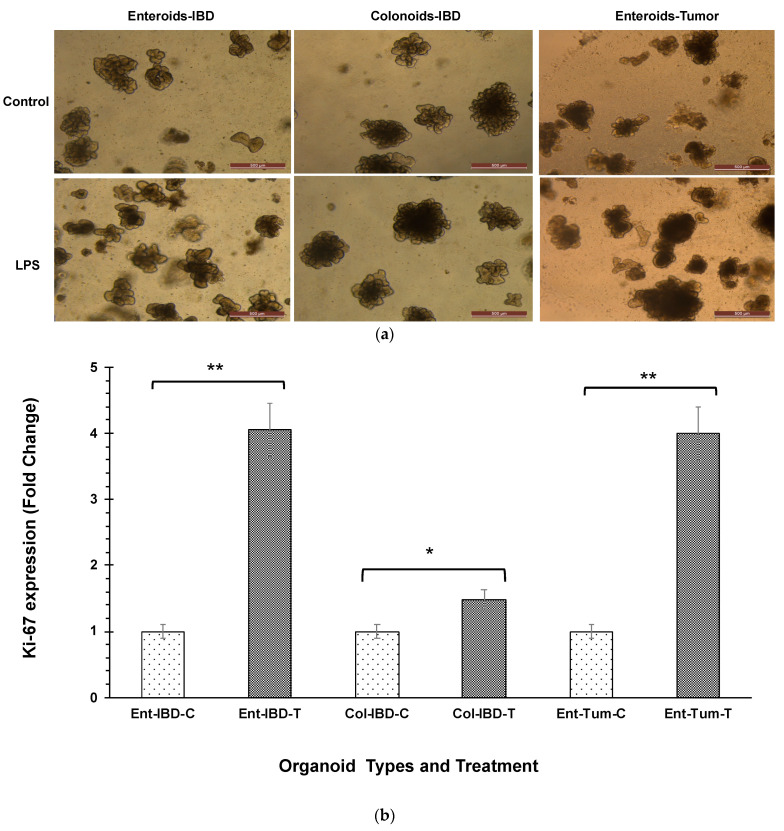
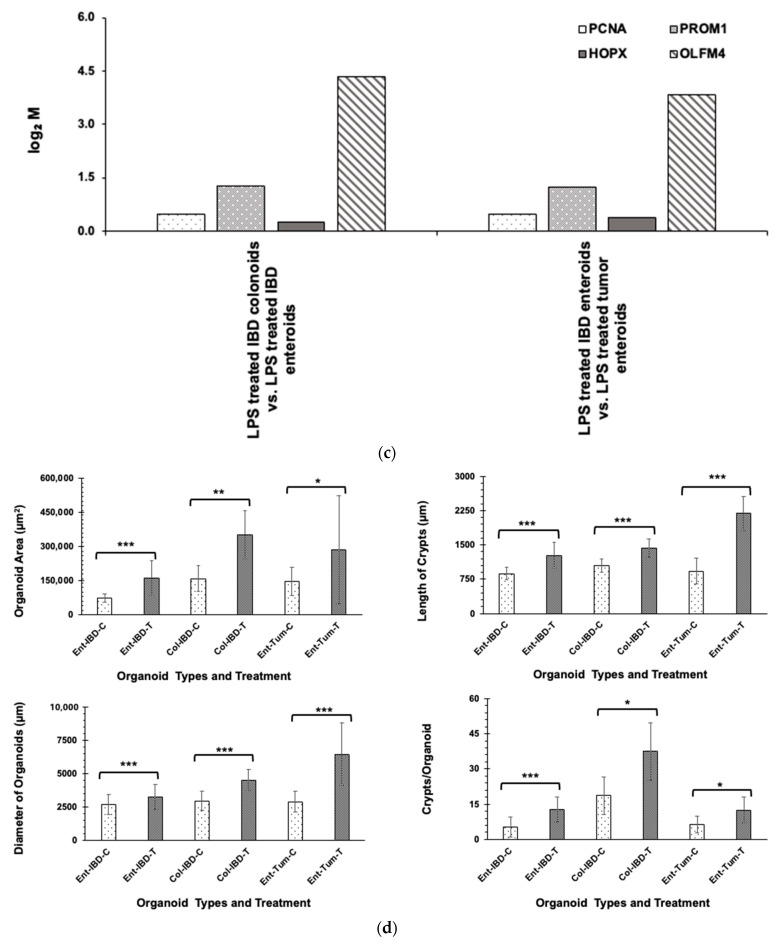
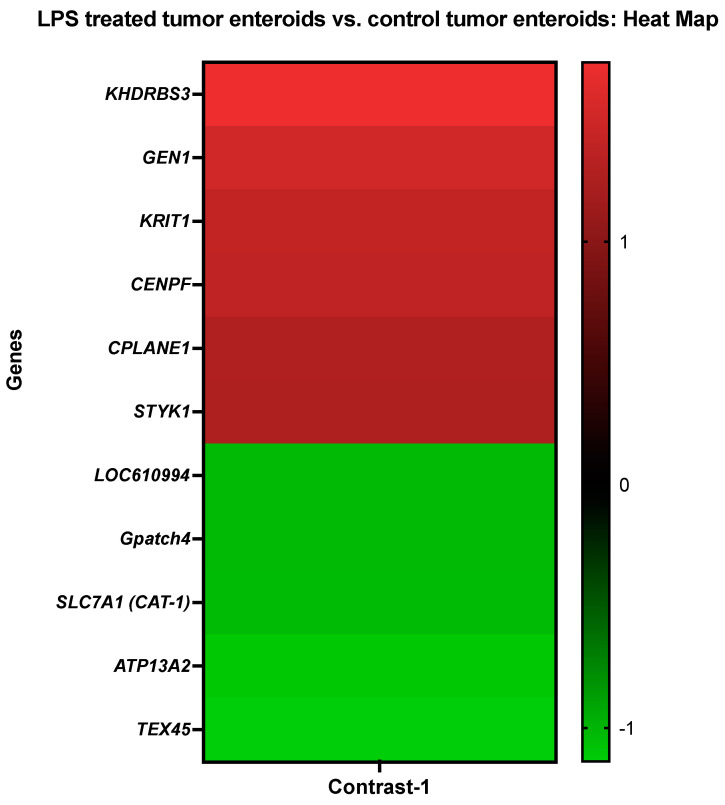
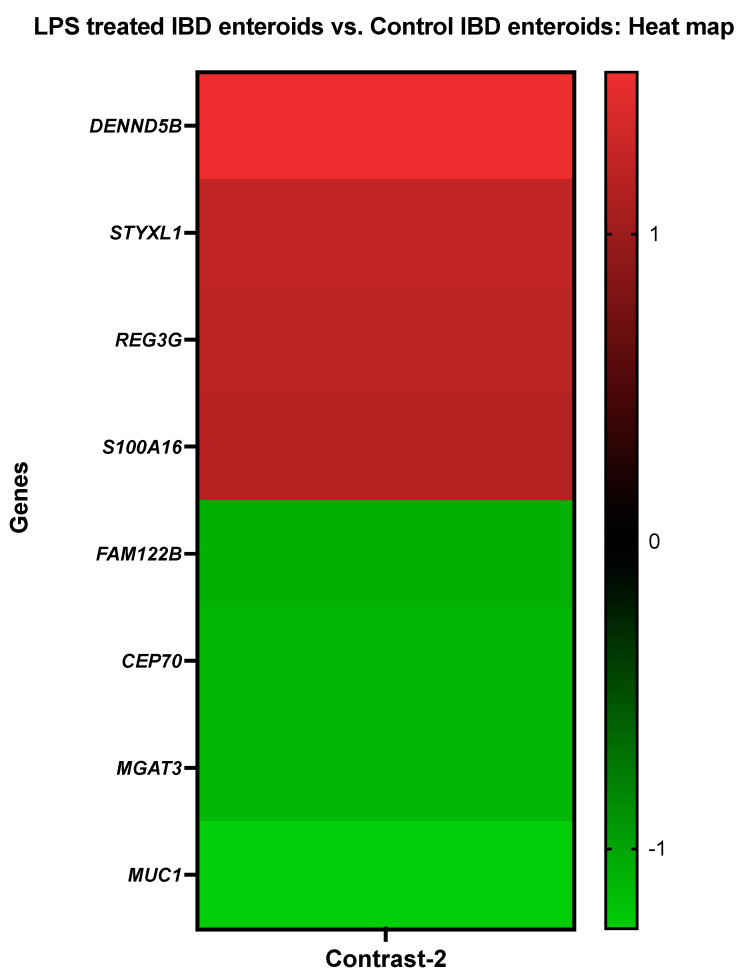
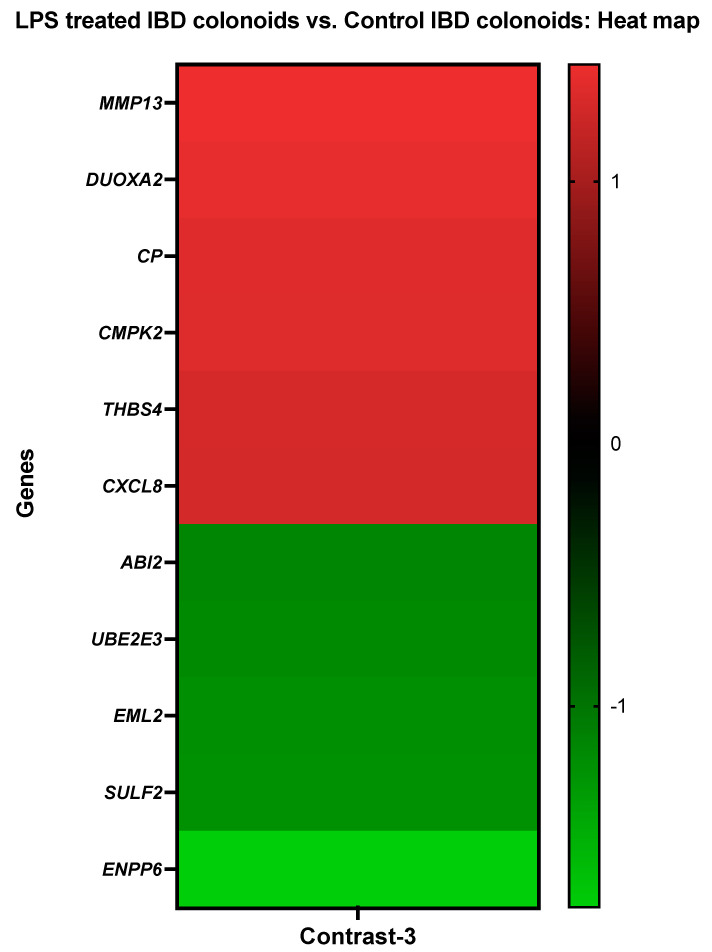
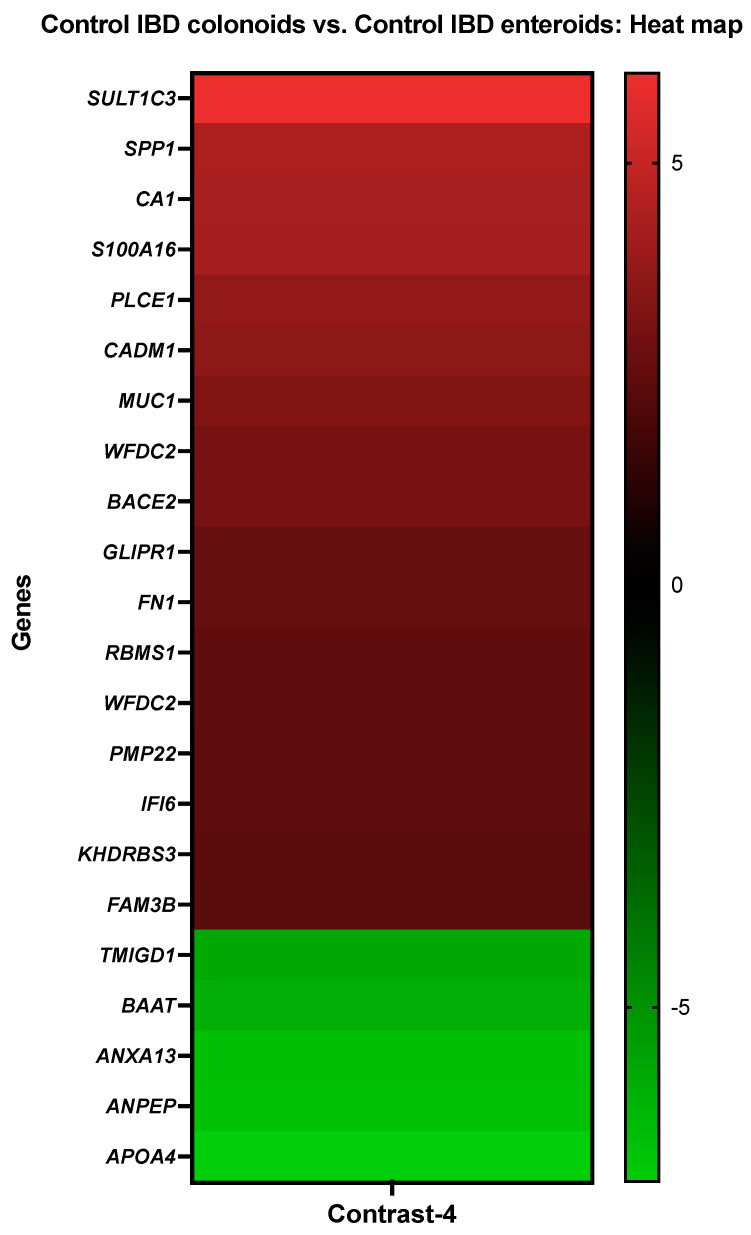
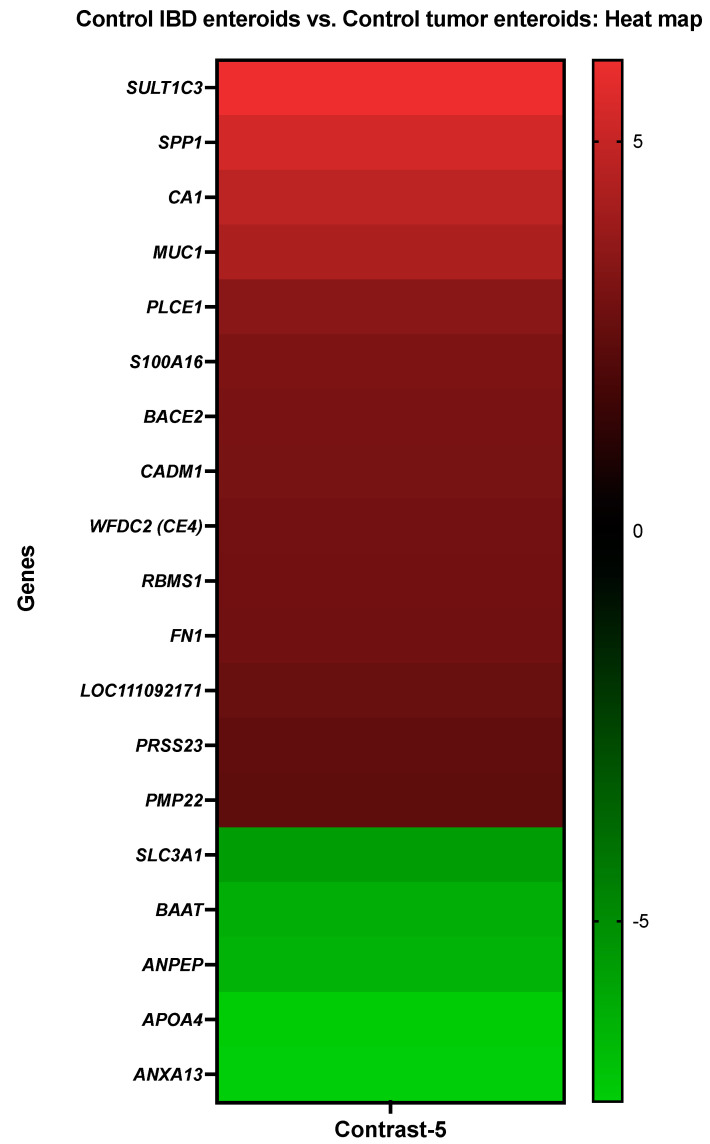
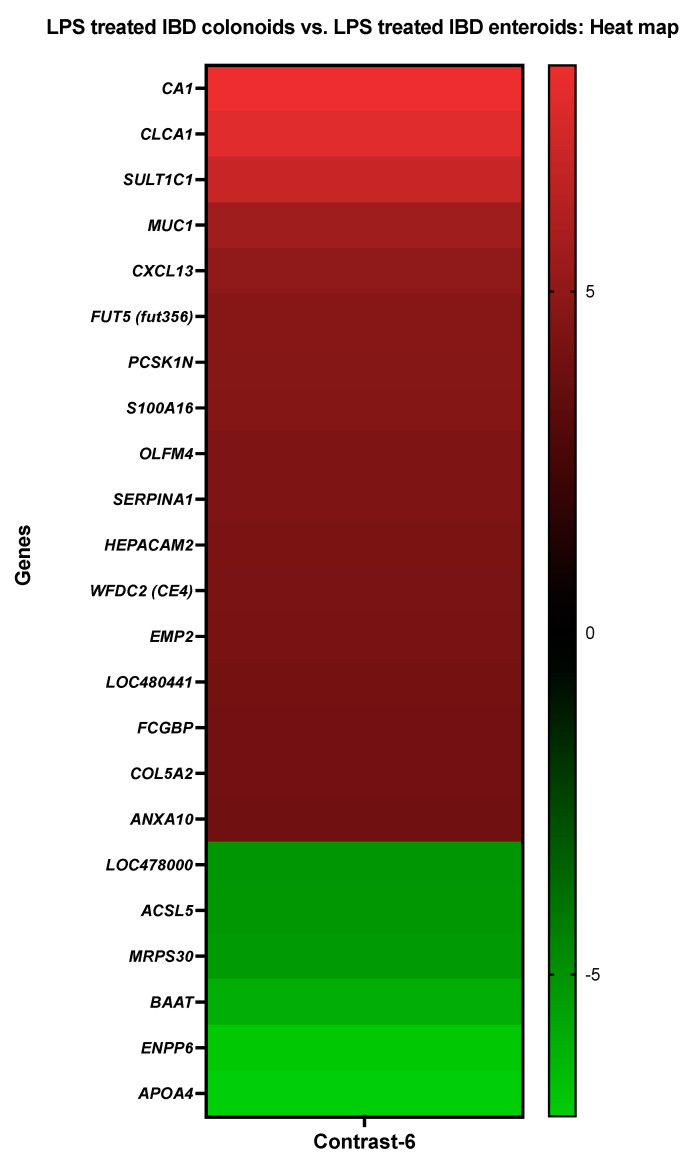
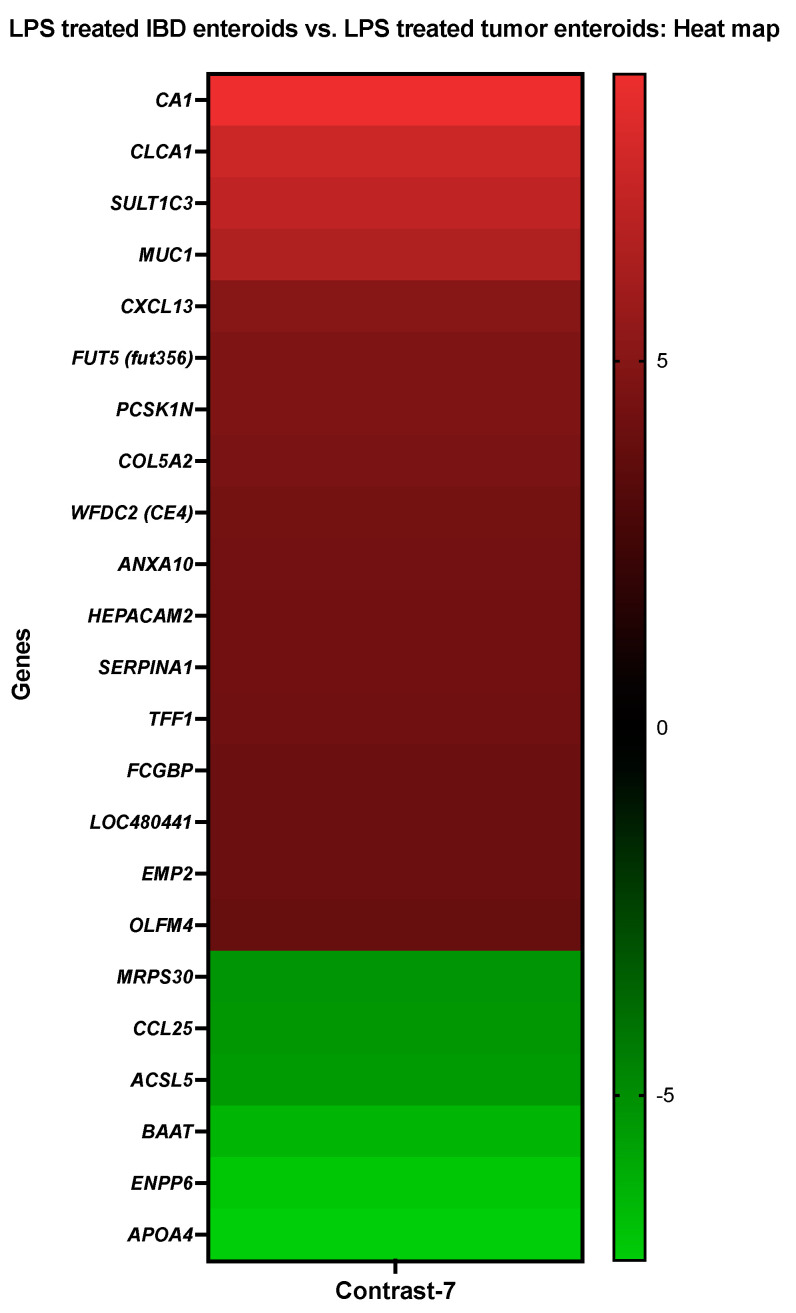
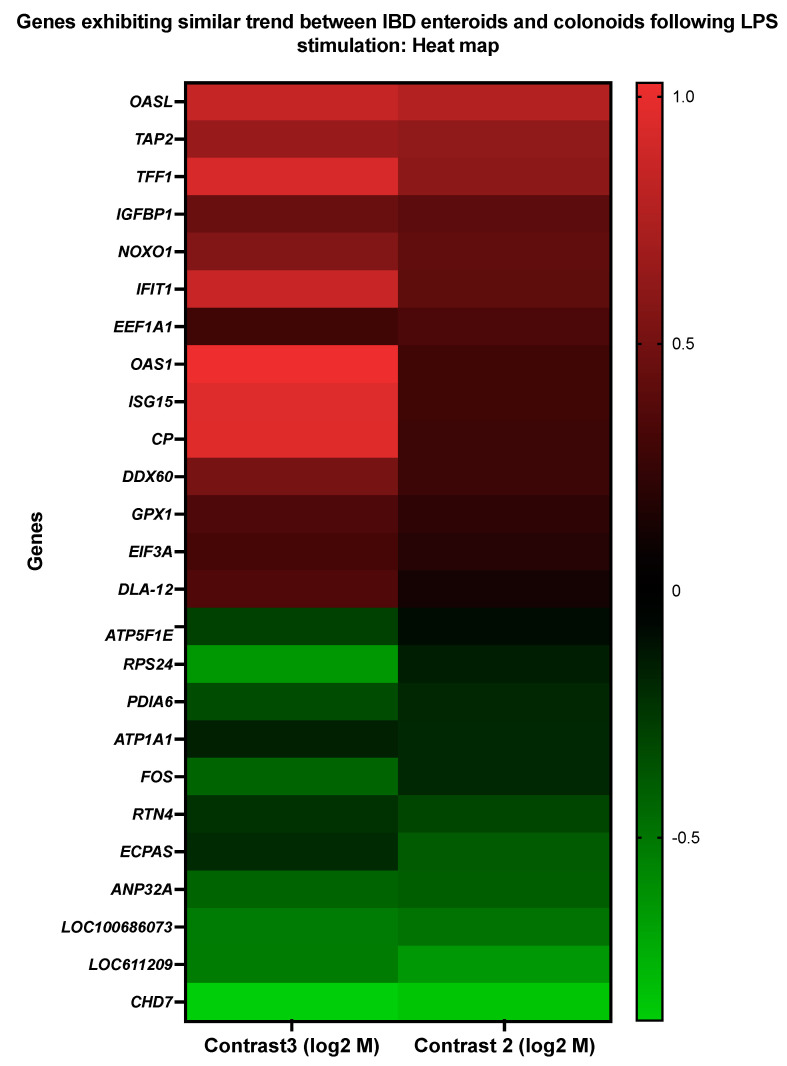
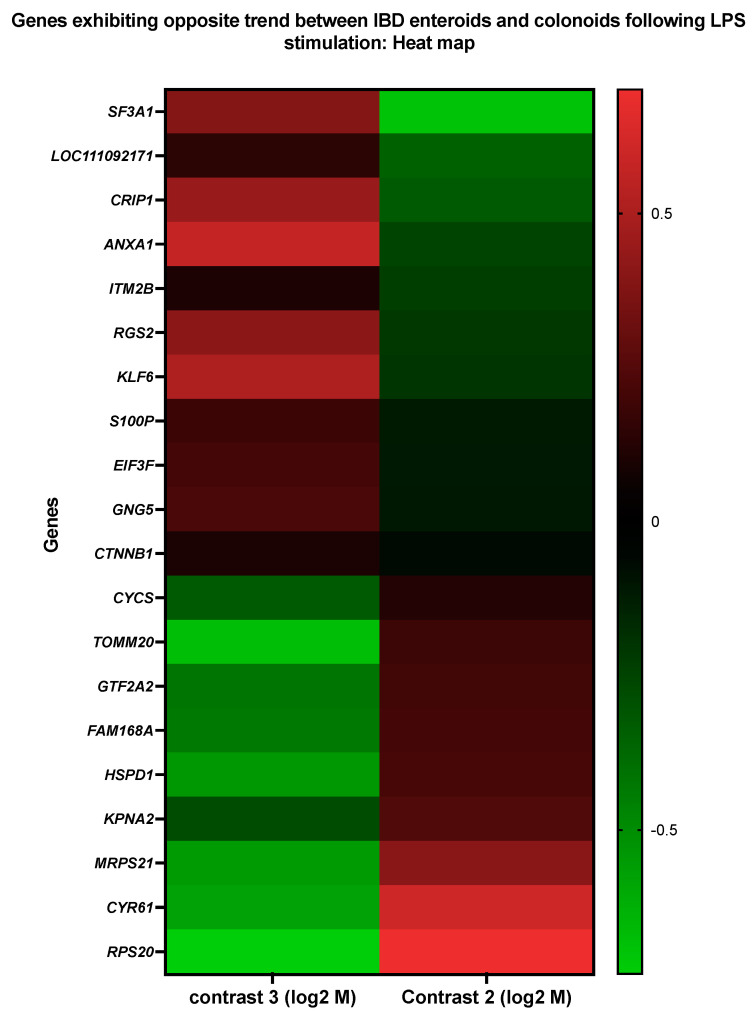
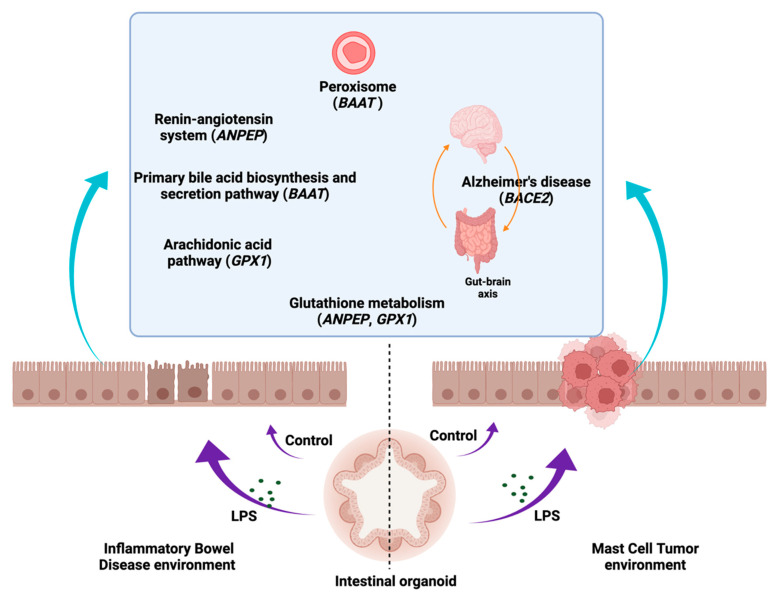
Lipopolysaccharide (LPS) is associated with chronic intestinal inflammation and promotes intestinal cancer progression in the gut. While the interplay between LPS and intestinal immune cells has been well-characterized, little is known about LPS and the intestinal epithelium interactions. In this study, we explored the differential effects of LPS on proliferation and the transcriptome in 3D enteroids/colonoids obtained from dogs with naturally occurring gastrointestinal (GI) diseases including inflammatory bowel disease (IBD) and intestinal mast cell tumor. The study objective was to analyze the LPS-induced modulation of signaling pathways involving the intestinal epithelia and contributing to colorectal cancer development in the context of an inflammatory (IBD) or a tumor microenvironment. While LPS incubation resulted in a pro-cancer gene expression pattern and stimulated proliferation of IBD enteroids and colonoids, downregulation of several cancer-associated genes such as Gpatch4, SLC7A1, ATP13A2, and TEX45 was also observed in tumor enteroids. Genes participating in porphyrin metabolism (CP), nucleocytoplasmic transport (EEF1A1), arachidonic acid, and glutathione metabolism (GPX1) exhibited a similar pattern of altered expression between IBD enteroids and IBD colonoids following LPS stimulation. In contrast, genes involved in anion transport, transcription and translation, apoptotic processes, and regulation of adaptive immune responses showed the opposite expression patterns between IBD enteroids and colonoids following LPS treatment. In brief, the crosstalk between LPS/TLR4 signal transduction pathway and several metabolic pathways such as primary bile acid biosynthesis and secretion, peroxisome, renin-angiotensin system, glutathione metabolism, and arachidonic acid pathways may be important in driving chronic intestinal inflammation and intestinal carcinogenesis.

Keywords: IBD; LPS; canine; colonoids; enteroids; mast cell tumor; microarray.


Conflict of interest statement

The authors declare no conflict of interest.

Figures

Figure 1
Figure 1
LPS stimulates higher proliferation. (a) Enteroids and colonoids from dogs with IBD and intestinal mast cell tumor, 48 h after LPS stimulation. Representative phase-contrast images of enteroids and colonoids after LPS stimulation. The control group received complete growth medium, whereas the LPS group received LPS 5 µg/mL in complete growth medium. (b) Expression of Ki-67 in enteroids and colonoids from dogs with IBD and intestinal mast cell tumor, 48 h after LPS stimulation as measured by qPCR. The control group received complete growth medium, whereas the LPS group received LPS 5 µg/mL in complete growth medium. GAPDH was used to normalize. Ent-IBD-C: control IBD enteroids; Ent-IBD-T: IBD enteroids following LPS stimulation; Col-IBD-C: control IBD colonoids; Col-IBD-T: IBD colonoids following LPS stimulation; Ent-Tum-C: control tumor enteroids; Ent-Tum-T: tumor enteroids following LPS stimulation. Histograms represent the mean Ki-67 expression (fold change) ± SD of four technical replicates used in the qPCR experiment. Unpaired two-tailed Student’s t-test was used for statistical analysis. * p < 0.0005, ** p < 0.00001. (c) Histograms represent induced expression levels (log-ratio M values) of proliferating cell nuclear antigen (PCNA), prominin 1 (PROM1), HOP homeobox (HOPX), and olfactomedin 4 (OLFM4) in LPS treated IBD colonoids vs. LPS treated IBD enteroids (Contrast-6), and LPS treated IBD enteroids vs. LPS treated tumor enteroids (Contrast-7). The log-ratio M values represent log(R/G) (log fold change) [44]. (d) Growth rate of organoids by LPS stimulation was evaluated by surface area and diameter of the organoids, crypt length, and the number of crypts per organoid. Data are presented as mean ± SD. Ent-IBD-C: control IBD enteroids; Ent-IBD-T: IBD enteroids following LPS stimulation; Col-IBD-C: control IBD colonoids; Col-IBD-T: IBD colonoids following LPS stimulation; Ent-Tum-C: control tumor enteroids; Ent-Tum-T: tumor enteroids following LPS stimulation. Unpaired two-tailed Student’s t-test was used for statistical analysis. * p < 0.05, ** p < 0.005, *** p < 0.0005.
Figure 1
Figure 1
LPS stimulates higher proliferation. (a) Enteroids and colonoids from dogs with IBD and intestinal mast cell tumor, 48 h after LPS stimulation. Representative phase-contrast images of enteroids and colonoids after LPS stimulation. The control group received complete growth medium, whereas the LPS group received LPS 5 µg/mL in complete growth medium. (b) Expression of Ki-67 in enteroids and colonoids from dogs with IBD and intestinal mast cell tumor, 48 h after LPS stimulation as measured by qPCR. The control group received complete growth medium, whereas the LPS group received LPS 5 µg/mL in complete growth medium. GAPDH was used to normalize. Ent-IBD-C: control IBD enteroids; Ent-IBD-T: IBD enteroids following LPS stimulation; Col-IBD-C: control IBD colonoids; Col-IBD-T: IBD colonoids following LPS stimulation; Ent-Tum-C: control tumor enteroids; Ent-Tum-T: tumor enteroids following LPS stimulation. Histograms represent the mean Ki-67 expression (fold change) ± SD of four technical replicates used in the qPCR experiment. Unpaired two-tailed Student’s t-test was used for statistical analysis. * p < 0.0005, ** p < 0.00001. (c) Histograms represent induced expression levels (log-ratio M values) of proliferating cell nuclear antigen (PCNA), prominin 1 (PROM1), HOP homeobox (HOPX), and olfactomedin 4 (OLFM4) in LPS treated IBD colonoids vs. LPS treated IBD enteroids (Contrast-6), and LPS treated IBD enteroids vs. LPS treated tumor enteroids (Contrast-7). The log-ratio M values represent log(R/G) (log fold change) [44]. (d) Growth rate of organoids by LPS stimulation was evaluated by surface area and diameter of the organoids, crypt length, and the number of crypts per organoid. Data are presented as mean ± SD. Ent-IBD-C: control IBD enteroids; Ent-IBD-T: IBD enteroids following LPS stimulation; Col-IBD-C: control IBD colonoids; Col-IBD-T: IBD colonoids following LPS stimulation; Ent-Tum-C: control tumor enteroids; Ent-Tum-T: tumor enteroids following LPS stimulation. Unpaired two-tailed Student’s t-test was used for statistical analysis. * p < 0.05, ** p < 0.005, *** p < 0.0005.
Figure 2
Figure 2
A heat map representing the color-coded expression levels (log-ratio M values) of the top six upregulated and five downregulated DEGs in the LPS treated tumor enteroids vs. the control tumor enteroids (Contrast-1). The log-ratio M values represent the log(R/G) (log fold change) [44]. The detailed information on genes is presented in Table 4.
Figure 3
Figure 3
A heat map depicting the color-coded expression levels (log-ratio M values) of the top four upregulated and four downregulated DEGs in the LPS treated IBD enteroids vs. the control IBD enteroids (Contrast-2). The log-ratio M values represent the log(R/G) (log fold change) [44]. The detailed information on genes is presented in Table 5.
Figure 4
Figure 4
A heat map depicting the color-coded expression levels (log-ratio M values) of the top six upregulated and five downregulated DEGs in the LPS treated IBD colonoids vs. the control IBD colonoids (Contrast-3). The log-ratio M values represent the log(R/G) (log fold change) [44]. The detailed information on genes is presented in Table 6.
Figure 5
Figure 5
A heat map depicting the color-coded expression levels (log-ratio M values) of the top 17 upregulated and six downregulated DEGs in the control IBD colonoids vs. the control IBD enteroids (Contrast 4). The log-ratio M values represent the log(R/G) (log fold change) [44]. The detailed information on genes is presented in Table 7.
Figure 6
Figure 6
A heat map depicting the color-coded expression levels (log-ratio M values) of the top 14 upregulated and five downregulated DEGs in the control IBD enteroids vs. the control tumor enteroids (Contrast-5). The log-ratio M values represent the log(R/G) (log fold change) [44]. The detailed information on genes is presented in Table 8.
Figure 7
Figure 7
A heat map depicting the color-coded expression levels (log-ratio M values) of the top 17 upregulated and six downregulated DEGs in the LPS treated IBD colonoids vs. the LPS treated IBD enteroids (Contrast-6). The log-ratio M values represent the log(R/G) (log fold change) [44]. The detailed information on genes is presented in Table 9.
Figure 8
Figure 8
A heat map depicting the color-coded expression levels (log-ratio M values) of the top 17 upregulated and six downregulated DEGs in the LPS treated IBD enteroids vs. the LPS treated tumor enteroids (Contrast-7). The log-ratio M values represent the log(R/G) (log fold change) [44]. The detailed information on genes is presented in Table 10.
Figure 9
Figure 9
A heat map representing the color-coded expression levels (log-ratio M values) of 25 DEGs exhibiting a similar pattern of expression between the IBD enteroids and colonoids following LPS stimulation. The log-ratio M values represent the log(R/G) (log fold change) [44]. The detailed information on genes is presented in Table 11.
Figure 10
Figure 10
A heat map representing the color-coded expression levels (log-ratio M values) of DEGs upregulated in the IBD enteroids and downregulated in the IBD colonoids and vice versa between the IBD enteroids and colonoids following LPS stimulation. The log-ratio M values represent the log(R/G) (log fold change) [44]. The detailed information on genes is presented in Table 12.
Figure 11
Figure 11
The association of several metabolic pathway genes in the IBD intestinal organoids and tumor enteroids. The figure was created with BioRender.com.

References

    1. Heinbockel L., Weindl G., Martinez-de-Tejada G., Correa W., Sanchez-Gomez S., Bárcena-Varela S., Goldmann T., Garidel P., Gutsmann T., Brandenburg K. Inhibition of Lipopolysaccharide- and Lipoprotein-Induced Inflammation by Antitoxin Peptide Pep19-2.5. Front. Immunol. 2018;9:1704. doi: 10.3389/fimmu.2018.01704. - DOI - PMC - PubMed
    1. Im E., Riegler F.M., Pothoulakis C., Rhee S.H. Elevated Lipopolysaccharide in the Colon Evokes Intestinal Inflammation, Aggravated in Immune Modulator-Impaired Mice. Am. J. Physiol.-Gastrointest. Liver Physiol. 2012;303:G490–G497. doi: 10.1152/ajpgi.00120.2012. - DOI - PMC - PubMed
    1. Schoultz I., Keita Å.V. The Intestinal Barrier and Current Techniques for the Assessment of Gut Permeability. Cells. 2020;9:1909. doi: 10.3390/cells9081909. - DOI - PMC - PubMed
    1. Ghosh S.S., Wang J., Yannie P.J., Ghosh S. Intestinal Barrier Dysfunction, LPS Translocation, and Disease Development. J. Endocr. Soc. 2020;4:bvz039. doi: 10.1210/jendso/bvz039. - DOI - PMC - PubMed
    1. Chin A.C., Flynn A.N., Fedwick J.P., Buret A.G. The Role of Caspase-3 in Lipopolysaccharide-Mediated Disruption of Intestinal Epithelial Tight Junctions. Can. J. Physiol. Pharmacol. 2006;84:1043–1050. doi: 10.1139/y06-056. - DOI - PubMed

LinkOut - more resources