

Connexins and Pannexins-Similarities and Differences According to the FOD-M Model
- PMID: 35884807
- PMCID: PMC9313468
- DOI: 10.3390/biomedicines10071504
Connexins and Pannexins-Similarities and Differences According to the FOD-M Model
Abstract
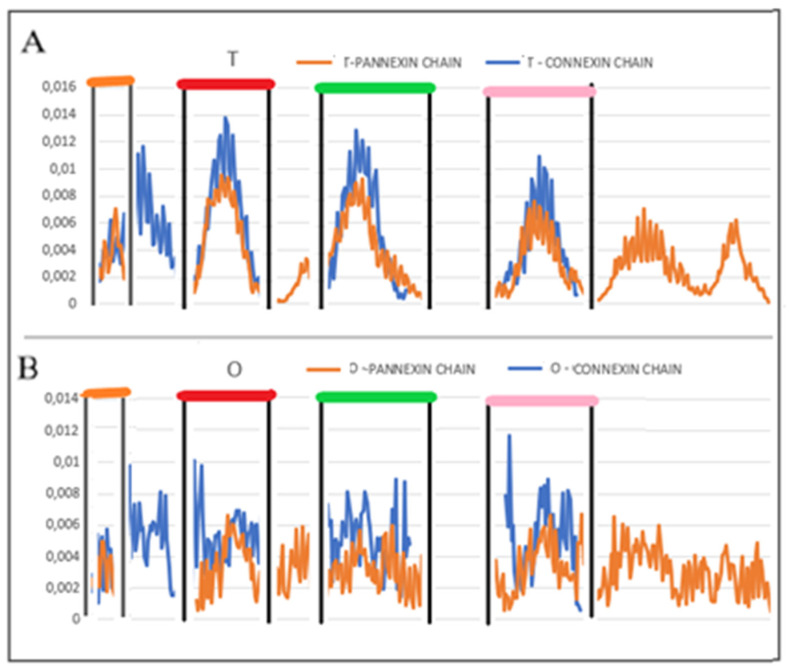
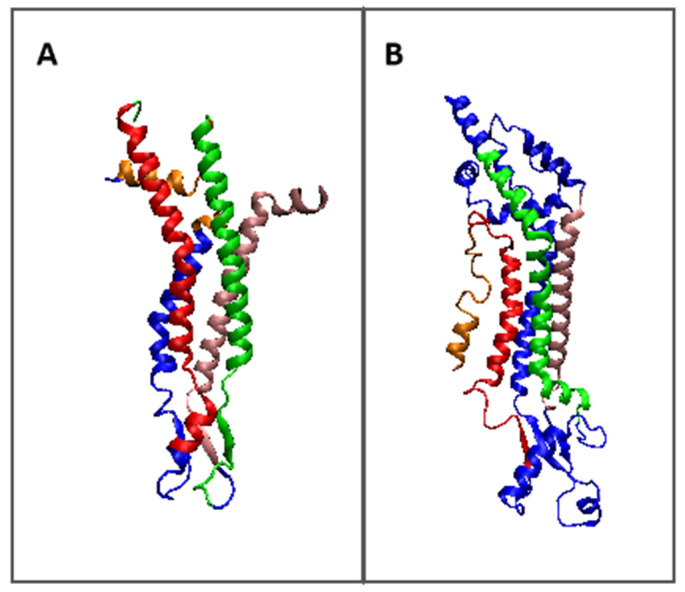
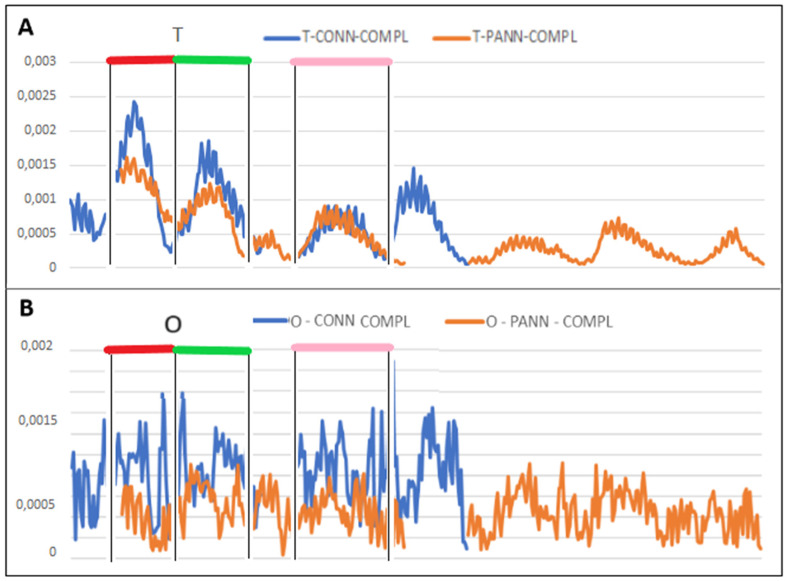
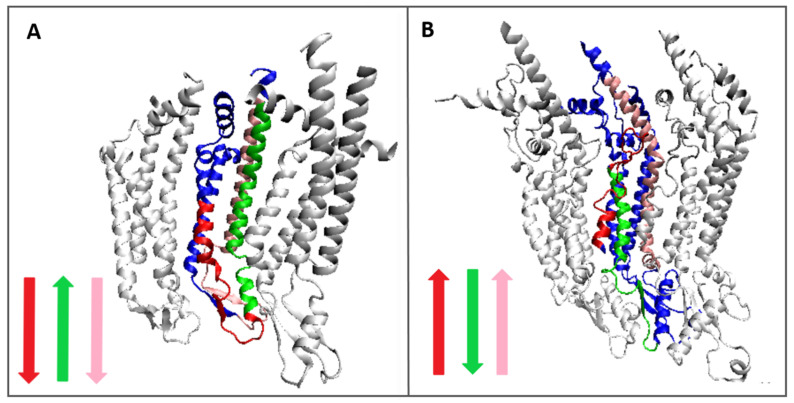
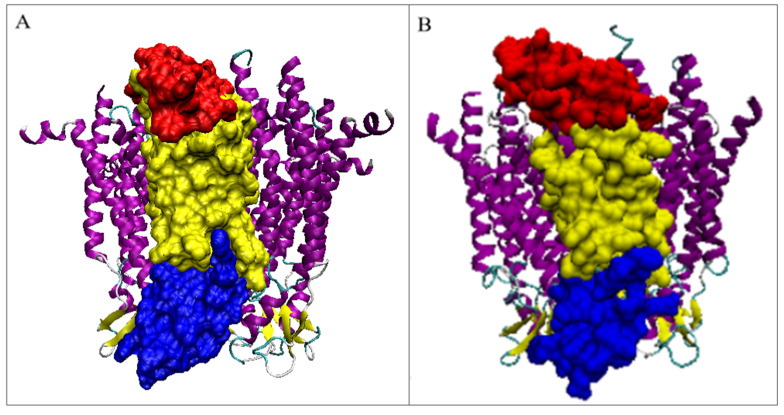
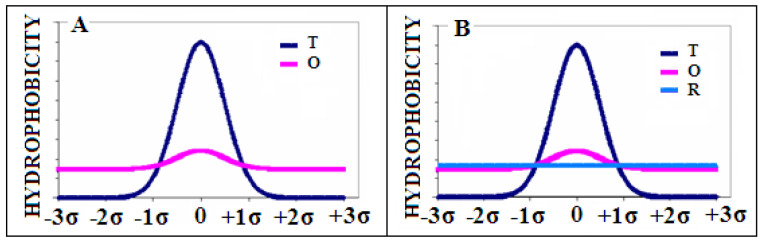
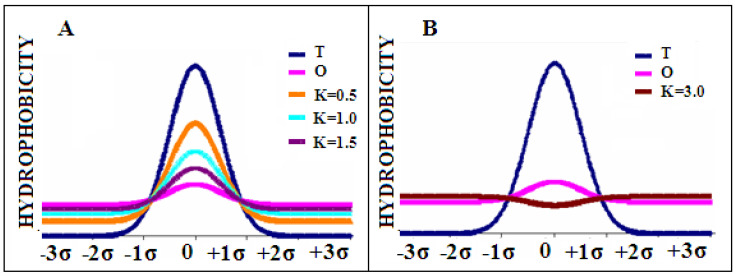
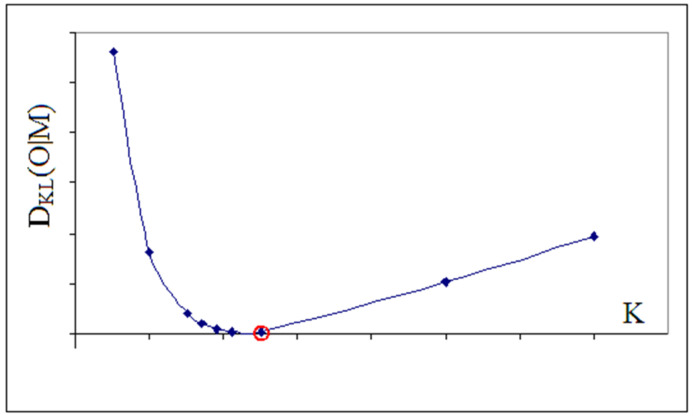
Connexins and pannexins are the transmembrane proteins of highly distinguished biological activity in the form of transport of molecules and electrical signals. Their common role is to connect the external environment with the cytoplasm of the cell, while connexin is also able to link two cells together allowing the transport from one to another. The analysis presented here aims to identify the similarities and differences between connexin and pannexin. As a comparative criterion, the hydrophobicity distribution in the structure of the discussed proteins was used. The comparative analysis is carried out with the use of a mathematical model, the FOD-M model (fuzzy oil drop model in its Modified version) expressing the specificity of the membrane's external field, which in the case of the discussed proteins is significantly different from the external field for globular proteins in the polar environment of water. The characteristics of the external force field influence the structure of protein allowing the activity in a different environment.
Keywords: connexin; hydrophobicity; membrane proteins; pannexin; transmembrane channel.
Conflict of interest statement
The authors declare no conflict of interest.
Figures
Similar articles
-
Dependence of Protein Structure on Environment: FOD Model Applied to Membrane Proteins.Membranes (Basel). 2021 Dec 30;12(1):50. doi: 10.3390/membranes12010050. Membranes (Basel). 2021. PMID: 35054576 Free PMC article.
-
Evolutionary analyses of gap junction protein families.Biochim Biophys Acta. 2013 Jan;1828(1):4-14. doi: 10.1016/j.bbamem.2012.02.007. Epub 2012 Feb 14. Biochim Biophys Acta. 2013. PMID: 22366062 Review.
-
On the Dependence of Prion and Amyloid Structure on the Folding Environment.Int J Mol Sci. 2021 Dec 16;22(24):13494. doi: 10.3390/ijms222413494. Int J Mol Sci. 2021. PMID: 34948291 Free PMC article.
-
Emerging issues of connexin channels: biophysics fills the gap.Q Rev Biophys. 2001 Aug;34(3):325-472. doi: 10.1017/s0033583501003705. Q Rev Biophys. 2001. PMID: 11838236 Review.
-
In Silico Modeling of the Influence of Environment on Amyloid Folding Using FOD-M Model.Int J Mol Sci. 2021 Sep 30;22(19):10587. doi: 10.3390/ijms221910587. Int J Mol Sci. 2021. PMID: 34638925 Free PMC article.
Cited by
-
Hydrophobicity-Based Force Field In Enzymes.ACS Omega. 2024 Feb 7;9(7):8188-8203. doi: 10.1021/acsomega.3c08728. eCollection 2024 Feb 20. ACS Omega. 2024. PMID: 38405467 Free PMC article.
-
Purinergic signaling in liver disease: calcium signaling and induction of inflammation.Purinergic Signal. 2025 Feb;21(1):69-81. doi: 10.1007/s11302-024-10044-9. Epub 2024 Sep 25. Purinergic Signal. 2025. PMID: 39320433 Free PMC article. Review.
-
External Force Field for Protein Folding in Chaperonins-Potential Application in In Silico Protein Folding.ACS Omega. 2024 Apr 10;9(16):18412-18428. doi: 10.1021/acsomega.4c00409. eCollection 2024 Apr 23. ACS Omega. 2024. PMID: 38680295 Free PMC article.
-
The Contribution of Hydrophobic Interactions to Conformational Changes of Inward/Outward Transmembrane Transport Proteins.Membranes (Basel). 2022 Nov 30;12(12):1212. doi: 10.3390/membranes12121212. Membranes (Basel). 2022. PMID: 36557119 Free PMC article.
References
-
- Focht D., Croll T., Pedersen B.P., Nissen P. Improved Model of Proton Pump Crystal Structure Obtained by Interactive Molecular Dynamics Flexible Fitting Expands the Mechanistic Model for Proton Translocation in P-Type ATPases. Front. Physiol. 2017;8:202. doi: 10.3389/fphys.2017.00202. - DOI - PMC - PubMed
Grants and funding
LinkOut - more resources
Full Text Sources
Research Materials
