. 2022 Jul 11;10(7):1665.
doi: 10.3390/biomedicines10071665.

Glutamate-Induced Deregulation of Krebs Cycle in Mitochondrial Encephalopathy Lactic Acidosis Syndrome Stroke-Like Episodes (MELAS) Syndrome Is Alleviated by Ketone Body Exposure

Affiliations

Glutamate-Induced Deregulation of Krebs Cycle in Mitochondrial Encephalopathy Lactic Acidosis Syndrome Stroke-Like Episodes (MELAS) Syndrome Is Alleviated by Ketone Body Exposure

Sophie Belal et al. Biomedicines. .

Abstract

(1) Background: The development of mitochondrial medicine has been severely impeded by a lack of effective therapies. (2) Methods: To better understand Mitochondrial Encephalopathy Lactic Acidosis Syndrome Stroke-like episodes (MELAS) syndrome, neuronal cybrid cells carrying different mutation loads of the m.3243A > G mitochondrial DNA variant were analysed using a multi-omic approach. (3) Results: Specific metabolomic signatures revealed that the glutamate pathway was significantly increased in MELAS cells with a direct correlation between glutamate concentration and the m.3243A > G heteroplasmy level. Transcriptomic analysis in mutant cells further revealed alterations in specific gene clusters, including those of the glutamate, gamma-aminobutyric acid pathways, and tricarboxylic acid (TCA) cycle. These results were supported by post-mortem brain tissue analysis from a MELAS patient, confirming the glutamate dysregulation. Exposure of MELAS cells to ketone bodies significantly reduced the glutamate level and improved mitochondrial functions, reducing the accumulation of several intermediate metabolites of the TCA cycle and alleviating the NADH-redox imbalance. (4) Conclusions: Thus, a multi-omic integrated approach to MELAS cells revealed glutamate as a promising disease biomarker, while also indicating that a ketogenic diet should be tested in MELAS patients.

Keywords: MELAS syndrome; NADH/NAD imbalance; glutamate; ketone body treatment; mitochondrial diseases; mtDNA; multi-omics; tricarboxylic acid cycle.


Conflict of interest statement

The authors declare no conflict of interest.

Figures

Figure 1
Figure 1
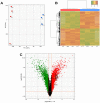
Metabolomic analysis between MELAS and control cells. (A) Unsupervised Principal Component Analysis (PCA) scatter plot carried on metabolomics data from parental control cells (n = 10, green dots) and mutant (MT, blue dots) cells with different m.3243A > G mutation loads (n = 30). The first two principal components (PC1 and PC2) explain more than 75% of the total variance. Control and mutant cells clearly group separately with control cells plotting in the upper right quadrant of the first principal plan determined by PC1 and PC2. (B) Supervised Orthogonal Partial Least Squares-Discriminant Analysis (OPLS-DA) scatter plot model aiming at classifying parental control cells from mutant cells based on the metabolomic data matrix. As expected from the PCA plot, both populations are very well separated in a predictive and non-overfitted model. Predictive (pLV) and orthogonal (oLV) latent variables are dimensionless. (C) OPLS score plot of MELAS cells with different MT loads. MT cybrids are separated according to the mutation load: 70% (blue circles), 90% (green circles), and 98% (red circles), along with the predictive latent variable (pLV). (D) Volcano plot obtained from the supervised OPLS models for MT cells with 70%, 90% to 98% mutation loads vs parental cells (Figure 1B). Only the most discriminating metabolites with high Variable importance on projection (VIP Ipiab and their loading rescaled as the correlation coefficient between the predictive latent variable and the corresponding metabolite or Pcorr (≥ 0.02 or ≤−0.02) have been labelled. Negative coefficients (left) indicate diminished metabolite concentrations in MT cells versus parental cells, whereas positive coefficients (right) indicate increased metabolite concentrations. (E) Volcano plot for the OPLS-DA model obtained from the metabolomic analysis of MELAS cells with 70%, 90%, and 98% mutation loads (Figure 1C). Only the most discriminating metabolites with high variable importance in the projection (VIP) values (>1) and Pcorr values (OPLS-DA model obtained from the metabolomic analysis of MELAS cells with 70%, 90%, 98% mutation loads (Figure 1C). Only the most discriminating metabolites with high variable importance in the projection (VIP) values (>1) and amino acids and biogenic amines are represented as green bubbles; phosphatidylcholines (PC) as yellow bubbles and lysophosphatidylcholines (lysoPC) as pink bubbles. In PC, “aa” indicates that both moieties at the sn-1 and sn-2 positions are fatty acids and bound to the glycerol backbone via ester bonds, whilst “ae” denotes that one of the moieties, either in the sn-1 or sn-2 position is a fatty alcohol and bound via an ether bond. For lysoPCs and PCs, the total number of carbon atoms and double bonds present in the lipid fatty acid chain(s) are denoted as “C x:y”, where x is the total carbon number (of both chains for PCs) and y is the total number of double bonds. Ala: Alanine; alpha-AAA: α-Aminoadipic acid; Ac-Orn: Acetylornithine; Asp: Aspartate; c4-OH-Pro: cis-4-Hydroxyproline; DOPA: 3,4-Dihydroxyphenylalanine; Gln: Glutamine; Glu: Glutamate; His: Histidine; Ile: Isoleucine; Leu: Leucine; Met: Methionine; Orn: Ornithine; Phe: Phenylalanine; Thr: Threonine; Trp: Tryptophane; Tyr: Tyrosine; Val: Valine. The metabolic signature is characterised by lower levels of 6 acylcarnitines (C0, C2, C4, C16, C18, C18:1) (blue bubbles), 10 amino acids and biogenic amines (green bubbles) and higher levels of several PC (yellow bubbles) and sphingomyelins (orange bubbles). Ala: Alanine, Gln: Glutamine, Ser: Serine, Lys: Lysine, Pro: Proline, Gly: Glycine, Arg: Arginine, Taurine, Serotonin, and Spermine.
Figure 2
Figure 2
Glutamate concentration is correlated with complex I deficiency in MELAS cells. (A) Intracellular levels of glutamate in control (Ctrl) and mutant (MT) cells (70%, 90%, and 98%). (B) Biochemical assessment of mitochondrial complex I activity in Ctrl and MT cells (70%, 90%, and 98%). (C) Intracellular level of glutamate in Ctrl cells treated for 15 h with rotenone (200 nM) or a vehicle. (D) Biochemical assessment of mitochondrial complex I activity in Ctrl cells treated for 15 h with rotenone or a vehicle. (E) Extracellular glutamate levels. Ctrl: control cells and MT cells carrying different mutation loads (70%, 90%, and 98%). (F) Intracellular glutamate levels in Ctrl and 98% MT cells with (+) or without (−) the addition of glutamine. Results are presented as the mean ± SEM relative to Ctrl cells of at least 4 independent experiments. Statistical differences between MT and Ctrl cells are indicated with an asterisk (* p < 0.05; ** p < 0.01; *** p < 0.001).
Figure 3
Figure 3
Gene expression profiling of mutant cells. (A) Principal component analysis (PCA) and unsupervised clustering of MT (red) vs Ctrl cells (blue). (B) Heatmap diagram of two-way hierarchical clustering analysis of the 4943 probes, showing different expression levels with a p-value ≤ 0.05 and abs (FC) ≥ 1.5. Red and green colours represent an expression level above or lower than the mean, respectively. The X-axis represents samples with, from the left to the right, control cells compared to 98% MT cells (n = 4) while the Y-axis represents Illumina probes. (C) Volcano plot representation of the differentially expressed genes in a pairwise comparison of control vs 98% MT cells. The significant cut-off was set at a p-value ≤ 0.05 and abs (FC) ≥ 1.5. Differentially expressed genes annotated as glutamate-glutamine metabolism, GABA, and TCA cycle in the REACTOME pathway database (see Table 1) are labelled with their corresponding gene symbols.
Figure 4
Figure 4
Treatment with ketone bodies restores a normal intracellular glutamate concentration and improves the mitochondrial network in MELAS cells. (A) Intracellular and (B) extracellular glutamate levels in Ctrl and 98% MT cells treated for 48 h with (+) or without (−) KB. Results are from at least four independent experiments, expressed as the mean ± SEM relative to Ctrl cells. (* p < 0.05). (C) Cell growth of 98% MT cells cultured in a standard medium (SM, light green curve), or exposed to KB (orange curve), or with 50 µM glutamate (Glu) and KB (red curve) or a standard medium (SM + Glu, green curve). (D) Mitochondrial morphology, and percentages of fragmented (black) or connected (white) mitochondria in 98% MT cells with (+) or without (−) KB, and with or without glutamate (30 µM). (E) Representative images showing the MitoTracker (green fluorescence) and Hoechst (blue fluorescence) staining of 98% MT cells, incubated for 24 h in E-1: standard medium, E-2: with KB, E-3: with glutamate (Glu), and E-4: with Glu and KB. Scale Bar: 10 um.
Figure 5
Figure 5
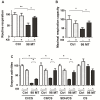
Treatment with ketone bodies improves mitochondrial respiration and enzyme activities in MELAS cells. (A) Oxygraphic measurements of routine (B) and maximal respiration capacity in Ctrl and 98% MT cells, treated with or without KB for 48 h. (C) Enzyme activities of mitochondrial complex I, II, and SDH, relative to citrate synthase (CS) in control and 98% MT cells, treated for 48 h with or without KB. Results are presented as the mean ± SEM, relative to Ctrl cells, of at least 4 independent experiments. Statistical differences between 98% MT and Ctrl cells are indicated with an asterisk (* p < 0.05; ** p < 0.01).
Figure 6
Figure 6
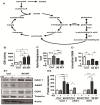
The Glutamate and GABA metabolic pathways are altered in MELAS cells. (A) Graphical representation of the glutamate pathway and TCA cycle. GAD1 (glutamate decarboxylase), ABAT (4 aminobutyrate transaminase), and GDH (glutamate dehydrogenase). (B) Measurement of GDH activity, (C) intracellular levels of αKG concentration, and (D) intracellular levels of GABA in Ctrl and 98% MT cells, exposed for 48 h with (+) or without (−) KB. (E1) Western blots showing GAD1, ABAT, and GDH expression profiles in Ctrl and 98% MT cells, treated for 48 h with (+) or without (−) KB. (E2) Quantification of GAD1, ABAT, and GDH relative expression related to tubulin and actin in Ctrl and 98% MT cells treated with (+) or without (−) KB. Results are presented as the mean ± SEM, relative to Ctrl cells of at least 4 independent experiments. Statistical differences between 98% MT and Ctrl cells are indicated with an asterisk (* p < 0.05; ** p < 0.01; *** p < 0.001).
Figure 7
Figure 7
TCA cycle dysfunction in MELAS cells is alleviated by ketone bodies. (A) Pyruvate, (B) lactate, (C) citrate, (D) αKG, (E) succinate, (F) fumarate, and (G) malate levels in Ctrl and 98% MT cells treated for 48 h with (+, dotted line) or without (−, colour bar) ketone bodies (KB). Results are presented as the mean ± SEM relative to Ctrl cells of at least 4 independent experiments. Statistical differences between 98% MT and Ctrl cells are indicated with an asterisk (* p < 0.05; ** p < 0.01; *** p < 0.001).
Figure 8
Figure 8
The glutamate pathway is altered in the brain tissue of a patient with MELAS. Immunohistochemical analysis of paraffin-embedded human frontal brain tissue labelled with GDH (A1,A2), GAD1 (B1,B2), and ABAT (C1,C2) antibodies, from Ctrl individuals (left panel) and a patient with MELAS (right panel). Immunohistochemical staining intensities of GDH (A2), GAD1 (B2), and ABAT (C2) were examined microscopically and scored semi-quantitatively as part of two independent analyses on five Ctrl individuals and one patient with MELAS as follows: 0 = absent, + = mild, ++ = moderate, and +++ = intense. FL: frontal lobe; LN: lentiform nucleus; T+SN: thalamus + subthalamic nucleus, C: cerebellum.
Figure 9
Figure 9
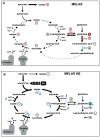
Graphical representation of metabolic pathways of MELAS cells (A) untreated (B) or treated with ketone bodies (KB). +: metabolite increase. –: metabolite reduction, = metabolite unchanged. : increased gene expression. : decreased gene expression. Metabolic consequences of KB treatment on mitochondrial metabolism are summarised in 4 main steps: 1. significant reduction of glutamate concentration; 2. reduction of the accumulation of TCA intermediates restoring the physiological function of the TCA cycle; 3. re-equilibration of the redox/NADH balance; 4 improving complex I enzyme activity.

References

    1. Wallace D.C., Fan W., Procaccio V. Mitochondrial energetics and therapeutics. Annu. Rev. Pathol. 2010;5:297–348. doi: 10.1146/annurev.pathol.4.110807.092314. - DOI - PMC - PubMed
    1. Wallace D.C. A mitochondrial paradigm of metabolic and degenerative diseases, aging, and cancer: A dawn for evolutionary medicine. Annu. Rev. Genet. 2005;39:359–407. doi: 10.1146/annurev.genet.39.110304.095751. - DOI - PMC - PubMed
    1. Wallace D.C. Why do we still have a maternally inherited mitochondrial DNA? Insights from evolutionary medicine. Annu. Rev. Biochem. 2007;76:781–821. doi: 10.1146/annurev.biochem.76.081205.150955. - DOI - PubMed
    1. Goto Y., Nonaka I., Horai S. A mutation in the tRNA(Leu)(UUR) gene associated with the MELAS subgroup of mitochondrial encephalomyopathies. Nature. 1990;348:651–653. doi: 10.1038/348651a0. - DOI - PubMed
    1. Hirano M., Ricci E., Koenigsberger M.R., Defendini R., Pavlakis S.G., DeVivo D.C., DiMauro S., Rowland L.P. Melas: An original case and clinical criteria for diagnosis. Neuromuscul. Disord. 1992;2:125–135. doi: 10.1016/0960-8966(92)90045-8. - DOI - PubMed