Review
. 2022 Jul 15;10(7):1713.
doi: 10.3390/biomedicines10071713.

A Systematic Review and Meta-Analysis of Cerebrospinal Fluid Amyloid and Tau Levels Identifies Mild Cognitive Impairment Patients Progressing to Alzheimer's Disease

Affiliations
Review

A Systematic Review and Meta-Analysis of Cerebrospinal Fluid Amyloid and Tau Levels Identifies Mild Cognitive Impairment Patients Progressing to Alzheimer's Disease

Yunxing Ma et al. Biomedicines. .

Abstract

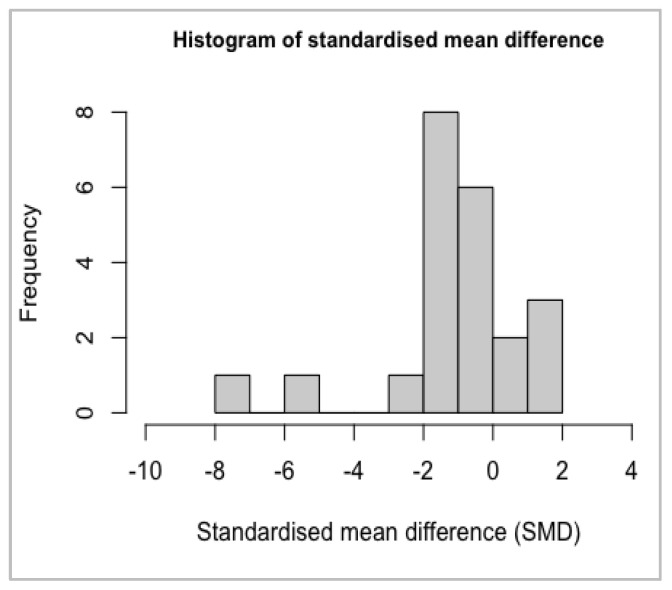
Reported levels of amyloid-beta and tau in human cerebrospinal fluid (CSF) were evaluated to discover if these biochemical markers can predict the transition from Mild Cognitive Impairment (MCI) to Alzheimer’s disease (AD). A systematic review of the literature in PubMed and Web of Science (April 2021) was performed by a single researcher to identify studies reporting immunologically-based (xMAP or ELISA) measures of CSF analytes Aβ(1-42) and/or P-tau and/or T-tau in clinical studies with at least two timepoints and a statement of diagnostic criteria. Of 1137 screened publications, 22 met the inclusion criteria for CSF Aβ(1-42) measures, 20 studies included T-tau, and 17 included P-tau. Six meta-analyses were conducted to compare the analytes for healthy controls (HC) versus progressive MCI (MCI_AD) and for non-progressive MCI (Stable_MCI) versus MCI_AD; effect sizes were determined using random effects models. The heterogeneity of effect sizes across studies was confirmed with very high significance (p < 0.0001) for all meta-analyses except HC versus MCI_AD T-tau (p < 0.05) and P-tau (non-significant). Standard mean difference (SMD) was highly significant (p < 0.0001) for all comparisons (Stable_MCI versus MCI_AD: SMD [95%-CI] Aβ(1-42) = 1.19 [0.96,1.42]; T-tau = −1.03 [−1.24,−0.82]; P-tau = −1.03 [−1.47,−0.59]; HC versus MCI_AD: SMD Aβ(1-42) = 1.73 [1.39,2.07]; T-tau = −1.13 [−1.33,−0.93]; P-tau = −1.10 [−1.23,−0.96]). The follow-up interval in longitudinal evaluations was a critical factor in clinical study design, and the Aβ(1−42)/P-tau ratio most robustly differentiated progressive from non-progressive MCI. The value of amyloid-beta and tau as markers of patient outcome are supported by these findings.

Keywords: Alzheimer’s disease; amyloid beta; biomarker; cerebrospinal fluid; meta-analysis; mild cognitive impairment; systematic review; tau.


Conflict of interest statement

The authors declare no conflict of interest.

Figures

Figure A1
Figure A1
The distribution of the SMD of stable MCI (MCI_St) versus MCI_AD is slightly skewed and shows an outlier, but is otherwise approximately normal.
Figure A2
Figure A2
There are a couple of studies outside the confidence bounds for a fixed effect model, including an outlier, but the studies are somewhat balanced on either side of the effect estimates. So, the funnel plot does not reveal an obvious presence of publication or other bias for stable MCI versus MCI_AD.
Figure A3
Figure A3
The distribution of the SMD of HC versus MCI_AD is slightly skewed but still approximately normal.
Figure A4
Figure A4
There are a couple of studies outside the confidence bounds for a fixed effect model, including an outlier, but the studies are somewhat balanced on either side of the effect estimates. So, the funnel plot does not reveal an obvious presence of publication or other bias for HC versus MCI_AD.
Figure A5
Figure A5
The distribution of the SMD of stable MCI versus MCI_AD is slightly skewed and shows an outlier, but is still within an acceptable range of a normal distribution.
Figure A6
Figure A6
There are a few studies outside the confidence bounds for a fixed effect model including one outlier, but the studies are still well balanced on either side of the effect estimates. So, the funnel plot does not reveal an obvious presence of publication or other bias for stable MCI versus MCI_AD.
Figure A7
Figure A7
The distribution of the SMD of HC versus MCI_AD is not too dissimilar to a normal distribution, considering the limitations of a small sample.
Figure A8
Figure A8
The studies are still well balanced on either side of the effect estimates. So, the funnel plot does not reveal an obvious presence of publication or other bias for HC versus MCI_AD.
Figure A9
Figure A9
The distribution of the SMD of stable MCI (MCI_St) versus MCI_AD is asymmetric, but not too far from a normal distribution.
Figure A10
Figure A10
There are a few studies outside the confidence bounds for a fixed effect model, including outliers, but the studies are still somewhat balanced on either side of the effect estimates. So, the funnel plot does not reveal any clear presence of publication or other bias for stable MCI (MCI_St) versus MCI_AD.
Figure A11
Figure A11
Due to the small number of studies, it is difficult to draw conclusions from the histogram, but there is no clear evidence against the distribution of the SMD of HC versus MCI_AD being approximately normal.
Figure A12
Figure A12
The funnel plot does not reveal any clear presence of publication or other bias, but the number of studies is notably quite small for HC versus MCI_AD.
Figure 1
Figure 1
Flow chart of the systematic literature search according to PRISMA 2020 guidelines [28], using the PubMed and Web of Science databases as detailed in the main text, for records published in or after 1994, with the record identification (data extraction) completed in April 2021. * For reports excluded for multiple reasons, only the primary exclusion criterion is counted here (i.e., each excluded report is only counted once). The primary reasons for exclusion of reports were as follows. Reason 1: Diagnostic outcome information was insufficient (did not explicitly consider the transition from Mild Cognitive Impairment to Alzheimer’s disease); Reason 2: Data parameters prevented inclusion (e.g., an incomplete dataset for the purpose of this study, or because data could not be converted into mean ± standard deviation at baseline such as where ratios between markers were reported, or because the population sampled was too small <30); Reason 3: Analysis in a report replicated that in one or more other reports meeting the inclusion criteria (e.g., where there were multiple studies evaluating the ADNI dataset, or the report was a review of other studies).
Figure 2
Figure 2
Evolution of diagnostic criteria for MCI from 1995 to 2011 [40,41,42].
Figure 3
Figure 3
Concentration of amyloid beta 1-42 in CSF at baseline, as determined by xMAP and ELISA.
Figure 4
Figure 4
Concentration of T-tau in CSF, as determined by as determined by xMAP and ELISA.
Figure 5
Figure 5
Concentration of P-tau in CSF at baseline, as determined by xMAP and ELISA.
Figure 6
Figure 6
The ratio of Aβ1-42 to (a) T-tau and (b) P-tau in CSF, using data for mean and standard deviation (upper bound shown as error bar) taken directly from the sub-set of papers in the systematic review that included this information [32,37,44,48,54,55,57,61].
Figure 7
Figure 7
Meta-analysis of studies investigating CSF Aβ1-42 levels for non-progressive MCI (MCI_St) versus progressive MCI (MCI_AD), see Appendix A.2.1 [30,32,33,34,35,36,37,44,45,46,47,48,49,50,51,52,53,54,55,56,57,58].
Figure 8
Figure 8
Meta analysis of studies investigating CSF Aβ1-42 levels for healthy control (HC) versus progressive MCI (MCI_AD), see Appendix A.2.2 [30,32,33,34,35,36,37,44,45,46,47,48,49,50,51,52,53,54,55,56,57,58].
Figure 9
Figure 9
Meta-analysis of studies investigating CSF T-tau levels for non-progressive MCI (MCI_St) versus progressive MCI (MCI_AD), see Appendix A.3.1 [30,32,34,35,36,37,44,45,46,47,48,49,50,52,53,54,55,57,58].
Figure 10
Figure 10
Meta analysis of studies investigating CSF T-tau levels for healthy control (HC) versus progressive MCI (MCI_AD), see Appendix A.3.2 [30,32,34,35,36,37,44,45,46,47,48,49,50,52,53,54,55,57,58].
Figure 11
Figure 11
Meta-analysis of studies investigating CSF P-Tau levels for non-progressive MCI (MCI_St) versus progressive MCI (MCI_AD), see Appendix A.4.1 [30,32,34,35,36,37,44,45,46,47,48,50,54,55,57,58].
Figure 12
Figure 12
Meta analysis of studies investigating CSF P-tau levels for healthy control (HC) versus progressive MCI (MCI_AD), see Appendix A.4.2 [30,32,34,35,36,37,44,45,46,47,48,50,54,55,57,58].
Figure 13
Figure 13
Illustrating the diagnostic trajectories for the 137 patients included in the studies summarized in Table 2 (derived from Hansson et al. [32] and Buchhave et al. [44]).
Figure 14
Figure 14
Showing the relationship between analyte value and months elapsed since baseline for (a) Amyloid, (b) T-tau, and (c) P-tau from the subset of studies in this systematic review that included follow-up duration [34,36,37,46,47,53,54,56,57,58].

References

    1. World Health Organization Life Expectancy at Birth (Years) [(accessed on 18 June 2022)]; Available online: https://www.who.int/data/gho/data/indicators/indicator-details/GHO/life-...
    1. Xia X., Jiang Q., McDermott J., Han J.-D.J. Aging and Alzheimer’s disease: Comparison and associations from molecular to system level. Aging Cell. 2018;17:e12802. doi: 10.1111/acel.12802. - DOI - PMC - PubMed
    1. Guerreiro R., Bras J. The age factor in Alzheimer’s disease. Genome Med. 2015;7:106. doi: 10.1186/s13073-015-0232-5. - DOI - PMC - PubMed
    1. Sperling R.A., Karlawish J., Johnson K.A. Preclinical Alzheimer disease-the challenges ahead. Nat. Rev. Neurol. 2013;9:54–58. doi: 10.1038/nrneurol.2012.241. - DOI - PMC - PubMed
    1. Bachurin S.O., Bovina E.V., Ustyugov A.A. Drugs in Clinical Trials for Alzheimer’s Disease: The Major Trends. Med. Res. Rev. 2017;37:1186–1225. doi: 10.1002/med.21434. - DOI - PubMed

LinkOut - more resources