. 2022 Jun 21;13(7):1112.
doi: 10.3390/genes13071112.

Characterization of Expression and Epigenetic Features of Core Genes in Common Wheat

Affiliations

Characterization of Expression and Epigenetic Features of Core Genes in Common Wheat

Dongyang Zheng et al. Genes (Basel). .

Abstract

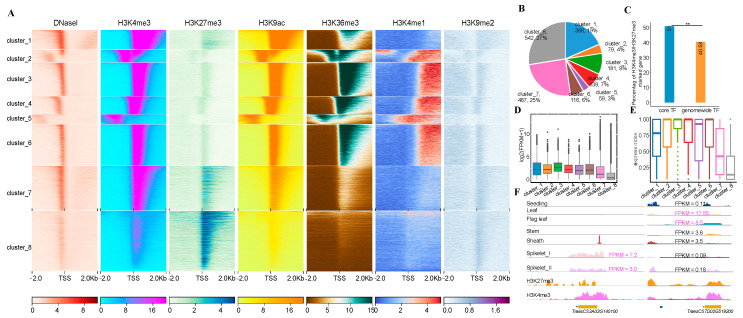
The availability of multiple wheat genome sequences enables us to identify core genes and characterize their genetic and epigenetic features, thereby advancing our understanding of their biological implications within individual plant species. It is, however, largely understudied in wheat. To this end, we reanalyzed genome sequences from 16 different wheat varieties and identified 62,299 core genes. We found that core and non-core genes have different roles in subgenome differentiation. Meanwhile, according to their expression profiles, these core genes can be classified into genes related to tissue development and stress responses, including 3376 genes highly expressed in both spikelets and at high temperatures. After associating with six histone marks and open chromatin, we found that these core genes can be divided into eight sub-clusters with distinct epigenomic features. Furthermore, we found that ca. 51% of the expressed transcription factors (TFs) were marked with both H3K27me3 and H3K4me3, indicative of the bivalency feature, which can be involved in tissue development through the TF-centered regulatory network. Thus, our study provides a valuable resource for the functional characterization of core genes in stress responses and tissue development in wheat.

Keywords: Triticum aestivum; core genes; epigenetic features; expression.


Conflict of interest statement

The authors declare no conflict of interest.

Figures

Figure 1
Figure 1
Identification of core genes in wheat. (A), The percentage of core genes distributed in subgenomes, 33% for A_subgenome, 29% for B_subgenome and 38% for D_subgenome. (B), Population differentiation index of core genes between cultivars and landraces, dashed line represents Fst = 0.04. (C), GO enrichment analyses of core genes with a population differentiation index greater than 0.25. (DF), Comparisons of core and non-core gene lengths (D), expression levels (E), and nucleotide diversity (F). (G), Proportion of core genes with homolog genes in maize and Arabidopsis. Where ** means p < 0.01.
Figure 2
Figure 2
Core and non-core genes have different roles in subgenome differentiation. (A,B), (A) Comparing the expression levels of all core genes and (B) all non-core genes within subgenomes. (CF), Comparisons of expression levels and KaKs values between paired homologous genes. where (C,E) indicate that both genes are core genes, and (D,F) indicate that one gene is a core gene, and another is non-core genes. (G,H), GO enrichment analyses of core and non-core genes in homologous gene pairs, (G) indicates GO terms specific to the core genes; (H) indicates GO terms specific to the non-core genes. Only the top 20 most important GO terms are listed. (IL), GRO-seq read the intensity of all core genes (I), all non-core genes (J), all homologous pairs as core genes (K), and only one homologous pair as core gene (L). In general, GRO-seq signals and gene expression levels were positively correlated. Where * indicates that p < 0.05, ** means p < 0.01.
Figure 3
Figure 3
Expression patterns of core genes in abiotic stresses and multiple tissues. (A), The expression level clustering result of core genes in the stress treatment. (B), The expression level clustering result of core genes in different tissues, all clustering results were transformed by Z-score, and the genes with the sum of FPKM less than three were excluded for further analyses. (CF), GO enrichment analyses of different genes. GO enrichment analyses of heat stress (C), salt stress (D) and core genes with high expression levels in spikelet_I (E) and spikelet_II (F). (G), Venn diagram of genes highly expressed in heat stress and genes highly expressed during the spikelet development, genes listed below the Venn diagram indicating reported genes related to heat response, starch synthesis and DNA repair. (H), GO enrichment analyses of highly expressed genes in heat stress and spikelet development.
Figure 4
Figure 4
Epigenetic landscapes of expressed core genes. (A), Chromatin states were performed on the upstream and downstream 2 kb of the expressed core gene promoters. A total of eight subcategories were classified, C7/C8 was enriched with H3K27/K4me3. (B), The proportion of TFs in different chromatin states, C7/C8 occupied 50% of the TFs. (C), Comparisons of core TFs with H3K4/K27me3 bivalent mark between C7/C8 and the whole genome. (D,E), Analyses of the core gene expression values (D), and the expression breadth (E) corresponding to different chromatin states. Genes with higher active histone modifications correspond to higher gene expression levels and lower tissue specificity, and vice versa. (F), IGV illustrates genes for spikelet-(left) and leaf-(right) specific expression, respectively. Where ** means p < 0.01.
Figure 5
Figure 5
Construction of TF-centered regulatory networks. (A), Construction of TF related co-expression network using H3K4/K27me3 marked TFs. (B), Modules related to spikelet development were selected from the co-expression network. (C), A regulatory network with the regulation direction was re-constructed using GENIE3 for the TFs in the selected modules, and the top 1000 weighted regulatory relationships were selected, 9 TFs of which were present in the co-expression modules.

References

    1. Ballouz S., Dobin A., Gillis J.A. Is it time to change the reference genome? Genome Biol. 2019;20:159. doi: 10.1186/s13059-019-1774-4. - DOI - PMC - PubMed
    1. Au K.F., Valiente-Mullor C., Beamud B., Ansari I., Francés-Cuesta C., García-González N., Mejía L., Ruiz-Hueso P., González-Candelas F. One is not enough: On the effects of reference genome for the mapping and subsequent analyses of short-reads. PLoS Comput. Biol. 2021;17:e1008678. doi: 10.1371/journal.pcbi.1008678. - DOI - PMC - PubMed
    1. Tettelin H., Masignani V., Cieslewicz M.J., Donati C., Medini D., Ward N.L., Angiuoli S.V., Crabtree J., Jones A.L., Durkin A.S., et al. Genome analysis of multiple pathogenic isolates of Streptococcus agalactiae: Implications for the microbial “pan-genome”. Proc. Natl. Acad. Sci. USA. 2005;102:13950–13955. doi: 10.1073/pnas.0506758102. - DOI - PMC - PubMed
    1. Sherman R.M., Salzberg S.L. Pan-genomics in the human genome era. Nat. Rev. Genet. 2020;21:243–254. doi: 10.1038/s41576-020-0210-7. - DOI - PMC - PubMed
    1. Bayer P.E., Golicz A.A., Scheben A., Batley J., Edwards D. Plant pan-genomes are the new reference. Nat. Plants. 2020;6:914–920. doi: 10.1038/s41477-020-0733-0. - DOI - PubMed

Publication types

MeSH terms

Substances

LinkOut - more resources