The Relative Power of Structural Genomic Variation versus SNPs in Explaining the Quantitative Trait Growth in the Marine Teleost Chrysophrys auratus
- PMID: 35885912
- PMCID: PMC9320665
- DOI: 10.3390/genes13071129
The Relative Power of Structural Genomic Variation versus SNPs in Explaining the Quantitative Trait Growth in the Marine Teleost Chrysophrys auratus
Abstract
Background: Genetic diversity provides the basic substrate for evolution. Genetic variation consists of changes ranging from single base pairs (single-nucleotide polymorphisms, or SNPs) to larger-scale structural variants, such as inversions, deletions, and duplications. SNPs have long been used as the general currency for investigations into how genetic diversity fuels evolution. However, structural variants can affect more base pairs in the genome than SNPs and can be responsible for adaptive phenotypes due to their impact on linkage and recombination. In this study, we investigate the first steps needed to explore the genetic basis of an economically important growth trait in the marine teleost finfish Chrysophrys auratus using both SNP and structural variant data. Specifically, we use feature selection methods in machine learning to explore the relative predictive power of both types of genetic variants in explaining growth and discuss the feature selection results of the evaluated methods.
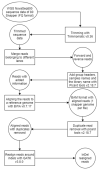
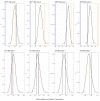
Methods: SNP and structural variant callers were used to generate catalogues of variant data from 32 individual fish at ages 1 and 3 years. Three feature selection algorithms (ReliefF, Chi-square, and a mutual-information-based method) were used to reduce the dataset by selecting the most informative features. Following this selection process, the subset of variants was used as features to classify fish into small, medium, or large size categories using KNN, naïve Bayes, random forest, and logistic regression. The top-scoring features in each feature selection method were subsequently mapped to annotated genomic regions in the zebrafish genome, and a permutation test was conducted to see if the number of mapped regions was greater than when random sampling was applied.
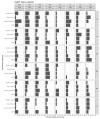
Results: Without feature selection, the prediction accuracies ranged from 0 to 0.5 for both structural variants and SNPs. Following feature selection, the prediction accuracy increased only slightly to between 0 and 0.65 for structural variants and between 0 and 0.75 for SNPs. The highest prediction accuracy for the logistic regression was achieved for age 3 fish using SNPs, although generally predictions for age 1 and 3 fish were very similar (ranging from 0-0.65 for both SNPs and structural variants). The Chi-square feature selection of SNP data was the only method that had a significantly higher number of matches to annotated genomic regions of zebrafish than would be explained by chance alone.
Conclusions: Predicting a complex polygenic trait such as growth using data collected from a low number of individuals remains challenging. While we demonstrate that both SNPs and structural variants provide important information to help understand the genetic basis of phenotypic traits such as fish growth, the full complexities that exist within a genome cannot be easily captured by classical machine learning techniques. When using high-dimensional data, feature selection shows some increase in the prediction accuracy of classification models and provides the potential to identify unknown genomic correlates with growth. Our results show that both SNPs and structural variants significantly impact growth, and we therefore recommend that researchers interested in the genotype-phenotype map should strive to go beyond SNPs and incorporate structural variants in their studies as well. We discuss how our machine learning models can be further expanded to serve as a test bed to inform evolutionary studies and the applied management of species.
Keywords: Chrysophrys auratus; feature selection; growth; prediction; single-nucleotide polymorphisms; structural variants.
Conflict of interest statement
The authors declare no conflict of interest.
Figures



Similar articles
-
The genomic pool of standing structural variation outnumbers single nucleotide polymorphism by threefold in the marine teleost Chrysophrys auratus.Mol Ecol. 2019 Mar;28(6):1210-1223. doi: 10.1111/mec.15051. Mol Ecol. 2019. PMID: 30770610
-
Accuracy of prediction of simulated polygenic phenotypes and their underlying quantitative trait loci genotypes using real or imputed whole-genome markers in cattle.Genet Sel Evol. 2015 Dec 23;47:99. doi: 10.1186/s12711-015-0179-4. Genet Sel Evol. 2015. PMID: 26698091 Free PMC article.
-
Genomic Signatures of Domestication Selection in the Australasian Snapper (Chrysophrys auratus).Genes (Basel). 2021 Oct 29;12(11):1737. doi: 10.3390/genes12111737. Genes (Basel). 2021. PMID: 34828341 Free PMC article.
-
Fully exploiting SNP arrays: a systematic review on the tools to extract underlying genomic structure.Brief Bioinform. 2022 Mar 10;23(2):bbac043. doi: 10.1093/bib/bbac043. Brief Bioinform. 2022. PMID: 35211719 Free PMC article.
-
A review of machine learning models applied to genomic prediction in animal breeding.Front Genet. 2023 Sep 6;14:1150596. doi: 10.3389/fgene.2023.1150596. eCollection 2023. Front Genet. 2023. PMID: 37745853 Free PMC article. Review.
Cited by
-
Advancing genetic improvement in the omics era: status and priorities for United States aquaculture.BMC Genomics. 2025 Feb 17;26(1):155. doi: 10.1186/s12864-025-11247-z. BMC Genomics. 2025. PMID: 39962419 Free PMC article. Review.
-
Non-synonymous variation and protein structure of candidate genes associated with selection in farm and wild populations of turbot (Scophthalmus maximus).Sci Rep. 2023 Feb 21;13(1):3019. doi: 10.1038/s41598-023-29826-z. Sci Rep. 2023. PMID: 36810752 Free PMC article.
References
-
- May R.M. Biological diversity: Differences between land and sea. Philos. Trans. R. Soc. London. Ser. B Biol. Sci. 1994;343:105–111.
-
- Chain F.J.J., Feulner P.G.D., Panchal M., Eizaguirre C., Samonte I.E., Kalbe M., Lenz T.L., Stoll M., Bornberg-Bauer E., Milinski M., et al. Extensive Copy-Number Variation of Young Genes across Stickleback Populations. PLoS Genet. 2014;10:e1004830. doi: 10.1371/journal.pgen.1004830. - DOI - PMC - PubMed
Publication types
MeSH terms
LinkOut - more resources
Full Text Sources

