. 2022 Jul 4;13(7):1200.
doi: 10.3390/genes13071200.

Immune-Related Genomic Schizophrenic Subtyping Identified in DLPFC Transcriptome

Affiliations

Immune-Related Genomic Schizophrenic Subtyping Identified in DLPFC Transcriptome

Eva Childers et al. Genes (Basel). .

Abstract

Well-documented evidence of the physiologic, genetic, and behavioral heterogeneity of schizophrenia suggests that diagnostic subtyping may clarify the underlying pathobiology of the disorder. Recent studies have demonstrated that increased inflammation may be a prominent feature of a subset of schizophrenics. However, these findings are inconsistent, possibly due to evaluating schizophrenics as a single group. In this study, we segregated schizophrenic patients into two groups ("Type 1", "Type 2") by their gene expression in the dorsolateral prefrontal cortex and explored biological differences between the subgroups. The study included post-mortem tissue samples that were sequenced in multiple, publicly available gene datasets using different sequencing methods. To evaluate the role of inflammation, the expression of genes in multiple components of neuroinflammation were examined: complement cascade activation, glial cell activation, pro-inflammatory mediator secretion, blood-brain barrier (BBB) breakdown, chemokine production and peripheral immune cell infiltration. The Type 2 schizophrenics showed widespread abnormal gene expression across all the neuroinflammation components that was not observed in Type 1 schizophrenics. Our results demonstrate the importance of separating schizophrenic patients into their molecularly defined subgroups and provide supporting evidence for the involvement of the immune-related pathways in a schizophrenic subset.

Keywords: inflammation; schizophrenia; subtypes; transcriptome.


Conflict of interest statement

The authors declare no conflict of interest.

Figures

Figure 1
Figure 1
Two schizophrenic clusters identified in multiple RNAseq datasets. (A,C) Heatmaps for polyA and riboZ, respectively, showing the top forty genes with the highest log fold change (LogFC) across all schizophrenic patients. Clustering of the genes and subjects are shown at the side and top of the heatmaps, respectively. (B,D) Enlargement of the color bars in (A,C). Refer to the color bar on the side for color definitions. AA = African American, AS = Asian, CAUC = Caucasian, HISP = Hispanic, F = Female, and M = Male.
Figure 2
Figure 2
Most subjects are being consistently clustered across four independent datasets. (A) Comparison of polyA, riboZ and Illumina. (B) Comparison of polyA, riboZ, and consistently classified subjects from (A) with CMC. For each pair of datasets, the percentage of subjects that were clustered as the same type (“match”, pink) versus not the same subtype (“no match”, blue) was calculated. To see more detailed tables, refer to Supplemental Tables S2–S4.
Figure 3
Figure 3
Type 2 schizophrenics have large differences in expression compared to schizophrenics (SCZ) pooled, Type 1, and Mix in both datasets. (A,C) Venn diagram of overlapping genes across the SCZ groups. Number of genes that are shared between groups will be listed in intersecting circles. SCZ pooled (blue), Type 1 (yellow), Mix (green) and Type 2 (red). (B,D) Boxplot of absolute log fold change (LogFC) values for each SCZ group in polyA and riboZ, respectively. The absolute value of LogFC was calculated.
Figure 4
Figure 4
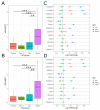
Type 2 has increased upregulation of complement cascade genes. (A,C) Absolute LogFC value for complement cascade genes for each SCZ group for polyA and riboZ, respectively *** p-value < 0.001 via Tukey HSD. (B,D) LogFC for each SCZ group for subset of genes in polyA and riboZ, respectively. Type 2 (blue), Mix (red), Type 1 (green). Lines indicate standard error. Filled circles = differentially expressed (Benjamini-Hochberg p-value < 0.05), empty circles = not differentially expressed. (E,F) Boxplot of the log2+1 expression data is shown for each SCZ group: Controls (red), Type 1 (green), Mix (blue) and Type 2 (purple). ** p-value < 0.01, *** p-value < 0.001 via Tukey HSD.
Figure 5
Figure 5
Microglia marker expression in the SCZ groups. (A,B) LogFC for genes associated with microglial activation across SCZ subtypes: Type 2 (blue), Mix (red), Type 1 (green). Lines indicate standard error. Filled circles = differentially expressed (Benjamini-Hochberg p-value < 0.05), empty circles = not differentially expressed. (CH) Boxplot of the log2+1 expression data is shown for each SCZ group: Controls (red), Type 1 (green), Mix (blue) and Type 2 (purple). Graphs on the left are polyA and graphs on the right are riboZ. * p-value < 0.05, ** p-value < 0.01, *** p-value < 0.001 via Tukey HSD.
Figure 6
Figure 6
Astrocyte marker expression in the SCZ groups. (AD) Boxplot of the log2+1 expression data is shown for each SCZ group: Controls (red), Type 1 (green), Mix (blue) and Type 2 (purple). (A,B) are from the polyA dataset, (C,D) for riboZ. * p-value < 0.05, ** p-value < 0.01, *** p-value < 0.001 via Tukey HSD. (E,F) Absolute LogFC value for astrocyte activation genes for each SCZ group for polyA and riboZ, respectively. * p-value < 0.05, *** p-value < 0.001 via Tukey HSD. (G,H) LogFC for genes associated with astrocyte activation across SCZ groups for polyA and riboZ, respectively: Type 2 (blue), Mix (red), Type 1 (green). Lines indicate standard error. Filled circles = differentially expressed (Benjamini-Hochberg p-value < 0.05), empty circles = not differentially expressed.
Figure 7
Figure 7
Pro-inflammatory mediator expression among SCZ subtypes. (A,B) Absolute LogFC value for astrocyte activation genes for each SCZ group for polyA and riboZ, respectively. * p-value < 0.05, ** p-value < 0.01, via Tukey HSD. (C,D) LogFC for pro-inflammatory mediators for SCZ as a pooled group. Lines indicate standard error. Pink circles = differentially expressed (Benjamini-Hochberg p-value < 0.05), blue circles = not differentially expressed. (E,F) LogFC pro-inflammatory mediators across SCZ subtypes for polyA and riboZ, respectively: Type 2 (blue), Mix (red), Type 1 (green). Lines indicate standard error. Filled circles = differentially expressed (Benjamini-Hochberg p-value < 0.05), empty circles = not differentially expressed.
Figure 8
Figure 8
BMEC expression in the SCZ groups. (A,B) Absolute LogFC value for BMEC genes for each SCZ group for polyA and riboZ, respectively. * p-value < 0.05, ** p-value < 0.01, *** p-value < 0.001 via Tukey HSD. (C,D) LogFC for each BMEC gene across SCZ subtypes for polyA and riboZ, respectively: Type 2 (blue), Mix (red), Type 1 (green). Lines indicate standard error. Filled circles = differentially expressed (Benjamini-Hochberg p-value < 0.05), empty circles = not differentially expressed.
Figure 9
Figure 9
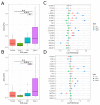
Chemokine’s expression across SCZ subtypes: (A) CXCL1, (B) CXCL2, (C) CXCL8, (D) CCL2. Boxplot of the log2+1 expression data is shown for each SCZ group: Controls (red), Type 1 (green), Mix (blue) and Type 2 (purple). Graphs on the left are polyA and graphs on the right are riboZ. * p-value < 0.05, ** p-value < 0.01, *** p-value < 0.001 via Tukey HSD.
Figure 10
Figure 10
Peripheral immune expression in the SCZ groups. (A,B) Absolute LogFC value for peripheral markers for each SCZ group for polyA and riboZ, respectively. ** p-value < 0.01, *** p-value < 0.001 via Tukey HSD. (C,D) LogFC for each peripheral marker across SCZ subtypes for polyA and riboZ, respectively: Type 2 (blue), Mix (red), Type 1 (green). Lines indicate standard error. Filled circles = differentially expressed (Benjamini-Hochberg p-value < 0.05), empty circles = not differentially expressed.

References

    1. Kirkpatrick B., Buchanan R.W., Ross D.E., Carpenter J. A separate disease within the syndrome of schizophrenia. Arch. Gen. Psychiatry. 2001;58:165–171. doi: 10.1001/archpsyc.58.2.165. - DOI - PubMed
    1. Carpenter W., Kirkpatrick B. The Heterogeneity of the Long-Term Course of Schizophrenia. Schizophr. Bull. 1988;14:645–652. doi: 10.1093/schbul/14.4.645. - DOI - PubMed
    1. Chand G.B., Singhal P., Dwyer D.B., Wen J., Erus G., Doshi J., Srinivasan D., Mamourian E., Varol E., Hwang G., et al. Two schizophrenia imaging signatures and and their associations with cognition, psychopathology, and genetics in the general population. medRxiv. 2022 doi: 10.1101/2022.01.07.22268854. - DOI - PMC - PubMed
    1. Xiao Y., Liao W., Long Z., Tao B., Zhao Q., Luo C., Tamminga C.A., Keshavan M.S., Pearlson G.D., Clementz B.A., et al. Subtyping Schizophrenia Patients Based on Patterns of Structural Brain Alterations. Schizophr. Bull. 2022;48:241–250. doi: 10.1093/schbul/sbab110. - DOI - PMC - PubMed
    1. Liang S., Greenwood T. The Impact of Clincial Heterogeneity in Schizophrenia on Genomic Analyses. Schizophr. Res. 2015;161:490–495. doi: 10.1016/j.schres.2014.11.019. - DOI - PMC - PubMed

Publication types