. 2022 Jul 18;19(14):8732.
doi: 10.3390/ijerph19148732.

Air Pollution and Workplace Choice: Evidence from China

Affiliations

Air Pollution and Workplace Choice: Evidence from China

Tao Lin et al. Int J Environ Res Public Health. .

Abstract

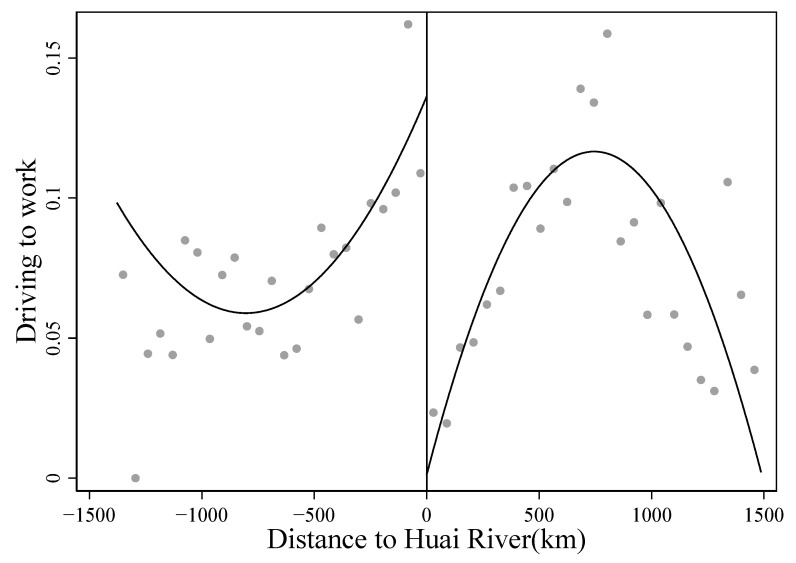
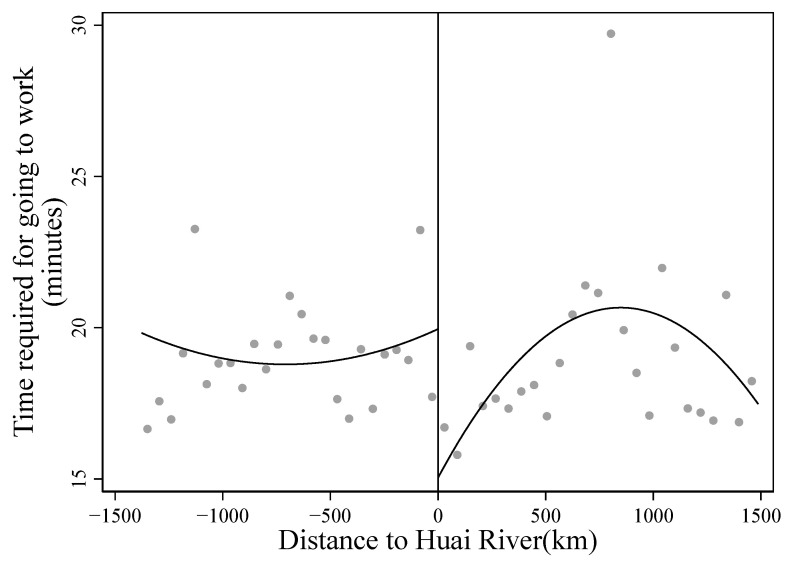
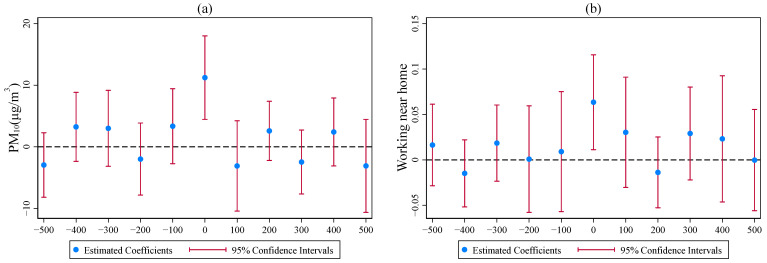
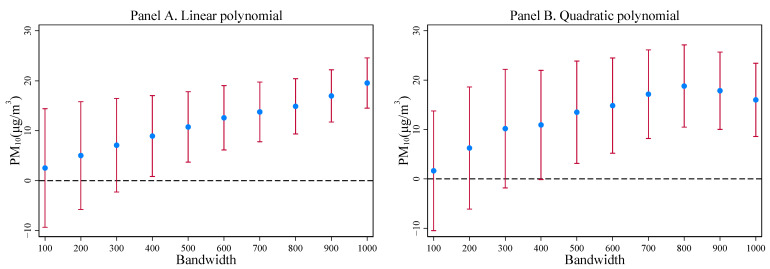
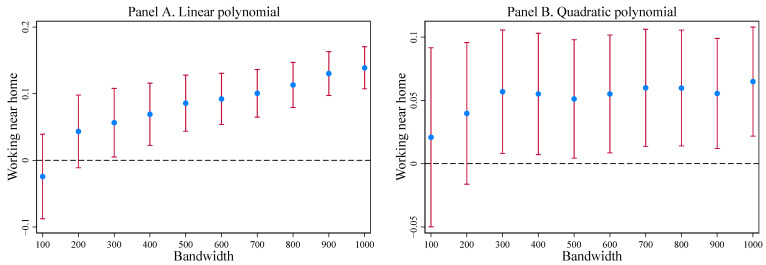
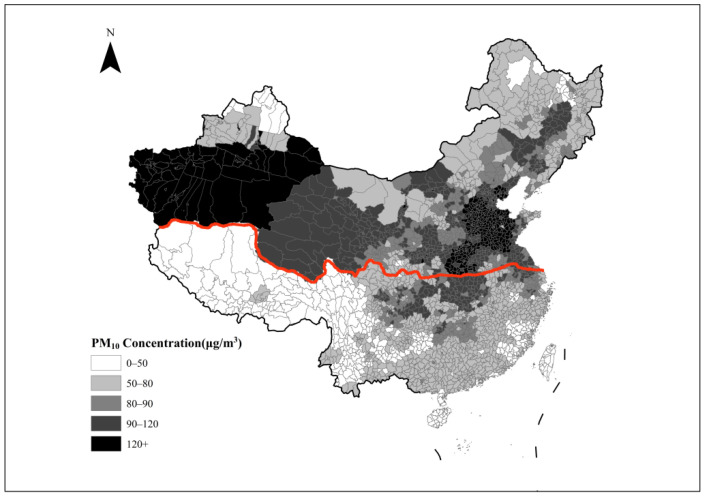
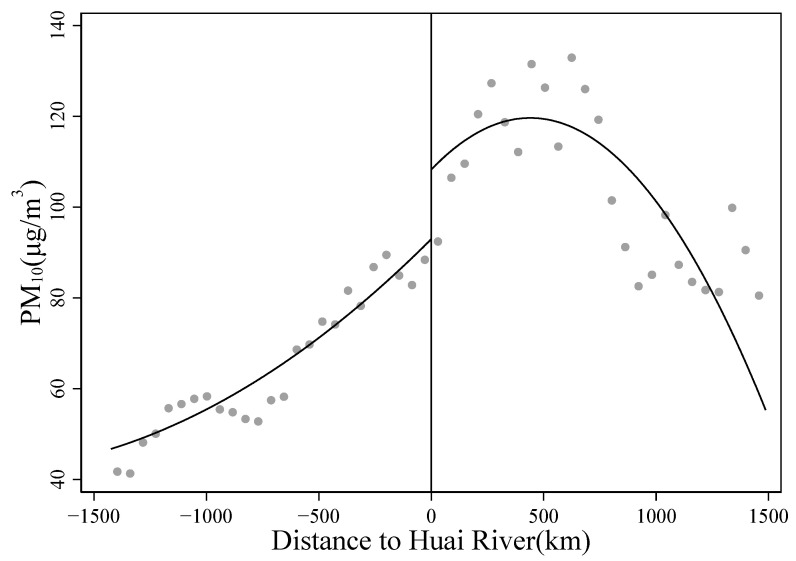
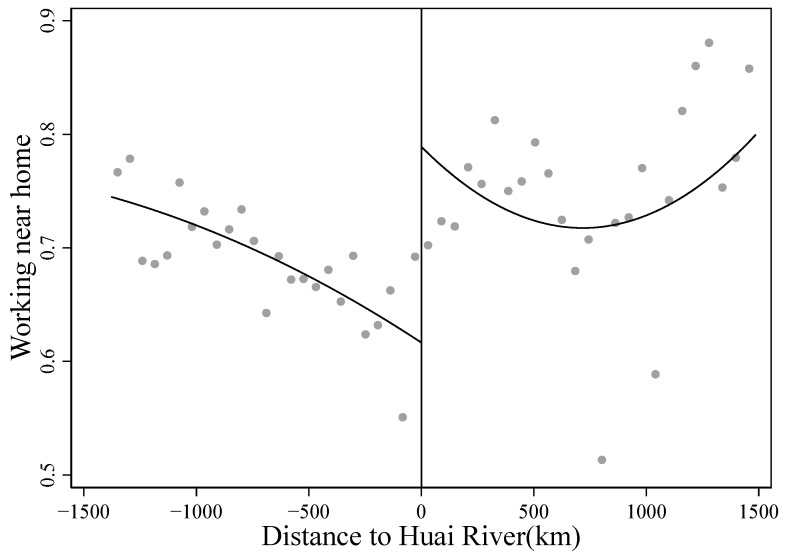
Understanding the impacts of air pollution on public health and individual behavior is crucial for optimal environmental policy design. Using 2015 census microdata in China, this paper examined the causal effect of air pollution on working place choice. The research design relies on a regression discontinuity design based on China's Huai River Policy. The discontinuity in air pollution caused by the Huai River Policy provides a natural experiment to estimate the impact of air pollution. The results show that air pollution significantly increases the possibility of individuals working near home. The positive effect of air pollution on working near home is more significant for women, the elderly, urban individuals and those individuals working in secondary and tertiary industries. This study improves our understanding of the health effects and avoidance behavior associated with environmental hazards, discusses the negative impact of air pollution on labor mobility and mismatch by making individuals work nearby, and emphasizes that strengthening air pollution control should be a long-term policy.

Keywords: China; air pollution; avoidance behavior; public health; regression discontinuity design; workplace.


Conflict of interest statement

The authors declare no conflict of interest.

Figures

Figure A1
Figure A1
RD plot for driving to work. Notes: The figure shows the binned averages of driving to work against the running variable. The solid line represents a quartic polynomial fit of driving to work by car on each side of the threshold.
Figure A2
Figure A2
RD plot for the time required for going to work. Notes: The figure shows the binned averages of the time required for going to work against the running variable. The solid line represents a quartic polynomial fit of time on each side of the threshold.
Figure A3
Figure A3
Placebo testing: estimated discontinuity in pollution at displaced Huai River boundaries. Notes: In (a), each point plots the point estimate of a separate estimation of α1 in Equation (2) along with the 95 percent confidence interval at the displaced Huai River boundaries. In (b), each point plots the point estimate of a separate estimation of δ1 in Equation (3) along with the 95 percent confidence interval at the displaced Huai River boundaries. Each RD estimates is based on the MSE bandwidth selection method and triangular kernel function.
Figure A4
Figure A4
Robustness to alternative bandwidths for the impact of the Huai River Policy on PM10. Notes: Each point plots the point estimate of a separate estimation of α1 in Equation (2) along with the 95 percent confidence interval, ranging from 100 km to 1000 km bandwidths. (Panel A) plots estimates using linear polynomials in distance. (Panel B) plots estimates from equivalent regressions but using second-order polynomials in distance. Each RD estimate is based on the MSE bandwidth selection method and triangular kernel function.
Figure A5
Figure A5
Robustness to alternative bandwidths for the impact of the Huai River Policy on work. Notes: Each point plots the point estimate of a separate estimation of δ1 in Equation (3) along with the 95 percent confidence interval, ranging from 100 km to 1000 km bandwidths. (Panel A) plots estimates using linear polynomials in distance. (Panel B) plots estimates from equivalent regressions but using second-order polynomials in distance. Each RD estimate is based on the MSE bandwidth selection method and triangular kernel function.
Figure A6
Figure A6
Distributions of distances of counties from the Huai River.
Figure A7
Figure A7
McCrary test of the discontinuity in distances of counties from the Huai River. Notes: The hollow circles represent the point estimates within bins. Solid lines are the density curve estimates.
Figure 1
Figure 1
Huai River Policy line and PM10 concentrations. Note: The red line is China’s Huai River/Qinling Mountain Range winter heating policy line. The polygons represent counties, the third level of the administrative hierarchy in China. The coloring of the polygons corresponds to average PM10 concentrations from 2014 to 2015.
Figure 2
Figure 2
RD plot for PM10. Note: The figure plots the binned averages of county-level PM10 concentrations against the running variable. The solid line represents a quartic polynomial fit of PM10 on each side of the threshold.
Figure 3
Figure 3
RD plot for work. Note: The figure shows the binned averages of working near home against the running variable. The solid line represents a quartic polynomial fit of working near home on each side of the threshold.

References

    1. Sørensen M., Daneshvar B., Hansen M., Dragsted L.O., Hertel O., Knudsen L., Loft S. Personal PM2.5 exposure and markers of oxidative stress in blood. Environ. Health Perspect. 2003;111:161–166. doi: 10.1289/ehp.111-1241344. - DOI - PMC - PubMed
    1. Chen Y., Ebenstein A., Greenstone M., Li H. Evidence on the impact of sustained exposure to air pollution on life expectancy from China’s Huai River policy. Proc. Natl. Acad. Sci. USA. 2013;110:12936–12941. doi: 10.1073/pnas.1300018110. - DOI - PMC - PubMed
    1. Ebenstein A., Fan M., Greenstone M., He G., Yin P., Zhou M. Growth, pollution, and life expectancy: China from 1991–2012. Amer. Econ. Rev. 2015;105:226–231. doi: 10.1257/aer.p20151094. - DOI
    1. Lai W. Pesticide use and health outcomes: Evidence from agricultural water pollution in China. J. Environ. Econ. Manag. 2017;86:93–120. doi: 10.1016/j.jeem.2017.05.006. - DOI
    1. Zhang X., Zhang X., Chen X. Happiness in the air: How does a dirty sky affect mental health and subjective well-being? J. Environ. Econ. Manag. 2017;85:81–94. doi: 10.1016/j.jeem.2017.04.001. - DOI - PMC - PubMed

Publication types