. 2022 Jul 7;23(14):7540.
doi: 10.3390/ijms23147540.

AtGAP1 Promotes the Resistance to Pseudomonas syringae pv. tomato DC3000 by Regulating Cell-Wall Thickness and Stomatal Aperture in Arabidopsis

Affiliations

AtGAP1 Promotes the Resistance to Pseudomonas syringae pv. tomato DC3000 by Regulating Cell-Wall Thickness and Stomatal Aperture in Arabidopsis

Sau-Shan Cheng et al. Int J Mol Sci. .

Abstract

GTP is an important signaling molecule involved in the growth, development, and stress adaptability of plants. The functions are mediated via binding to GTPases which are in turn regulated by GTPase-activating proteins (GAPs). Satellite reports have suggested the positive roles of GAPs in regulating ABA signaling and pathogen resistance in plants. However, the molecular mechanisms that bring forth the pathogen resistance have remained unclear. In this study, we demonstrated that the expression of AtGAP1 was inducible by Pseudomonas syringae pv. tomato DC3000 (Pst DC3000). The overexpression of AtGAP1 in Arabidopsis promoted the expression of PR1 and the resistance to Pst DC3000. Proteomic analyses revealed the enhanced accumulation of cell-wall-modifying proteins as a result of AtGAP1 overexpression. By microscopic analyses, we showed that the overexpression of AtGAP1 resulted in increased thickness of the mesophyll cell wall and reduced stomatal aperture, which are effective strategies for restricting the entry of foliar pathogens. Altogether, we demonstrated that AtGAP1 increases the resistance to Pst DC3000 in Arabidopsis by promoting cellular strategies that restrict the entry of pathogens into the cells. These results point to a future direction for studying the modes of action of GAPs in regulating plant cell structures and disease resistance.

Keywords: GTP; GTPase activating protein (GAP); cell wall; pathogen resistance; stomatal aperture.


Conflict of interest statement

The authors declare no conflict of interest.

Figures

Figure 1
Figure 1
AtGAP1 is inducible in Arabidopsis by pathogen (Pst DC3000) inoculation and AtGAP1-overexpressors are more effective in activating the pathogen-resistance marker gene, PR1, than wild type or the empty vector control. The rosette leaves of five-week-old wild type Arabidopsis (Col-0), empty vector control (V7), and AtGAP1-overexpressors (independent lines A and C) were inoculated with Pst DC3000. Total RNA was extracted from the aerial part of the plants. (A) AtGAP1 expression was induced in Col-0 at 3 days post-inoculation (Day 3) with Pst DC3000, compared to Day 0. (B) The relative expressions of PR1 in wild type (Col-0), V7 (empty vector control), and AtGAP1-overexpressors (lines A and C) at 0 and 3 d post-inoculation (dpi). Gene expression levels were normalized to 0 dpi levels of Col-0, using ACT7 (AT5G09810) as the reference gene [54], by the 2−ΔΔCt method [55]. Three plants of each line were pooled as one sample for total RNA extraction and expression analysis. For each sample, three technical repeats of the RT-qPCR were performed. Error bars represent the standard errors of the three technical repeats. A similar expression trend was observed in another biological repeat (Figures S3 and S4).
Figure 2
Figure 2
AtGAP1-overexpressing Arabidopsis showed a more resistant phenotype to Pst DC3000 than wild type and the empty vector control. The rosette leaves of five-week-old Arabidopsis plants, including the wild type (Col-0), empty vector control (V7), and AtGAP1-overexpressors (independent lines A and C) were inoculated with Pst DC3000. (A) The Pst DC3000-induced lesions in the rosette leaves at 0 and 3 days post-inoculation (dpi), indicated by red arrows. There were no visible lesions on the leaves of AtGAP1-overexpressors at 3 dpi. (B) Pathogen titers of the inoculated rosette leaves expressed in colony-forming units per cm2 of the leaf surface area at 0 dpi. (C) Pathogen titers of the inoculated rosette leaves at 3 dpi. (B) and (C) Different letters indicate significant differences at p < 0.05, using one-way ANOVA followed by post-hoc Tukey honestly significant difference (HSD) test. The results represent the average of three biological replicates. In each biological replicate, three individual plants were inoculated with Pst DC3000 for the pathogen titer analysis. Error bar: standard error; n = 9 plants from 3 biological replicates.
Figure 3
Figure 3
AtGAP1-overexpressors showed a more significant enrichment in cell-wall-related proteins in their differential protein expression profiles after the inoculation of Pst DC3000 than the empty vector control. The rosette leaves of five-week-old Arabidopsis plants, including the empty vector control and AtGAP1 overexpressors (independent lines A and C) were inoculated with Pst DC3000. Total protein was extracted from the aerial part of the plants for protein-expression profiling. (A) Volcano plots showing the fold-changes in protein abundance between 3 days post-inoculation (dpi) and 0 dpi in AtGAP1-overexpressor line A, AtGAP1-overexpressor line C, and the empty vector control. The statistical significance of differential protein expression was calculated using Student’s t-test based on the default parameters in Proteome Discoverer v2.4 (Thermo Fisher Scientific, Waltham, MA, USA). The -log10-transformed p-value (Benjamini–Hochberg adjusted −log10 p-value) was plotted against log10-transformed protein quantity ratios for all proteins between 3 and 0 dpi in AtGAP1-overexpressors and the empty vector control. The volcano plot is generated via the R-based package EnhancedVolcano (ver. 1.0.1; https://github.com/kevinblighe/EnhancedVolcano (accessed on 30 April 2022) [57]). Differentially expressed protein with Benjamini–Hochberg adjusted p-value < 0.05 and log10 (|fold change|) > 0.48 (equivalent to 3-fold changes) were plotted in red. Proteins with log10 (|fold change|) > 0.48 but with adjusted p-value ≥ 0.05 were plotted in green, and proteins with log10 (|fold change|) ≤ 0.48 with adjusted p-value < 0.05 were plotted in blue. (B) Venn diagram showing the numbers of differentially expressed proteins after Pst DC3000 inoculation that were common between AtGAP1-overexpressors and the empty vector control. (C) Gene ontology (GO) analysis of the differentially expressed proteins in AtGAP1-overexpressing lines and the empty vector control between 3 and 0 dpi. The lists of differentially expressed proteins were compared using PANTHER from The Arabidopsis Information Resources (TAIR) database for the GO-term enrichment in cellular components. The GO terms with fold enrichment > 2 and adjusted p-value < 0.05 were listed. Each biological replicate was pooled from three individual plants of the same line. The results were the average of three biological replicates analyzed using Proteome Discoverer v2.4. (Thermo Fisher Scientific, Waltham, MA, USA).
Figure 4
Figure 4
Differential protein expression profiles due to AtGAP1-overexpression in Arabidopsis at Day 0 of Pst DC3000 inoculation analyzed by liquid chromatography-mass spectrometry (LC-MS) and label-free quantification (LFQ). (A) Volcano plots showing the fold changes in proteins in AtGAP1-overexpressor A and AtGAP1-overexpressor C compared to the empty vector control at Day 0 of Pst DC3000 inoculation (0 dpi). The data from LFQ were subjected to Student’s t-test based on the default parameters in Proteome Discoverer v2.4 (Thermo Fisher Scientific, Waltham, MA, USA). Differentially expressed proteins with Benjamini–Hochberg adjusted p-value < 0.05 and log10 (|fold-change|) > 0.48 (equivalent to 3-fold changes) were plotted in red. Proteins with log10 (|fold change|) > 0.48 but with adjusted p-value ≥ 0.05 were plotted in green, and those with log10 (|fold change|) ≤ 0.48 with adjusted p-value < 0.05 were plotted in blue. (B) Venn diagram showing the numbers of differentially expressed proteins common between AtGAP1-overexpressor A and AtGAP1-overexpressor C when compared to the empty vector control at 0 dpi. (C) Gene ontology (GO) analysis of the 239 differentially expressed proteins having similar expression trends in both AtGAP1-overexpressors A and C compared to the empty vector control at 0 dpi. The differentially expressed proteins were classified using PANTHER from The Arabidopsis Information Resources (TAIR) database for the GO-term enrichment in cellular components. GO-terms with fold enrichment > 2 and Bonferroni-corrected p < 0.05 were listed. The results were the average of three biological replicates analyzed using Proteome Discoverer v2.4 (Thermo Fisher Scientific, Waltham, MA, USA). For each biological replicate, three plants were collected for protein extraction and analysis.
Figure 5
Figure 5
AtGAP1 overexpression primes the production of cell-wall-modifying proteins in Arabidopsis before any exposure to the pathogen Pst DC3000. The label-free quantification (LFQ) intensities of cell-wall-modifying proteins extracted from the leaves of five-week-old Arabidopsis plants, including XTH24 (AT4G30270), GLP4 (AT1G09560), LRX3 (AT4G13340), GL22 (AT1G02335), XTH25 (AT5G57550), GL22 (AT1G02335), and FLA11 (AT5G03170), were compared among the empty vector control, AtGAP1-overexpressing line A, and AtGAP1-overexpressing line C at 0 and 3 dpi (days post-inoculation) of Pst DC3000. The error bar represents the standard error of six technical replicates from three biological replicates.
Figure 6
Figure 6
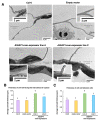
AtGAP1 enhances the cell-wall thickness of mesophyll cells. (A) Representative transmission electron microscopy (TEM) images of the cross-sections of four-week-old rosette leaf cells of untreated Arabidopsis plants, including wild type (Col-0), empty vector control, and AtGAP1-overexpressor lines A and C. Cell-wall structures were indicated by white arrows. Scale bar: 2 μm. (B) The thickness of the cell wall facing the intercellular air spaces was measured for ≥50 cells from ≥20 fields. (C) The thickness of the cell wall that was in contact with another cell was measured from ≥20 cells from ≥10 fields. For each cell, the thickness was determined by averaging the thickness of five random points along the cell wall. Different letters above the bars indicate significant differences at p < 0.05, analyzed using one-way ANOVA followed by post-hoc Tukey honest significant difference (HSD) test. Error bar represents the standard error of all the measured cells.
Figure 7
Figure 7
AtGAP1-overexpression reduces stomatal aperture in Arabidopsis with the effect being reversible by additional GTP. Detached rosette leaves of four-week-old Arabidopsis plants, including wild type, empty vector control (V7), and AtGAP1-overexpressor lines A and C, were treated with or without (mock) 200 μM GTP under light for 2 h. (A) Representative images of guard cells observed using a light microscope. Scale bar: 5 μm. (B) Stomatal apertures of wild type, empty vector control (V7), and AtGAP1-overexpressor lines A and C treated with or without (mock) 200 μM GTP. For each line, the stomatal apertures of ≥25 pairs of guard cells were measured. Error bar: standard error of all the cells measured. A similar trend was observed in another biological replicate (Figure S9). Different letters above the bars indicate significant differences at p < 0.05, analyzed using one-way ANOVA followed by post-hoc Tukey honestly significant difference (HSD) test.

References

    1. Watson N., Linder M.E., Druey K.M., Kehrl J.H., Blumer K.J. RGS family members: GTPase-activating proteins for heterotrimeric G-protein α-subunits. Nature. 1996;383:172–175. doi: 10.1038/383172a0. - DOI - PubMed
    1. Ross E.M., Wilkie T.M. GTPase-activating proteins for heterotrimeric G proteins: Regulators of G protein signaling (RGS) and RGS-like proteins. Annu. Rev. Biochem. 2000;69:795–827. doi: 10.1146/annurev.biochem.69.1.795. - DOI - PubMed
    1. Borah S., Shivarathri R., Kaur R. The Rho1 GTPase-activating protein CgBem2 is required for survival of azole stress in Candida glabrata. J. Biol. Chem. 2011;286:34311–34324. doi: 10.1074/jbc.M111.264671. - DOI - PMC - PubMed
    1. He H., Huang J., Wu S., Jiang S., Liang L., Liu Y., Liu W., Xie L., Tao Y., Jiang Y., et al. The roles of GTPase-activating proteins in regulated cell death and tumor immunity. J. Hematol. Oncol. 2021;14:171. doi: 10.1186/s13045-021-01184-1. - DOI - PMC - PubMed
    1. Rami L., Auguste P., Thebaud N.B., Bareille R., Daculsi R., Ripoche J., Bordenave L. IQ domain GTPase-activating protein 1 is involved in shear stress-induced progenitor-derived endothelial cell alignment. PLoS ONE. 2013;8:e79919. - PMC - PubMed

MeSH terms

Substances

LinkOut - more resources