. 2022 Jul 8;23(14):7557.
doi: 10.3390/ijms23147557.

Large-Scale Multi-Omics Studies Provide New Insights into Blood Pressure Regulation

Affiliations

Large-Scale Multi-Omics Studies Provide New Insights into Blood Pressure Regulation

Zoha Kamali et al. Int J Mol Sci. .

Abstract

Recent genome-wide association studies uncovered part of blood pressure's heritability. However, there is still a vast gap between genetics and biology that needs to be bridged. Here, we followed up blood pressure genome-wide summary statistics of over 750,000 individuals, leveraging comprehensive epigenomic and transcriptomic data from blood with a follow-up in cardiovascular tissues to prioritise likely causal genes and underlying blood pressure mechanisms. We first prioritised genes based on coding consequences, multilayer molecular associations, blood pressure-associated expression levels, and coregulation evidence. Next, we followed up the prioritised genes in multilayer studies of genomics, epigenomics, and transcriptomics, functional enrichment, and their potential suitability as drug targets. Our analyses yielded 1880 likely causal genes for blood pressure, tens of which are targets of the available licensed drugs. We identified 34 novel genes for blood pressure, supported by more than one source of biological evidence. Twenty-eight (82%) of these new genes were successfully replicated by transcriptome-wide association analyses in a large independent cohort (n = ~220,000). We also found a substantial mediating role for epigenetic regulation of the prioritised genes. Our results provide new insights into genetic regulation of blood pressure in terms of likely causal genes and involved biological pathways offering opportunities for future translation into clinical practice.

Keywords: blood pressure; epigenome; functional enrichment; gene expression; genome.


Conflict of interest statement

The authors declare no conflict of interest.

Figures
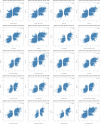
Figure A1
Figure A1
Correlation of effect estimates between eQTLGen dataset and significant (FDR < 0.05) eQTLs from 48 GTEx tissues. Two numbers are reported above each plot: ‘Significant in both’ indicates the percentage of genome-wide significant (GW-sig) eQTLs in each tissue that are also GW-sig in eQTLGen; ‘Significant in eQTLGen’ indicates the percentage of FDR-significant eQTLs of each tissue that that reach GW-sig only in eQTLGen. Palindromic SNPs were removed prior to comparison.
Figure A1
Figure A1
Correlation of effect estimates between eQTLGen dataset and significant (FDR < 0.05) eQTLs from 48 GTEx tissues. Two numbers are reported above each plot: ‘Significant in both’ indicates the percentage of genome-wide significant (GW-sig) eQTLs in each tissue that are also GW-sig in eQTLGen; ‘Significant in eQTLGen’ indicates the percentage of FDR-significant eQTLs of each tissue that that reach GW-sig only in eQTLGen. Palindromic SNPs were removed prior to comparison.
Figure 1
Figure 1
Summary of the methods as well as the main results of prioritization and follow-up analyses using blood pressure GWAS summary statistics. Pink boxes with dashed borders represent methods and their underlying boxes with gray border detail the tools. Pink boxes with solid black borders represent results and their underlying boxes with gray border provide small pictures of results. High resolution figures of heatmap and graphs can be found at the results section. BP: blood pressure; GWAS: genome-wide association study; TWAS: transcriptome-wide association study; nsSNPs: nonsynonymous single nucleotide polymorphisms; MX: MetaXcan; SMR: summary data-based Mendelian randomization; mQTL: methylation quantitative trait loci; eQTL: expression quantitative trait loci; CVS: cardiovascular system.
Figure 2
Figure 2
In silico lookup of BP loci associated with different molecular traits at the genome-wide significance level (p < 5 × 10⁻⁸; from QTL tests). The outer layer represents the genomic position of variants with QTL associations and is split up into 22 chromosomes with banded colours showing the cytobands. The inner layers with red lines (from the outer one to the inner one) are as follows: DNA methylation, transcription, protein, and metabolite levels. The height of the red lines is representative of −log10(P). The seven assigned loci are those with evidence of simultaneous associations with all four molecular traits.
Figure 3
Figure 3
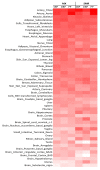
Average Z squares of the genes’ associations with BP traits across 48 GTEx tissues using both MetaXcan (MX) and summary data-based MR (SMR) TWAS. Colour intensity set to higher values. The order of tissues is based on the mean of the average Z squares of the genes across BP traits and the two TWAS approaches.
Figure 4
Figure 4
Hierarchical relationships of the top 10 enriched pathways for BP in a Gene Ontology (GO) tree. Black connectors mean “is a” and blue connectors mean “part of”. Coloured in red are the top 10 significantly enriched (FDR < 0.01) GO terms.
Figure 5
Figure 5
Network plot showing significantly enriched pathways resulting from DEPICT gene set enrichment analysis (FDR < 0.01) and clustered based on coregulation data provided by DEPICT. The outer layer contains pathways with the centrality degree ≤ 10, the middle—with the centrality degree of 10 < x ≤ 20, and the central circle contains pathways with the highest degree (>20), meaning the largest number of connections, which imply their importance in network survival. Among all, heart development has the maximum degree and the lowest p-value. Nodes are colour-coded based on the p-value.
Figure 6
Figure 6
Comparison of the physical distance of 219 genes with and 613 genes without any functional evidence (A), as well as of 219 genes with different sources of evidence (B) to their nearest DNA methylation (DNAm) sites. DNAm signals are generated by the MSMR analysis (SMR analysis of GWAS vs. mQTL) and are mapped to their nearest genes based on Ensemble GRCh37 release 98.
Figure 7
Figure 7
Potential regulatory mechanism for UTP11L through which a BP-associated variant controls BP-associated gene expression. SNP rs4360494 is positively correlated with the expression of UTP11L. At the same time, this SNP is inversely associated with the methylation level of three sites at the promoter and the early sequence of this gene as well as the upstream enhancer and an active CTCF-binding site. The overall hypothesis is that rs4360494 regulates gene expression by controlling the methylation of the promoter and the enhancer as well as the CTCF-binding site. CTCF increases the expression of UTP11L in the presence of the rs4360494 G allele by involving enhancer activity through DNA remodelling, and disruption of CTCF binding due to the methylated DNA in the presence of the rs4360494 C allele decreases the expression of the UTP11L gene.

References

    1. WHO|A Global Brief on Hypertension. [(accessed on 25 June 2019)]. Available online: https://www.who.int/cardiovascular_diseases/publications/global_brief_hy...
    1. Doris P.A. The Genetics of Blood Pressure and Hypertension: The Role of Rare Variation. Cardiovasc. Ther. 2011;29:37–45. doi: 10.1111/j.1755-5922.2010.00246.x. - DOI - PMC - PubMed
    1. Wang X., Snieder H. Heritability and Familial Aggregation of Blood Pressure. In: Flynn J.T., Ingelfinger J.R., Redwine K.M., editors. Pediatric Hypertension. Springer International Publishing; Cham, Switzerland: 2018. pp. 159–176.
    1. Ehret G.B., Ferreira T., Chasman D.I., Jackson A.U., Schmidt E.M., Johnson T., Thorleifsson G., Luan J., Donnelly L.A., Kanoni S., et al. The Genetics of Blood Pressure Regulation and Its Target Organs from Association Studies in 342,415 Individuals. Nat. Genet. 2016;48:1171–1184. doi: 10.1038/ng.3667. - DOI - PMC - PubMed
    1. Hoffmann T.J., Ehret G.B., Nandakumar P., Ranatunga D., Schaefer C., Kwok P.-Y., Iribarren C., Chakravarti A., Risch N. Genome-Wide Association Analyses Using Electronic Health Records Identify New Loci Influencing Blood Pressure Variation. Nat. Genet. 2017;49:54–64. doi: 10.1038/ng.3715. - DOI - PMC - PubMed

LinkOut - more resources