. 2022 Jul 11;23(14):7640.
doi: 10.3390/ijms23147640.

Phagocytosis of Erythrocytes from Gaucher Patients Induces Phenotypic Modifications in Macrophages, Driving Them toward Gaucher Cells

Affiliations

Phagocytosis of Erythrocytes from Gaucher Patients Induces Phenotypic Modifications in Macrophages, Driving Them toward Gaucher Cells

Lucie Dupuis et al. Int J Mol Sci. .

Abstract

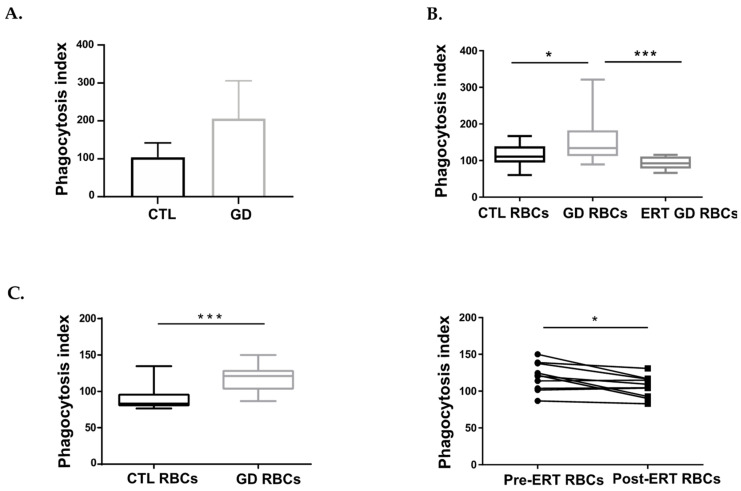
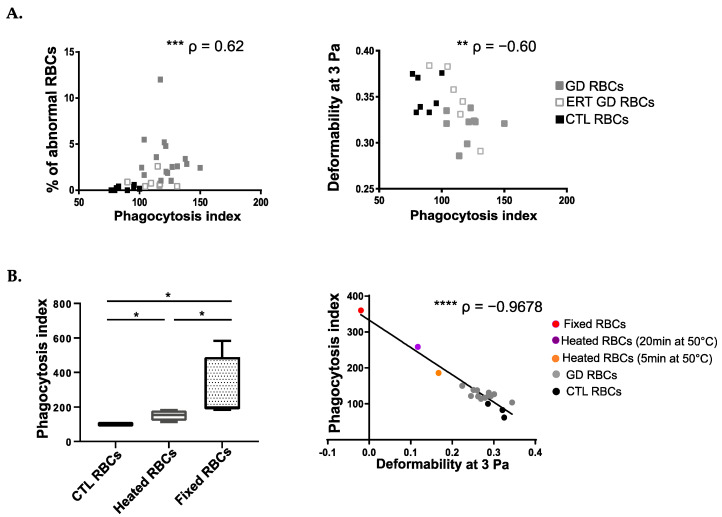
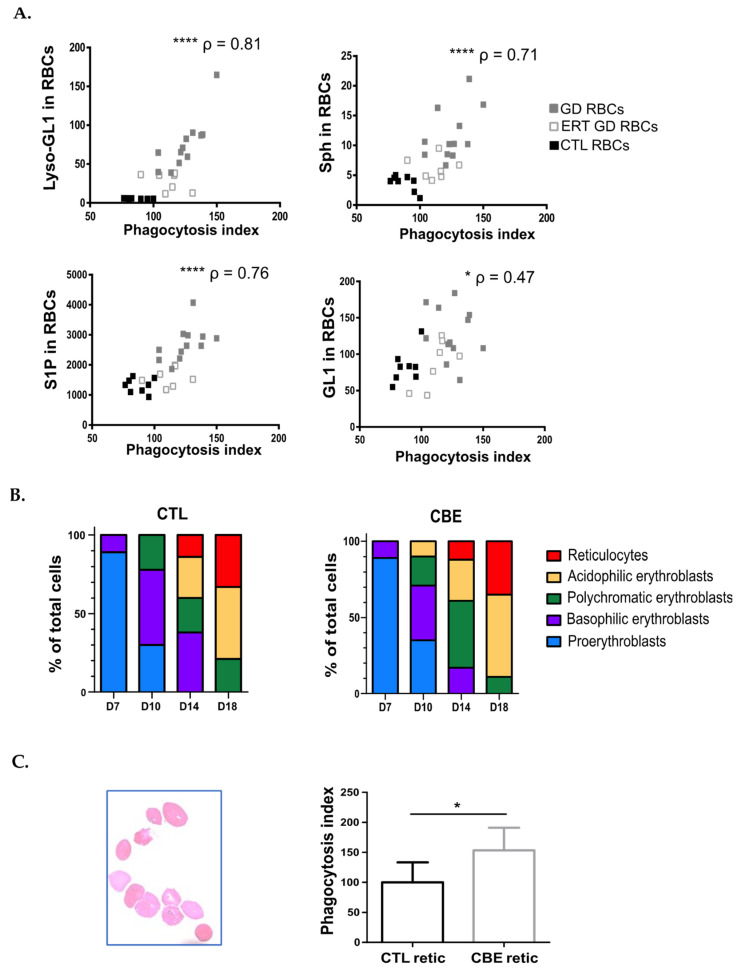
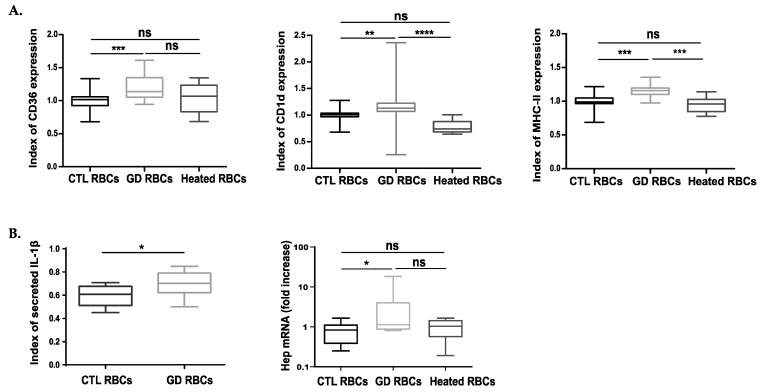
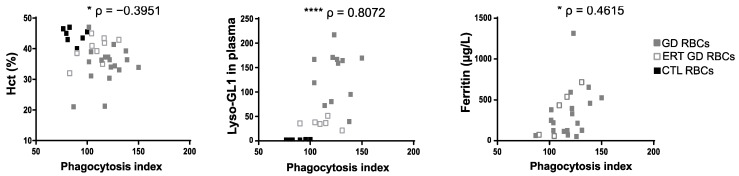
Gaucher disease (GD) is caused by glucocerebrosidase deficiency leading to the accumulation of sphingolipids in macrophages named "Gaucher's Cells". These cells are characterized by deregulated expression of cell surface markers, abnormal secretion of inflammatory cytokines, and iron sequestration. These cells are known to infiltrate tissues resulting in hematological manifestations, splenomegaly, and bone diseases. We have already demonstrated that Gaucher red blood cells exhibit altered properties suggesting their key role in GD clinical manifestations. We hypothesized that Gaucher's erythrocytes could be prone to premature destruction by macrophages contributing to the formation of altered macrophages and Gaucher-like cells. We conducted in vitro experiments of erythrophagocytosis using erythrocytes from Gaucher's patients or healthy donors. Our results showed an enhanced erythrophagocytosis of Gaucher red blood cells compared to healthy red blood cells, which is related to erythrocyte sphingolipids overload and reduced deformability. Importantly, we showed elevated expression of the antigen-presenting molecules CD1d and MHC-II and of the iron-regulator hepcidin in macrophages, as well as enhanced secretion of the pro-inflammatory cytokine IL-1β after phagocytosis of GD erythrocytes. These results strongly suggested that erythrophagocytosis in GD contribute to phenotypic modifications in macrophages. This present study shows that erythrocytes-macrophages interactions may be crucial in GD pathophysiology and pathogenesis.

Keywords: Gaucher disease; erythrophagocytosis; macrophages; red blood cells.


Conflict of interest statement

The authors declare no conflict of interest.

Figures

Figure 1
Figure 1
GD RBCs exhibit higher phagocytosis index (PI) by macrophages than CTL RBCs. (A) Erythrophagocytosis assays were performed using primary macrophages derived from healthy donor’s monocytes (CTL) or monocytes-derived macrophages from untreated GD patients (GD) and polarized toward the M2 phenotype. CTL macrophages were co-incubated with the autologous CTL RBCs (n = 3) and GD macrophages were co-incubated with the autologous GD RBCs (n = 3). The chart represents the PI of CTL and GD samples. The means and standard deviation are represented. (B) Erythrophagocytosis assays were performed using primary macrophages derived from healthy donor monocytes and polarized toward the M2 phenotype. The chart represents the PI of CTL samples (CTL RBCs; n = 15) and untreated GD samples (GD RBCs; n = 15), and treated GD samples (ERT GD RBCs, n = 8). Group comparison was performed using a Mann-Whitney test. The medians are represented as horizontal bars; the upper and lower quartiles are represented as the top and the bottom of the box, respectively; and the maximum and minimum data values are shown by dashes at the top and the bottom, respectively, of the whiskers. * p < 0.05; *** p < 0.001. (C) Left panel: Erythrophagocytosis assays were performed using THP1-derived macrophages co-incubated with CTL RBCs (n = 11) or GD RBCs (n = 18). The chart represents the PI of CTL and GD RBCs obtained for this cohort. Group comparison was performed using a Mann-Whitney test. The medians are represented as horizontal bars; the upper and lower quartiles are represented as the top and the bottom of the box, respectively; and the maximum and minimum data values are shown by dashes at the top and the bottom, respectively, of the whiskers. *** p < 0.001. Right panel: Erythrophagocytosis assays were performed using THP1-derived macrophages. The effect of ERT treatment on the PI was evaluated for RBCs from 10 patients before (Pre-ERT RBCs) and after (Post-ERT RBCs) ERT treatment (longitudinal study). Group comparison was performed using a paired t-test. * p < 0.05.
Figure 2
Figure 2
The uptake of GD RBCs correlates with cell deformability and morphology. (A) Left panel: Positive correlation between the PI and the percentage of abnormal morphologies of RBCs. Right panel: Negative correlation between the PI and the deformability of RBCs at 3 Pa. GD, ERT GD, and CTL RBCs values are depicted with gray, white and dark squares, respectively. The p and ρ values were determined using the Spearman rank correlation test. ** p < 0.01; *** p < 0.001. (B) Left panel: Erythrophagocytosis assays were performed using THP1-derived macrophages co-incubated with untreated CTL RBCs (n = 4) or CTL RBCs (n = 4) artificially made less deformable after heating for 20 min at 50 °C or after fixation with glutaraldehyde at 0.025% (n = 4). The chart represents the PI. The medians are represented as horizontal bars; the upper and lower quartiles are represented as the top and the bottom of the box, respectively; and the maximum and minimum data values are shown by dashes at the top and the bottom, respectively, of the whiskers. Group comparison 2 by 2 was performed using a Mann-Whitney test. * p < 0.05. Right panel: Negative correlation between the PI and the deformability of RBCs at 3 Pa (n = 19). CTL RBCs, GD RBCs, and CTL RBCs artificially made less deformable after heating for 5 min or for 20 min at 50 °C or after fixation with glutaraldehyde were used. The p and ρ values were determined using the Pearson correlation test. **** p < 0.0001.
Figure 3
Figure 3
Sphingolipids overload of RBCs enhances their erythrophagocytosis. (A) Positive correlations between the PI and the sphingolipids content measured in RBCs (Lyso-GL1, Sph, S1P, and GL1). GD, ERT GD, and CTL RBCs values are depicted with gray, white and dark squares, respectively. The p and ρ values were determined using the Spearman rank correlation test. * p < 0.05; **** p < 0.0001. (B) Proportion of erythroid progenitors on days 7, 10, 14, and 18 of the erythroid differentiation performed without (left panel) or with CBE (right panel). Morphological analysis after May-Grünwald-Giemsa (MGG) staining was analyzed. (C) Left panel: Observation after MGG staining of reticulocytes sorted after 18-days of erythroid differentiation. Right panel: Erythrophagocytosis assays were performed using THP1-derived macrophages co-incubated with sorted reticulocytes obtained after 18 days of erythroid differentiation without (CTL retic; n = 5) or with (CBE retic; n = 5) CBE. The chart represents the PI. The means and standard deviation are represented. Group comparison was performed using a Mann-Whitney test. * p < 0.05.
Figure 4
Figure 4
The phagocytosis of GD RBCs induces phenotypic modifications of macrophages toward Gaucher cells phenotype. (A) The expression of different markers was investigated at the surface of THP1-derived macrophages after 12 h of phagocytosis of CTL (n = 20), GD (n = 18), or CTL Heated (n = 8) RBCs. The expression levels of the phagocytic marker CD36, as well as the immunological markers MHC-II and CD1d antigen, were evaluated by flow cytometry. The charts represent the index of marker expression. Group comparison was performed using a Kruskal-Wallis test for CD1d and CD36 and an ordinary one-way ANOVA for MHC-II. ** p < 0.01; *** p < 0.001; **** p < 0.0001. ns = non-significant. (B) Left panel: Secretion levels of IL-1β were measured by ELISA. The charts represent the index of secreted cytokine in the supernatant of macrophages having engulfed CTL (n = 12) or GD (n = 13) RBCs. Group comparison was performed using an unpaired t-test. * p < 0.05. Right panel: hepcidin mRNA (Hep) quantification by qRT-PCR in macrophages 3 h after phagocytosis of CTL (n = 7) or GD (n = 7) RBCs. The charts represent the fold increase quantification of hepcidin mRNA compared to the quantification assessed in macrophages before erythrophagocytosis. Group comparison was performed using a Kruskal-Wallis test. * p < 0.05. ns = non-significant. The medians are represented as horizontal bars; the upper and lower quartiles are represented as the top and the bottom of the box, respectively; and the maximum and minimum data values are shown by dashes at the top and the bottom, respectively, of the whiskers.
Figure 5
Figure 5
The enhanced phagocytosis of GD RBCs correlates with markers of disease activity. The PI of RBCs negatively correlated with the percentage of the hematocrit (Hct) (left panel) and positively correlated with the Lyso-GL1 (middle panel) and ferritin (right panel) plasmatic concentration. GD, ERT GD, and CTL RBCs values are depicted with gray, white and dark squares, respectively. The p and ρ values were determined using the Spearman rank correlation test. * p < 0.05; **** p < 0.0001.

Similar articles

Cited by

References

    1. Cox T.M., Schofield J.P. Gaucher’s disease: Clinical features and natural history. Baillieres Clin. Haematol. 1997;10:657–689. doi: 10.1016/S0950-3536(97)80033-9. - DOI - PubMed
    1. Grabowski G.A. Phenotype, diagnosis, and treatment of Gaucher’s disease. Lancet. 2008;372:1263–1271. doi: 10.1016/S0140-6736(08)61522-6. - DOI - PubMed
    1. Stowens D.W., Teitelbaum S.L., Kahn A.J., Barranger J.A. Skeletal complications of Gaucher disease. Medicine. 1985;64:310–322. doi: 10.1097/00005792-198509000-00003. - DOI - PubMed
    1. Barton N.W., Brady R.O., Dambrosia J.M., Di Bisceglie A.M., Doppelt S.H., Hill S.C., Mankin H.J., Murray G.J., Parker R.I., Argoff C.E., et al. Replacement therapy for inherited enzyme deficiency-macrophage-targeted glucocerebrosidase for Gaucher’s disease. N. Engl. J. Med. 1991;324:1464–1470. doi: 10.1056/NEJM199105233242104. - DOI - PubMed
    1. Boven L.A., van Meurs M., Boot R.G., Mehta A., Boon L., Aerts J.M., Laman J.D. Gaucher cells demonstrate a distinct macrophage phenotype and resemble alternatively activated macrophages. Am. J. Clin. Pathol. 2004;122:359–369. doi: 10.1309/BG5VA8JRDQH1M7HN. - DOI - PubMed