. 2022 Jul 11;23(14):7662.
doi: 10.3390/ijms23147662.

Nucleosome Assembly Protein 1, Nap1, Is Required for the Growth, Development, and Pathogenicity of Magnaporthe oryzae

Affiliations

Nucleosome Assembly Protein 1, Nap1, Is Required for the Growth, Development, and Pathogenicity of Magnaporthe oryzae

Qing Wang et al. Int J Mol Sci. .

Abstract

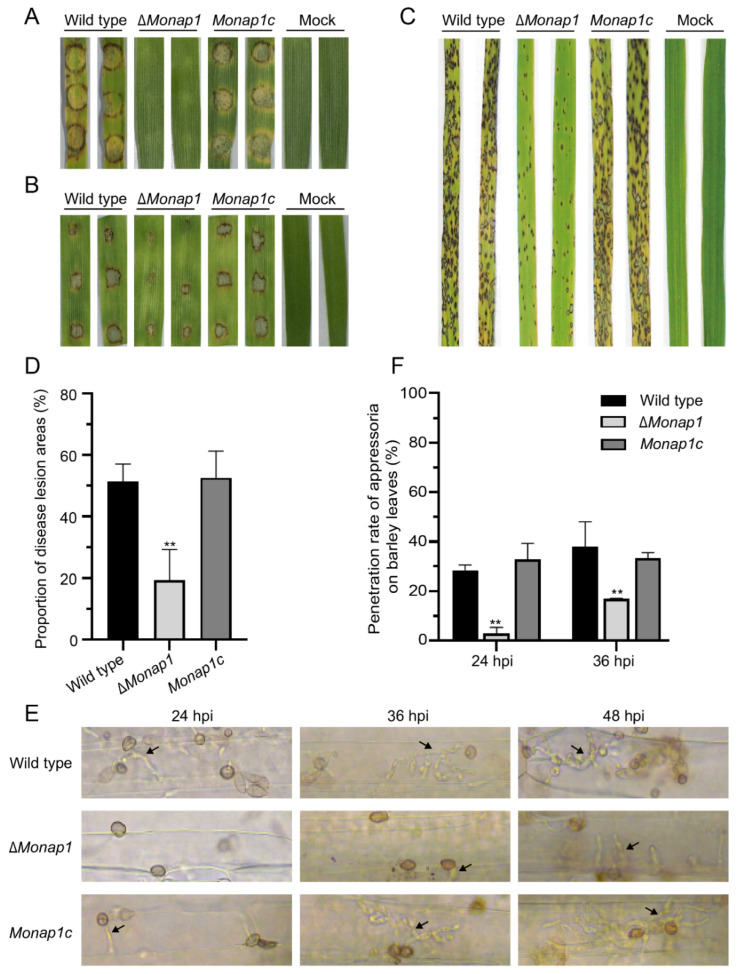
Magnaporthe oryzae is the causal agent of rice blast, leading to significant reductions in rice and wheat productivity. Nap1 is a conserved protein in eukaryotes involved in diverse physiological processes, such as nucleosome assembly, histone shuttling between the nucleus and cytoplasm, transcriptional regulation, and the cell cycle. Here, we identified Nap1 and characterized its roles in fungal development and virulence in M. oryzae. MoNap1 is involved in aerial hyphal and conidiophore differentiation, sporulation, appressorium formation, plant penetration, and virulence. ΔMonap1 generated a small, elongated, and malformed appressorium with an abnormally organized septin ring on hydrophobic surfaces. ΔMonap1 was more sensitive to cell wall integrity stresses but more resistant to microtubule stresses. MoNap1 interacted with histones H2A and H2B and the B-type cyclin (Cyc1). Moreover, a nuclear export signal (NES) domain is necessary for Nap1's roles in the regulation of the growth and pathogenicity of M. oryzae. In summary, NAP1 is essential for the growth, appressorium formation, and pathogenicity of M. oryzae.

Keywords: appressorium; cell wall integrity; histone; rice blast; septin ring; virulence.


Conflict of interest statement

The authors declare no conflict of interest.

Figures

Figure 1
Figure 1
Nap1s are conserved in eukaryotes. Alignment tree of MoNap1 and Nap1 in S. cerevisiae (NP_012974.1), Drosophila melanogaster (NP_477128.1), Homo sapiens (XP_016874829.1, NP_068798.1), Candida albicans (XP_718658.1), Schizosaccharomyces pombe (NP_587838.1), Aspergillus melleus (XP_045950078.1), Aspergillus clavatus (XP_001273890.1), Aspergillus fischeri (XP_001266074.1), Aspergillus flavus (QRD88693.1), Aspergillus fumigatus (XP_754077.1), and Fusarium oxysporum (XP_031048533.1).
Figure 2
Figure 2
NAP1 is required for the growth and conidiation of M. royzae. (A) Colonies of the wild-type, ΔMonap1, and MoNAP1 complemented strains of ΔMonap1 (Monap1c). Bar, 1 cm. (B) Mycelial growth (cm) of the wild-type, ΔMonap1 and Monap1c colonies in CM. n = 5 independent biological replicates. Error bars represent the standard deviations. The data were analyzed by GraphPad Prism 8.0 and significant differences compared with the wild type were estimated by multiple t tests: ** p < 0.01. (C) Mycelial growth (cm) of the wild type, ΔMonap1 and Monap1c colonies in MM. n = 5 independent biological replicates. Error bars represent the standard deviations. The data were analyzed by GraphPad Prism 8.0 and significant differences compared with the wild type were estimated by multiple t tests: ns, p > 0.05. (D) Colonies of the wild type, ΔMonap1, and Monap1c in MM. Bar, 1 cm. (E) Conidiation of the wild type, ΔMonap1 and Monap1c strains in CM. n = 5 independent biological replicates. Error bars represent the standard deviations. The data were analyzed by GraphPad Prism 8.0 and significant differences compared with the wild type were estimated by multiple t tests: ** p < 0.01. (F) Conidiophore development of M. oryzae strains. Bar, 50 μm.
Figure 3
Figure 3
NAP1 is required for appressorium formation. (A) Appressorium formation in the wild-type, ΔMonap1 and Monap1c strains on hydrophobic surfaces at 24 hpi. Bar, 10 μm. (B) Abnormal appressoria rates (%) in the wild-type, ΔMonap1 and Monap1c strains. At least 150 spores were counted per replicate. n = 3 independent biological replicates. Error bars represent the standard deviations. The data were analyzed by GraphPad Prism 8.0 and significant differences compared with the wild type were estimated by multiple t tests: ** p < 0.01. (C) The appressorium diameter in the wild-type, ΔMonap1 and Monap1c strains at 24 hpi. At least 150 spores were counted per replicate. n = 3 independent biological replicates. Error bars represent the standard deviations. The data were analyzed by GraphPad Prism 8.0 and significant differences compared with the wild type were estimated by multiple t tests: ** p < 0.01. (D) Germ tube length (μm) in the wild-type, ΔMonap1 and Monap1c strains. Approximately 100 appressoria were photographed and measured using the software NIS-Elements D 3.2 in triplicate. At least 150 spores were counted per replicate. n = 3 independent biological replicates. Error bars represent the standard deviations. The data were analyzed by GraphPad Prism 8.0 and significant differences compared with the wild type were estimated by multiple t tests: ** p < 0.01. (E) Conidial germination rate (%) at 4 hpi and appressorium formation rate (%) at 24 hpi in the wild-type, ΔMonap1 and Monap1c strains. At least 150 spores were counted per replicate. n = 3 independent biological replicates. Error bars represent the standard deviations. The data were analyzed by GraphPad Prism 8.0 and significant differences compared with the wild type were estimated by multiple t tests: ns, p > 0.05, * p < 0.05.
Figure 4
Figure 4
NAP1 in S. cerevisiae can eliminate defects in the sporulation and virulence of ΔMonap1. (A) Colonies of the wild type, ΔMonap1, NAP1 in S. cerevisiae complemented ΔMonap1 strain (Ynap1c) and Monap1c strains. Bar, 1 cm. (B) Mycelial growth (cm) in the wild type, ΔMonap1, Ynap1c, and Monap1c strains. n = 5 independent biological replicates. Error bars represent the standard deviations. The data were analyzed by GraphPad Prism 8.0 and significant differences compared with the wild type were estimated by multiple t tests: ** p < 0.01. (C) Conidiation in the wild type, ΔMonap1, Ynap1c, and Monap1c strains. At least 150 spores were counted per replicate. n = 3 independent biological replicates. Error bars represent the standard deviations. The data were analyzed by GraphPad Prism 8.0 and significant differences compared with the wild type were estimated by multiple t tests: ** p < 0.01. (D) Disease symptoms on leaf explants of barley inoculated with mycelial plugs from wild type, ∆Monap1, Ynap1c, and Monap1c. The pictures were photographed at 4 dpi.
Figure 5
Figure 5
NAP1 is required for virulence. (A) Disease symptoms of leaf explants of barley inoculated with mycelial plugs from the wild-type, ∆Monap1 and Monap1c strains. The pictures were photographed at 4 dpi. (B) Disease symptoms of leaf explants of barley inoculated with spore suspensions (5 × 10⁴ conidia mL−1). (C) Two-week-old rice seedlings were inoculated by spraying 5 × 10⁴ conidia mL−1 conidial suspensions from the wild type, ∆Monap1 and the complemented strain. Lesion severity on rice leaves was evaluated at 7 dpi. (D) The proportion of disease lesion areas (%) caused by the wild type, ∆Monap1, and Monap1c strains on rice seedlings. The area occupied by disease spots per 5 cm of rice leaves was counted. At least 20 leaves were counted per replicate. n = 3 independent biological replicates. Error bars represent the standard deviations. The data were analyzed by GraphPad Prism 8.0 and significant differences compared with the wild type were estimated by multiple t tests: ** p < 0.01. (E) Invasive growth of M. oryzae. Barley leaf explants were inoculated with 20 μL of conidial suspension (5 × 10⁴ conidia mL−1) and cultured for 24 h, 36 h, and 48 h. The arrows indicate invasive hyphae. (F) Penetration rate (%) of the wild type, ∆Monap1 and Monap1c appressoria on barley leaves. At least 150 appressoria were counted per replicate. n = 3 independent biological replicates. Error bars represent the standard deviations. The data were analyzed by GraphPad Prism 8.0 and significant differences compared with the wild type were estimated by multiple t tests: ** p < 0.01.
Figure 6
Figure 6
MoNAP1 is involved in the cell wall integrity (CWI) pathway and microtubule dynamics. (A) Mycelial colonies of the wild type, ∆Monap1 and Monap1c strains cultured in CM containing 75 μg mL−1 CFW, 600 μg mL−1 CR, 0.004% SDS, 35 μg mL−1 BLM, 15 μg mL−1 benomyl, and 2 mM HU in darkness at 25 °C for 9 days. For the temperature-sensitivity assay, the wild type, ∆Monap1 and Monap1c strains were cultured in CM at 25 °C or 32 °C under a 16 h light and 8 h dark cycle for 9 d. (B) Relative growth rate (%) of mycelial colonies in 75 μg mL−1 CFW, 600 μg mL−1 CR, 0.004% SDS and 35 μg mL−1 BLM, 15 μg mL−1 benomyl, 2 mM HU and 32 °C growing conditions. n = 5 independent biological replicates. Error bars represent the standard deviations. The data were analyzed by GraphPad Prism 8.0 and significant differences compared with the wild type were estimated by multiple t tests: ** p < 0.01.
Figure 7
Figure 7
Monap1 exhibits impaired septin organization. Expression of Sep3-GFP (upper panel) and Sep5-GFP (lower panel) in appressoria of M. oryzae in the wild type and ∆Monap1 mutant at 24 hpi. The septin ring showed aberrant distribution and organization in ∆Monap1. The distribution of the fluorescence signal in a transverse section (indicated by the yellow line) was analyzed by ImageJ software. Bar, 5 μm.
Figure 8
Figure 8
MoNap1 interacted with H2A, H2B, and Cyc1. (A) Pull-down results between FLAG-MoNap1 and GST-H2A or GST-H2B in E. coli BL21. FLAG-MoNap1 was detected in GST-H2A and GST-H2B eluents but not in GST eluents. Asterisks represent the bands of GST-H2A (41.27 kDa) or GST-H2B (42.82 kDa). (B) Visualization of the MoNap1-H2A interaction using a BiFC assay. YFP signals were observed in vegetative hyphae in the transformant harboring MoNap1-YFPCTF and YFPNTF-H2A. No detectable YFP signals were observed in the negative control transformants harboring MoNAP1-YFPCTF and YFPNTF or YFPCTF and YFPNTF-H2A. (C) Pull-down results between FLAG-MoNap1 and GST-Cyc1. FLAG-MoNap1 was detected in the GST-Cyc1 eluent but not in the GST eluent.
Figure 9
Figure 9
Subcellular localization of MoNap1 in M. oryzae. (A) Fluorescence signals of MoNap1-GFP in conidial, appressorial and hyphal cells. Bar, 5 μm. (B) Fluorescence signals of MoNap1-GFP and H2B-mCherry under LMB treatment in conidia and appressoria. Bar, 5 μm.
Figure 10
Figure 10
The NES region is not involved in H2A/H2B binding but is indispensable for growth and pathogenicity. (A) NES-like sequences of NAP1. The NES-like sequences of yeast Nap1 (yNap1), nematode Nap1 (nNap1), Drosophila Nap1 (dNap1), human Nap1 (hNap1) and MoNap1 are aligned. Yellow highlights indicate conserved amino acids. (B) Fluorescence signals of MoNap1∆NES-GFP in appressoria. Bar, 5 μm. (C) Pull-down results between FLAG-MoNap1∆NES and GST-H2A and GST-H2B in E. coli BL21. FLAG-MoNap1∆NES was detected in GST-H2A and GST-H2B eluents but not in GST eluents. Red asterisks represent the bands of GST-H2A (41.27 kDa), GST-H2B (41.82 kDa), and GST (26 kDa). (D) Colonies of the wild type and Monap1NES. Bar, 1 cm. (E) Mycelial growth (cm) of the wild type and Monap1NES colonies. n = 5 independent biological replicates. Error bars represent the standard deviations. The data were analyzed by GraphPad Prism 8.0 and significant differences compared with the wild type were estimated by multiple t tests: ** p < 0.01. (F) Disease symptoms of leaf explants of barley inoculated with mycelial plugs from the wild-type and Monap1∆NES strains. The pictures were photographed at 4 dpi.

References

    1. Talbot N.J. On the Trail of a Cereal Killer: Exploring the Biology of Magnaporthe grisea. Annu. Rev. Microbiol. 2003;57:177–202. doi: 10.1146/annurev.micro.57.030502.090957. - DOI - PubMed
    1. Hamer J.E., Talbot N.J. Infection-related development in the rice blast fungus Magnaporthe grisea. Curr. Opin. Microbiol. 1998;1:693–697. doi: 10.1016/S1369-5274(98)80117-3. - DOI - PubMed
    1. Hamer J.E., Howard R.J., Chumley F.G., Valent B. A Mechanism for Surface Attachment in Spores of a Plant Pathogenic Fungus. Science. 1988;239:288–290. doi: 10.1126/science.239.4837.288. - DOI - PubMed
    1. De Jong J.C., McCormack B.J., Smirnoff N., Talbot N.J. Glycerol generates turgor in rice blast. Nature. 1997;389:244–245. doi: 10.1038/38418. - DOI
    1. Gupta L., Vermani M., Ahluwalia S.K., Vijayaraghavan P. Molecular virulence determinants of Magnaporthe oryzae: Disease pathogenesis and recent interventions for disease management in rice plant. Mycology. 2021;12:174–187. doi: 10.1080/21501203.2020.1868594. - DOI - PMC - PubMed

Supplementary concepts

LinkOut - more resources