. 2022 Jul 12;23(14):7675.
doi: 10.3390/ijms23147675.

Pre-Omicron Vaccine Breakthrough Infection Induces Superior Cross-Neutralization against SARS-CoV-2 Omicron BA.1 Compared to Infection Alone

Affiliations

Pre-Omicron Vaccine Breakthrough Infection Induces Superior Cross-Neutralization against SARS-CoV-2 Omicron BA.1 Compared to Infection Alone

Eveline Santos da Silva et al. Int J Mol Sci. .

Abstract

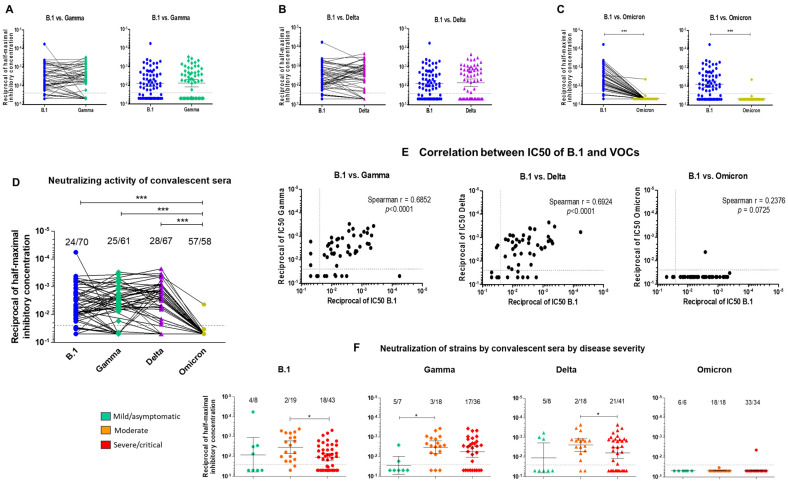
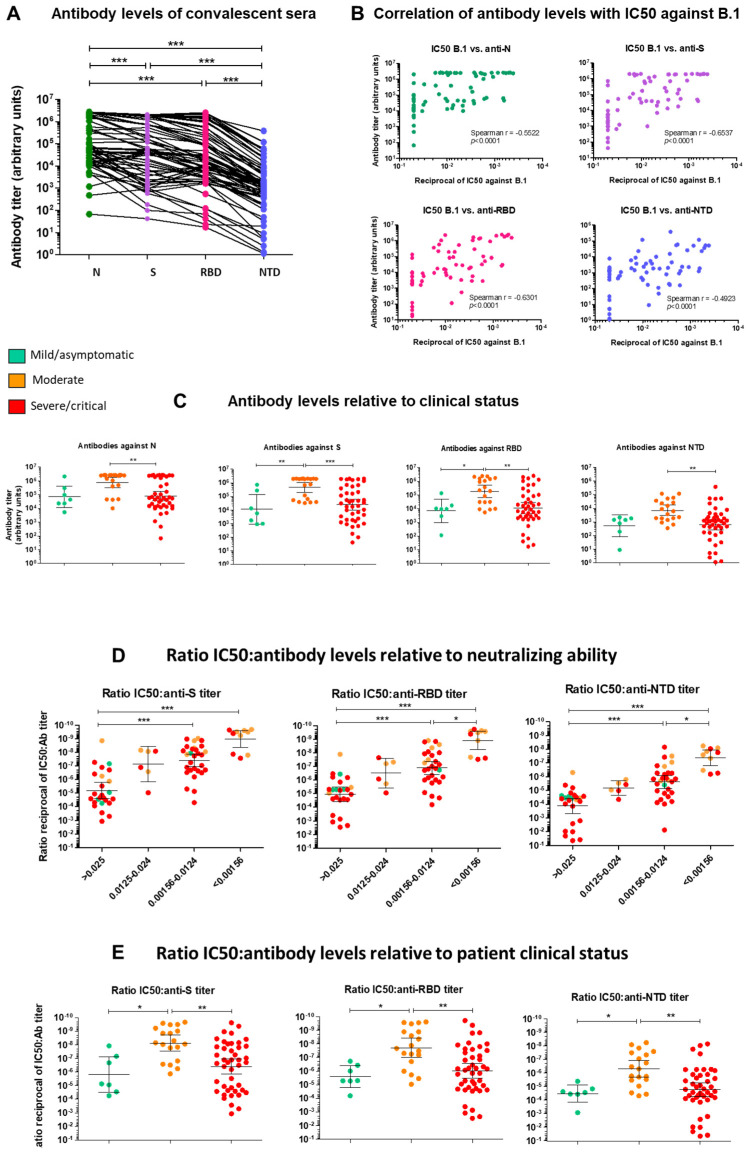
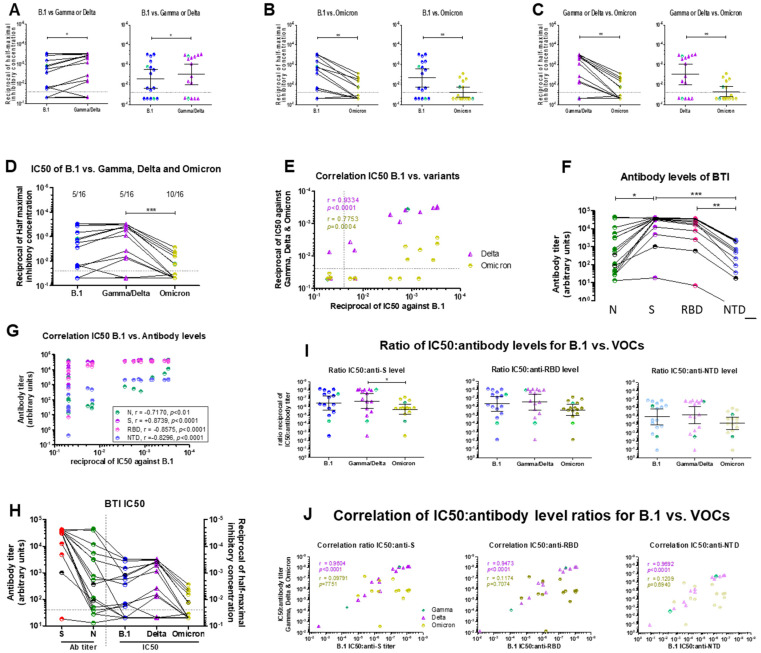
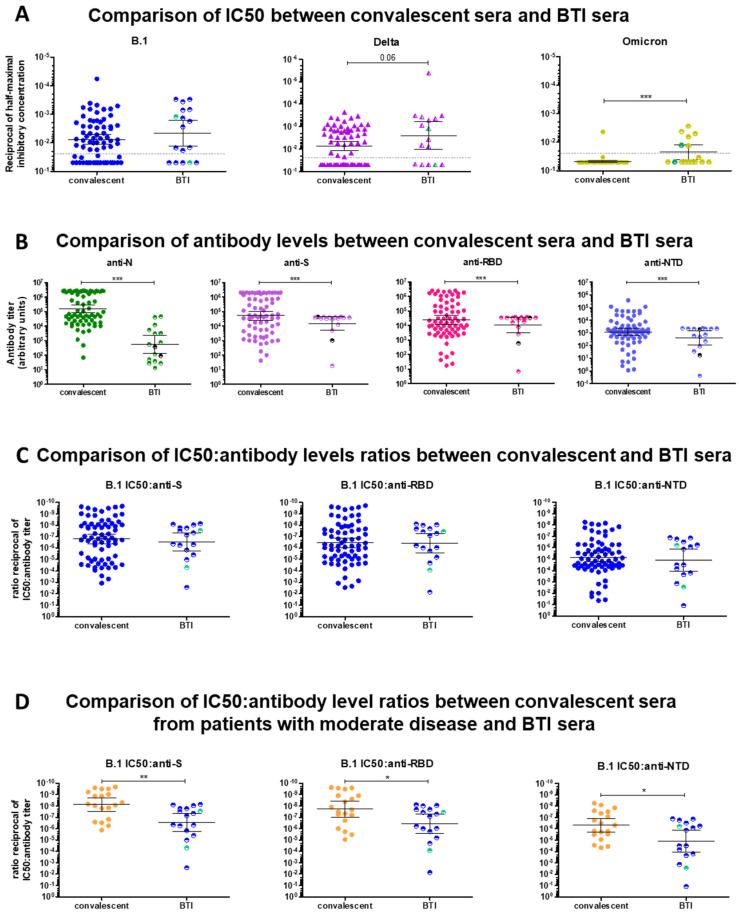
SARS-CoV-2 variants raise concern because of their high transmissibility and their ability to evade neutralizing antibodies elicited by prior infection or by vaccination. Here, we compared the neutralizing abilities of sera from 70 unvaccinated COVID-19 patients infected before the emergence of variants of concern (VOCs) and of 16 vaccine breakthrough infection (BTI) cases infected with Gamma or Delta against the ancestral B.1 strain, the Gamma, Delta and Omicron BA.1 VOCs using live virus. We further determined antibody levels against the Nucleocapsid (N) and full Spike proteins, the receptor-binding domain (RBD) and the N-terminal domain (NTD) of the Spike protein. Convalescent sera featured considerable variability in the neutralization of B.1 and in the cross-neutralization of different strains. Their neutralizing capacity moderately correlated with antibody levels against the Spike protein and the RBD. All but one convalescent serum failed to neutralize Omicron BA.1. Overall, convalescent sera from patients with moderate disease had higher antibody levels and displayed a higher neutralizing ability against all strains than patients with mild or severe forms of the disease. The sera from BTI cases fell into one of two categories: half the sera had a high neutralizing activity against the ancestral B.1 strain as well as against the infecting strain, while the other half had no or a very low neutralizing activity against all strains. Although antibody levels against the spike protein and the RBD were lower in BTI sera than in unvaccinated convalescent sera, most neutralizing sera also retained partial neutralizing activity against Omicron BA.1, suggestive of a better cross-neutralization and higher affinity of vaccine-elicited antibodies over virus-induced antibodies. Accordingly, the IC50: antibody level ratios were comparable for BTI and convalescent sera, but remained lower in the neutralizing convalescent sera from patients with moderate disease than in BTI sera. The neutralizing activity of BTI sera was strongly correlated with antibodies against the Spike protein and the RBD. Together, these findings highlight qualitative differences in antibody responses elicited by infection in vaccinated and unvaccinated individuals. They further indicate that breakthrough infection with a pre-Omicron variant boosts immunity and induces cross-neutralizing antibodies against different strains, including Omicron BA.1.

Keywords: Delta; Omicron BA.1; SARS-CoV-2; breakthrough infection; convalescent sera; neutralizing antibodies; variants of concern (VOCs).


Conflict of interest statement

The authors declare no conflict of interest.

Figures

Figure 1
Figure 1
Neutralizing activity of pre-VOC unvaccinated SARS-CoV-2-infected convalescent sera against ancestral and VOC strains. (AC). Pairwise comparison of half-maximal inhibitory concentrations (IC50) of B.1 (blue in each panel) with Gamma (green) (A), Delta (purple) (B) and Omicron (gold) (C). Serial two-fold dilutions (starting 1:40, grey dotted line on graph) of heat-inactivated convalescent sera were incubated for 1 h with 100 TCID50 of virus in viral growth medium. Vero-E6 cells (104 cells/ well) were infected with the virus/serum mixture for 72 h at 37 °C. Virus-induced cytophathic effect (CPE) was measured using the tetrazolium salt WST-8, which is transformed into a red substrate by live cells. Optical density at 570 nm was measured to monitor live cells (uninfected cells). All infections were performed in triplicate wells. Percent survival was calculated relative to uninfected cells (100% survival) and the half-maximal inhibitory concentration for serum (IC50) was determined by inferring the 4-parameter nonlinear regression curve fit (GraphPad Prism v5). The top (100% survival) and bottom (no serum) values were unconstrained. (D). Comparison of IC50 for all strains. The infecting strain is indicated on the x-axis with the following color codes: blue = B.1, green = Gamma, purple = Delta, gold = Omicron BA.1. The proportion of non-neutralizing sera is indicated above each data set. (E). Correlation between the IC50 of sera against B.1 (x-axis in each panel) and VOCs (y-axis in each panel). The Spearman correlation coefficient (r) is indicated in each panel (F). IC50 of convalescent sera against B.1 and VOCs for patients with mild/asymptomatic (green), moderate (orange) or severe/critical (red) forms of COVID-19. The infecting strain is indicated above each panel. For all analyses, differences between groups were compared using a Mann–Whitney U-test for comparison between two groups and a Kruskal–Wallis followed by a Dunn’s multiple comparison post-hoc test when three or more groups were compared. p-values < 0.05 were considered significant. *: p < 0.05; **: p < 0.01; ***: p < 0.001.
Figure 2
Figure 2
Serological characterization of convalescent sera. (A). Antibody levels in convalescent sera. Antibody levels against SARS-CoV-2 N (green), S (purple), the receptor-binding domain (RBD) (pink) or the N-terminal domain (NTD) (blue) of the Spike protein were measured in convalescent sera using the MSD V-plex platform for SARS-CoV-2. Antibody levels are reported as arbitrary units. (B). Correlation between half-maximal inhibitory concentration (IC50) of convalescent sera against B.1 (x-axis) and antibody levels against SARS-CoV-2 N, S, RBD and NTD (y-axis). The Spearman correlation coefficient (r) is indicated. (C). Antibody levels of convalescent sera stratified by disease severity. (D,E). Ratios of IC50 against B.1 to antibody levels against S, RBD and NTD stratified according to neutralizing activity (D) or to patient clinical status (E). For all analyses, differences between groups were compared using a Mann–Whitney U-test for comparison between two groups and a Kruskal–Wallis followed by a Dunn’s multiple comparison post-hoc test when three or more groups were compared. p-values < 0.05 were considered significant. *: p < 0.05; **: p < 0.01; ***: p < 0.001.
Figure 3
Figure 3
Neutralizing activity and serology of sera from vaccinated breakthrough infections (BTIs) against B.1, Gamma, Delta and Omicron BA.1. (AC). Pairwise comparison of neutralization of B.1, Gamma, Delta and Omicron. Serial two-fold dilutions (starting 1:40, grey dotted line) of heat-inactivated sera from BTI cases collected around the time of infection were incubated for 1 h with 100 TCID50 of representative ancestral D614G (B.1), Gamma, Delta or Omicron BA.1 SARS-CoV-2 strains in viral growth medium. The infecting strain is indicated on the x-axis. Vero-E6 cells (104 cells/ well) were infected with the mixture for 72 h. Virus-induced CPE was measured using the tetrazolium salt WST-8 as above. All infections were performed in triplicate wells. Percent survival was calculated relative to uninfected cells (100% survival) and the half-maximal inhibitory concentration for serum (IC50) was determined by inferring the 4-parameter nonlinear regression curve fit (GraphPad Prism v5). The top (100% survival) and bottom (no serum) values were unconstrained. IC50s for Gamma-BTI and Delta-BTI are grouped. Gamma-BTI sera are represented in green in each panel and were exposed to B.1, Gamma or Omicron BA.1. Delta-BTI sera are represented in blue, purple or gold for exposure to B.1 (blue), Delta (purple) or Omicron BA.1 (gold). (D). Comparison of IC50 for all strains. The infecting strain is indicated on the x-axis. The green symbols represent Gamma-BTI sera exposed to the indicated virus strain (B.1, Gamma or Omicron BA.1). The proportion of non-neutralizing sera is indicated above each data set. (E) Correlations between half-maximal inhibitory concentration (IC50) against B.1 (x-axis) and VOCs (y-axis) Gamma (green diamonds), Delta (purple triangles) and Omicron BA.1 (gold circles). The Spearman correlation coefficient (r) is indicated in purple for Gamma/Delta and in gold for Omicron in the panel. (F). Serology of BTI sera. Antibodies against SARS-CoV-2 N (Nucleocapsid), S (Spike), the Spike RBD or the Spike NTD were measured using the MSD V-Plex COVID-19 Coronavirus Panel 1 serology kit. Antibody levels are reported as arbitrary units. Sera from BTI cases infected with Gamma are in black; those infected with Delta are colored. (G). Correlation between IC50 against B.1 (x-axis) and antibody levels (y-axis) (green = anti-N, purple anti-S, pink = anti-RBD, blue = anti-NTD). The Spearman correlation coefficients (r) are indicated in the box. (H). Anti-S and anti-N antibody levels (left y-axis and left side of the panel) and half-maximal inhibitory concentrations (IC50) of BTI sera against B.1 (blue), Gamma/Delta (green or purple, respectively) and Omicron (gold) (right y-axis and right side of the panel). For IC50s, the infecting strain is indicated on the x-axis. Gamma BTI-sera are highlighted in black in all cases. (I). Ratios of IC50 against B.1 (blue circles), Gamma (green diamonds), Delta (purple triangles) and Omicron (gold circles) divided by antibody levels against S, RBD and NTD in BTI sera. The infecting strain is indicated on the x-axis. Gamma-BTI sera are always indicated in green and Delta-BTI sera are in blue for exposure to B.1, purple for Delta and gold for Omicron BA1. (J). Correlations between ratios of IC50:antibody (Ab) levels against S, RBD and NTD for BTI sera against B.1 (x-axis) and VOCs (y-axis). Color code: B.1: blue circles; Gamma: green diamonds, Delta: purple triangles, Omicron BA.1: gold circles. In all cases, green symbols represent Gamma-BTI exposed to B.1 (left panel), Gamma (middle panel) or Omicron BA.1 (right panel). For all analyses, differences between groups were compared using a Mann–Whitney U-test for comparison between two groups and a Kruskal–Wallis followed by a Dunn’s multiple comparison post-hoc test when three or more groups were compared. p-values < 0.05 were considered significant. *: p < 0.05; **: p < 0.01; ***: p < 0.001.
Figure 4
Figure 4
Comparison of neutralizing activities of BTI and convalescent sera against B.1, Gamma, Delta and Omicron. (A). Comparison of half-maximal inhibitory concentrations (IC50) of convalescent and BTI sera against B.1, Gamma/Delta and Omicron. The infecting strain is indicated above each panel. For BTI sera, the Gamma-BTI patients infected with Gamma are represented with green symbols and the Delta-BTI patients infected with Delta are represented with purple symbols. A pairwise comparison with Gamma was not possible since only two BTI infected with Gamma were available. The grey dotted line represents the 1:40 serum dilution cutoff. (B). Comparison of antibodies against N, S, RBD and NTD in BTI and convalescent sera. For BTI sera, the Gamma-BTI are represented with black circles and the Delta-BTI are represented in green for anti-N antibodies, purple for anti-S antibodies, pink for anti-RBD antibodies and blue for anti-NTD antibodies. (C). Comparison of the IC50:antibody (Ab) level ratios for BTI and convalescent sera. Cells were infected with B.1 and the IC50 of sera against B.1 is shown. For BTI sera, the Gamma-BTI are represented with green circles and the Delta BTI sera are represented with blue circles. (D). Comparison of the IC50:Ab level ratios for BTI and convalescent sera with moderate disease. Cells were infected with B.1 and the IC50 of sera against B.1 is shown. For BTI sera, the Gamma BTI sera are represented with green circles and the Delta BTI sera are represented with blue circles. For all analyses, differences between groups were compared using a Mann–Whitney U-test. p-values < 0.05 were considered significant. *: p < 0.05; **: p < 0.01; ***: p < 0.001.

References

    1. Korber B., Fischer W.M., Gnanakaran S., Yoon H., Theiler J., Abfalterer W., Hengartner N., Giorgi E.E., Bhattacharya T., Foley B., et al. Tracking Changes in SARS-CoV-2 Spike: Evidence that D614G Increases Infectivity of the COVID-19 Virus. Cell. 2020;182:812–827.e19. doi: 10.1016/j.cell.2020.06.043. - DOI - PMC - PubMed
    1. Kandpal M., Davuluri R.V. Identification of Geographic Specific SARS-Cov-2 Mutations by Random Forest Classification and Variable Selection Methods. Stat. Appl. 2020;18:253–268. - PMC - PubMed
    1. Lemieux J.E., Siddle K.J., Shaw B.M., Loreth C., Schaffner S.F., Gladden-Young A., Adams G., Fink T., Tomkins-Tinch C.H., Krasilnikova L.A., et al. Phylogenetic analysis of SARS-CoV-2 in Boston highlights the impact of superspreading events. Science. 2021;371:6529. doi: 10.1126/science.abe3261. - DOI - PMC - PubMed
    1. Yurkovetskiy L., Wang X., Pascal K.E., Tomkins-Tinch C., Nyalile T.P., Wang Y., Baum A., Diehl W.E., Dauphin A., Carbone C., et al. Structural and Functional Analysis of the D614G SARS-CoV-2 Spike Protein Variant. Cell. 2020;183:739–751.e738. doi: 10.1016/j.cell.2020.09.032. - DOI - PMC - PubMed
    1. Wallace D.J., Ackland G.J. Abrupt increase in the UK coronavirus deathcase ratio in December 2020. medRxiv. 2021 doi: 10.1101/2021.01.21.21250264. - DOI

Supplementary concepts