. 2022 Jul 15;23(14):7813.
doi: 10.3390/ijms23147813.

Modelling the Human Blood-Brain Barrier in Huntington Disease

Affiliations

Modelling the Human Blood-Brain Barrier in Huntington Disease

Domenico Vignone et al. Int J Mol Sci. .

Abstract

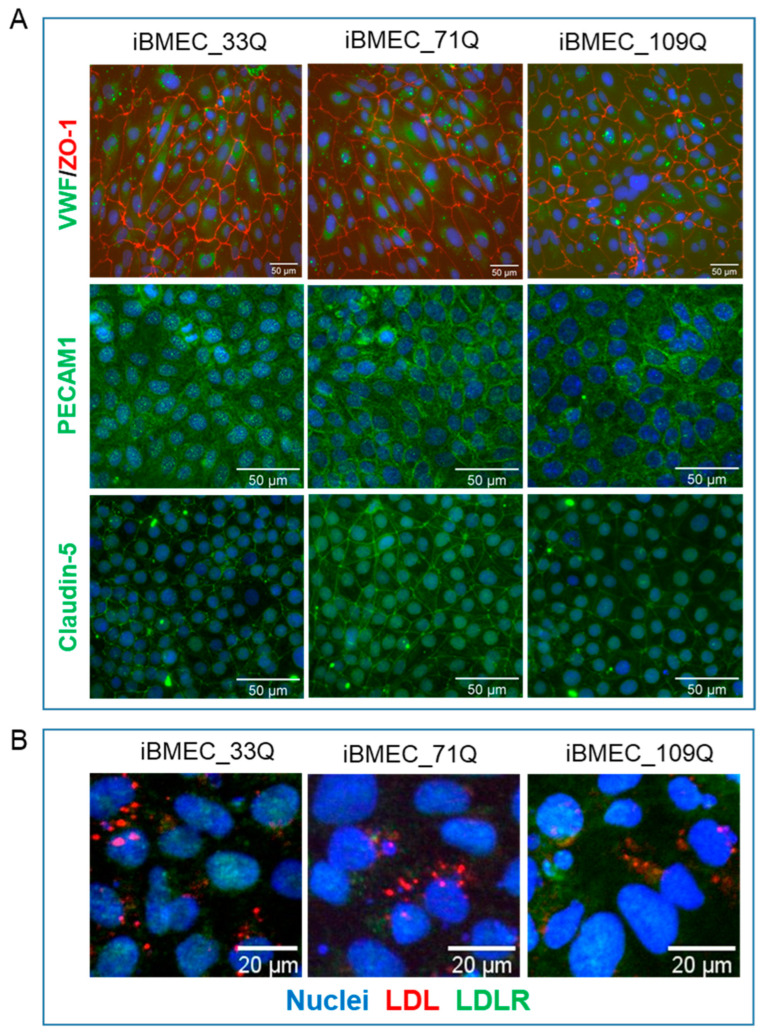
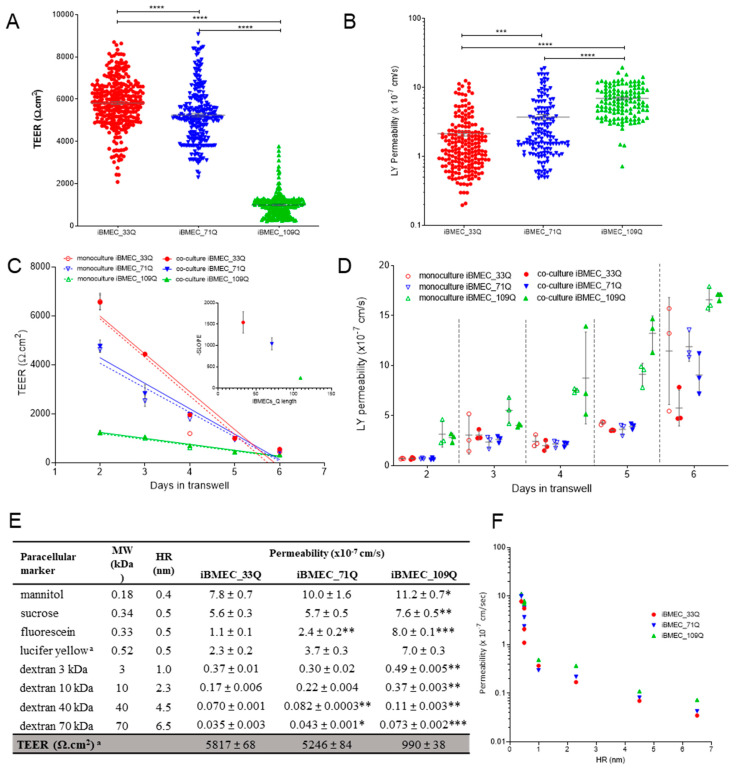
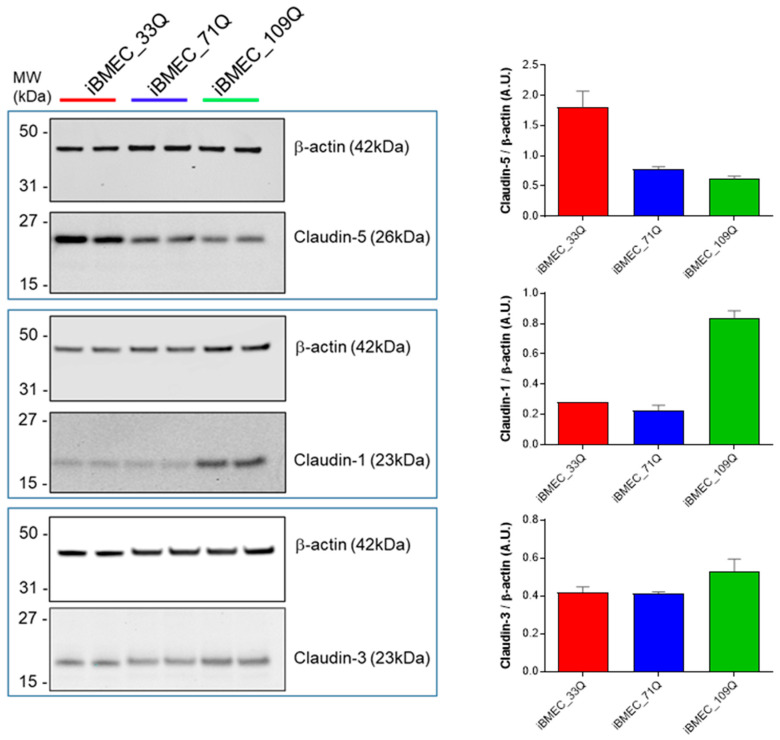
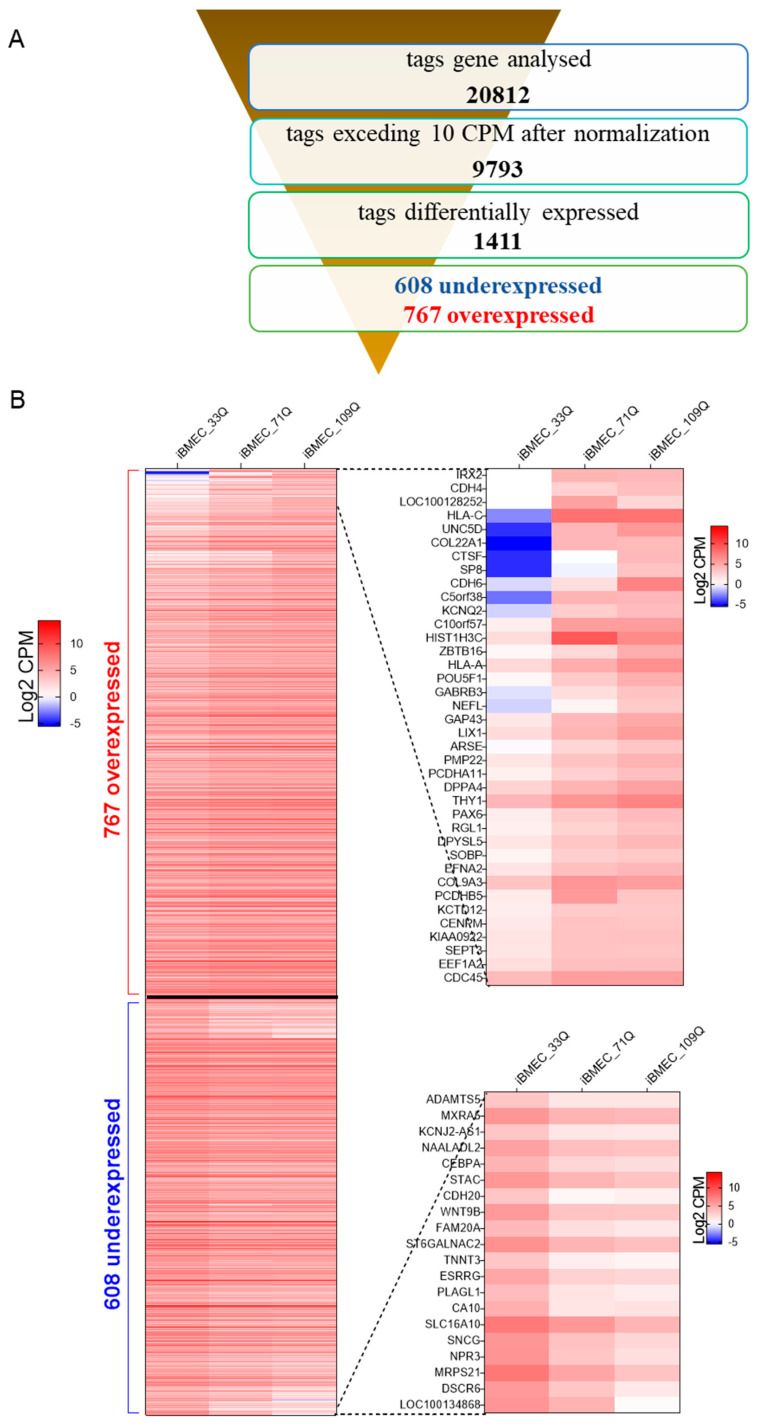
While blood-brain barrier (BBB) dysfunction has been described in neurological disorders, including Huntington's disease (HD), it is not known if endothelial cells themselves are functionally compromised when promoting BBB dysfunction. Furthermore, the underlying mechanisms of BBB dysfunction remain elusive given the limitations with mouse models and post mortem tissue to identify primary deficits. We established models of BBB and undertook a transcriptome and functional analysis of human induced pluripotent stem cell (iPSC)-derived brain-like microvascular endothelial cells (iBMEC) from HD patients or unaffected controls. We demonstrated that HD-iBMECs have abnormalities in barrier properties, as well as in specific BBB functions such as receptor-mediated transcytosis.

Keywords: Huntington’s disease; blood–brain barrier; brain endothelial cells; in vitro models; induced pluripotent stem cells; transport.


Conflict of interest statement

The authors declare no conflict of interest.

Figures

Figure 1
Figure 1
iPSC differentiation into iBMECs. (A) Scores box plot. View samples scores (colors) in relation to the range of scores for the undifferentiated reference set (gray) for cultured iPSC (empty circles), progenitors (D8), and iBMECs (D10) (filled circles). (B) Summary of gene expression level data in each category for the tree differentiation stages of the three cell lines. (C) Representative flow cytometry analysis of OCT4 during routine culture of iPSC and of VWF before final differentiation. (D) Analysis of mHTT and HTT expression in 33Q, 71Q, and 109Q iPSCs (left panels) and iBMECs (right panels) using 2B7-MW1 and 2B7-D7F7 Singulex assay, respectively. Curve fittings of the serially diluted samples (described by a four-parameter logistic curve fit) are shown in the top panels, mean ± sd of 3 replicates. The bar charts (bottom panels) reported the fold increase among the different samples (fixing 33Q as reference = 1) and were derived from the EC50 of the curve fittings above.
Figure 2
Figure 2
iPSC differentiation into iBMECs. (A). Representative immunofluorescence staining, at d1 co-culture in transwell filters, demonstrating the expression of endothelial relevant proteins: vWF, ZO-1, PECAM1, and Claudin-5. Nuclei were counterstained with Hoechst (blue). Scale bar represented 50 µm. (B) LDL uptake (in red) by iBMECs (at D10). In green, the intracellular distribution of LDLR was also reported (scale bar indicates 20 µm).
Figure 3
Figure 3
Barrier properties. (A) TEER measurements and (B) LY permeability at day 1 co-culture of independent samples, n > 100. Statistical analysis: two-way ANOVA followed by Bonferroni post hoc test, where *** p < 0.001 and **** p < 0.0001. (C) TEER as a function of time in mono- and co-culture with astrocytes and (D) corresponding LY permeability time-course in mono- and co-culture, n = 3. (E) Permeability in the BBB models of paracellular markers with different molecular weights (MW) and hydrodynamic radius (HR). Results are mean ± sd with n > 6 from at least two separated experiments. Statistical significance was analyzed by Student’s t-test against iBMEC_33Q: * p < 0.05; ** p < 0.01 and *** p < 0.001. a Statistics showed above (A,B). (F) Relationship of permeability and HR (nm) for paracellular markers listed in (E).
Figure 4
Figure 4
Claudins. Representative cropped Western blot confirming expression of Claudins 5, 1, and 3 in iBMECs. Β-actin was used as the loading control, and relative expressions are reported in the neighbouring bar charts.
Figure 5
Figure 5
RNA seq. (A) Overview of RNA-seq of the samples. The output value for the detected expression is the normalized counts per million (CPM). (B) (Left) Heat map (showed as Log2 of CPM, mean of three experimental replicates) of tagged differentially expressed genes, when both HD-iBMECs are overexpressed or underexpressed vs. healthy-iBMEC with statistical significance determined by Student’s t-test of p < 0.05. (Right) The results of the top up- and downregulated genes are shown in magnification, where the fold change of both HD-iBMECs vs. healthy was more than 3-times increased or decreased.
Figure 6
Figure 6
The Log Permeability values for tested compounds in iBMEC_33Q, plotted against their corresponding Log D pH7.4 values.
Figure 7
Figure 7
Expression levels of major BBB receptors and receptor-mediated transcytosis of Transferrin in the iBMECs. (A) Representatively cropped Western blot confirming the expression of ACE2, LRP1, HAP1, LDLR, and EGFR in iBMECs. β-actin was used as the loading control. (B) Representative cropped Western blot confirming the expression of TFR1 in iBMECs. Β-actin was used as the loading control. (C) iBMECs support the transcytosis of the transferrin; measured at 37 and 4 °C in the basal compartment after 2 h is the mean ± sd.
Figure 8
Figure 8
In vitro–in vivo correlation. Correlation between in vitro log permeability from iBMEC-healthy and in vivo human Log Kp,uu,CSF (data collected from the literature, Table S4). The solid line is the linear regression with an R2 value of 0.7.
Figure 9
Figure 9
Responsiveness of the BBB Models to TNFα. (A) TEER measures after 24 h and 48 h of TNFα treatment (filled columns) and control cells (empty columns); n = 3. (B) Paracellular markers permeability after 48 h of TNFα treatment (filled columns) and control cells (empty columns); n = 3. Statistical analysis (for TEER and Permeability) by Student’s t-test: * p < 0.05 and ** p < 0.01. (C) Change in the expression of selected genes in iBMECs after TNFα treatment; n = 75. Statistical analysis: two-way ANOVA followed by Bonferroni post hoc test, where *** p < 0.001 and **** p < 0.0001 and (D) heat map of the expression by family. Values are expressed as Log2 fold change expression after treatment reported to the untreated cells for each gene normalized to GAPDH.

References

    1. Mielcarek M. Huntington’s disease is a multi-system disorder. Rare Dis. 2015;3:e1058464. doi: 10.1080/21675511.2015.1058464. - DOI - PMC - PubMed
    1. Moffitt H., McPhail G.D., Woodman B., Hobbs C., Bates G.P. Formation of Polyglutamine Inclusions in a Wide Range of Non-CNS Tissues in the HdhQ150 Knock-In Mouse Model of Huntington’s Disease. PLoS ONE. 2009;4:e8025. doi: 10.1371/journal.pone.0008025. - DOI - PMC - PubMed
    1. Lin C.-Y., Hsu Y.-H., Lin M.-H., Yang T.-H., Chen H.-M., Chen Y.-C., Hsiao H.-Y., Chen C.-C., Chern Y., Chang C. Neurovascular abnormalities in humans and mice with Huntington’s disease. Exp. Neurol. 2013;250:20–30. doi: 10.1016/j.expneurol.2013.08.019. - DOI - PubMed
    1. Denis H.L., David L.S., Cicchetti F. Antibody-based therapies for Huntington’s disease: Current status and future directions. Neurobiol. Dis. 2019;132:104569. doi: 10.1016/j.nbd.2019.104569. - DOI - PubMed
    1. Drouin-Ouellet J., Sawiak S., Cisbani G., Lagacé M., Kuan W.-L., Saint-Pierre M., Dury R.J., Alata W., St-Amour I., Mason S.L., et al. Cerebrovascular and blood-brain barrier impairments in Huntington’s disease: Potential implications for its pathophysiology. Ann. Neurol. 2015;78:160–177. doi: 10.1002/ana.24406. - DOI - PubMed

Grants and funding